S-1/A: General form for registration of securities under the Securities Act of 1933
Published on
UNITED STATES SECURITIES AND EXCHANGE COMMISSION
Washington, D.C. 20549
FORM S‑1
REGISTRATION STATEMENT UNDER THE SECURITIES ACT OF 1933
PRE-EFFECTIVE AMENDMENT NO. 1
Registration No. 333-292812
| PRUCO LIFE INSURANCE COMPANY | ||
(Exact name of registrant as specified in its charter) | ||
| Arizona | ||
(State or other jurisdiction of incorporation or organization) | ||
| 6311 | ||
(Primary Standard Industrial Classification Code Number) | ||
| 22-1944557 | ||
| (I.R.S. Employer Identification Number) | ||
| C/O Pruco Life Insurance Company | ||
| 213 Washington Street, Newark, New Jersey 07102‑2992, (800) 778-2255 | ||
| (Address, including zip code, and telephone number, including area code, of registrant's principal executive offices) | ||
| C/O CT Corporation System 3800 North Central Avenue, Suite 460, Phoenix, Arizona 85012, (602) 248-1145 | ||
| (Name, address, including zip code, and telephone number, including area code, of agent for service) | ||
| Copies to: | ||
| Christopher J. Madin Vice President and Corporate Counsel Pruco Life Insurance Company 280 Trumbull Street Hartford, Connecticut 06103 (860) 534-6087 | ||
| May 1, 2026 | ||
(Approximate date of commencement of proposed sale to the public) | ||
If any of the securities being registered on this Form are to be offered on a delayed or continuous basis pursuant to Rule 415 under the Securities Act of 1933 check the following box: [X]
If this Form is filed to register additional securities for an offering pursuant to Rule 462(b) under the Securities Act, please check the following box and list the Securities Act registration statement number of the earlier effective registration statement for the same offering. [ ]
If this Form is a post-effective amendment filed pursuant to Rule 462(c) under the Securities Act, check the following box and list the Securities Act registration statement number of the earlier effective registration statement for the same offering. [ ]
If this Form is a post-effective amendment filed pursuant to Rule 462(d) under the Securities Act, check the following box and list the Securities Act registration statement number of the earlier effective registration statement for the same offering. [ ]
Indicate by check mark whether the registrant is a large accelerated filer, an accelerated filer, a non-accelerated filer, or a smaller reporting company. See the definitions of "large accelerated filer," "accelerated filer" and "smaller reporting company" in Rule 12b-2 of the Exchange Act.
Large accelerated filer [ ] | Accelerated filer [ ] | ||||
Non-accelerated filer [X] (Do not check if a smaller reporting company) | Smaller reporting company [ ] | ||||
| Emerging growth company [ ] | |||||
If an emerging growth company, indicate by check mark if the registrant has elected not to use the extended transition period for complying with any new or revised financial accounting standards provided pursuant to Section 13(a) of the Exchange Act. [ ]
The registrant hereby amends this registration statement on such date or dates as may be necessary to delay its effective date until the registrant shall file a further amendment which specifically states that this registration statement shall thereafter become effective in accordance with Section 8(a) of the Securities Act of 1933 or until the registration statement shall become effective on such date as the Commission acting pursuant to Section 8(a) may determine.
Explanatory Note:
Pruco Life Insurance Company (“Pruco”) is changing the registration form for the Contracts from Form S-3 to Form S-1 to facilitate Pruco’s intended reliance on Rule 12h-7 under the Securities Exchange Act of 1934 (the “1934 Act”). Rule 12h-7 exempts insurance companies from the 1934 Act’s periodic and current reporting requirements with respect to non-variable insurance products that are registered under the Securities Act of 1933, provided that certain conditions are satisfied. While registration on Form S-1 is not an express condition of Rule 12h-7, the eligibility requirements of Form S-3 require Registrant to file 1934 reports, making reliance on Rule 12h-7 and registration on Form S-3 generally incompatible.
Pruco decided to initially register the Contracts on Form S-3 in order to realize the benefits associated with that registration form (e.g., shorter-form prospectus and financials forward incorporated by reference). In light of certain business decisions, Pruco has decided that suspending 1934 Act reporting (by relying on Rule 12h-7) outweighs the benefits associated with Form S-3. Accordingly, Pruco is taking the necessary step of registering the Contracts on Form S-1.
PROSPECTUS
May 1, 2026
Index Strategies
For
Prudential FlexGuard® Life IVUL
Issued by
PRUCO LIFE INSURANCE COMPANY
213 WASHINGTON STREET
NEWARK, NEW JERSEY 07102
TELEPHONE: 800-778-2255
This prospectus describes index-linked investment options (“Index Strategies”) available with Prudential FlexGuard® Life IVUL (“FlexGuardSM Life”), a flexible premium variable and index-linked life universal insurance contract, (“Contract”). The Contract is issued by Pruco Life Insurance Company (“Pruco Life,” “we,” “our,” or “us”).
Generally, you (the “Contract Owner”) may choose to allocate your Contract's premiums and its earnings to (i) the Fixed Rate Option, (ii) one or more Variable Investment Options, and (iii) one or more Index Strategies. A description of the Fixed Rate Option, which pays a guaranteed interest rate, and a complete list of the available Variable Investment Options are included in the Contract’s prospectus. The Index Strategies are described herein.
We offer five types of Index Strategies which contain a total of eight investment options. The Index Strategies provide for participation in the performance of an associated, underlying index (“Index” or “Indices"), which excludes dividends. Each Index Strategy limits participation in both positive and negative performance of the return of the underlying Index. A more detailed description of the Index Strategies can be found within this prospectus.
You may allocate your premiums and transfer your Contract Fund amounts to the Index Strategies, subject to certain restrictions described herein. We hold the assets for the Index Strategies in a non-insulated, non-unitized separate account we have established to support our obligations with respect to the Index Strategies.
The Index Strategies (type/option) described in this prospectus are:
| Capped With Floor Index Strategy | Capped With Buffer Index Strategy | Enhanced Cap Rate With Spread and Buffer Index Strategy | Step Rate Plus With Buffer Index Strategy | Dual Directional With Buffer Index Strategy | ||||||||||
1 Year S&P 500® Cap Rate 0% Floor •Minimum Cap: 2% •Minimum Floor: 0% •Minimum Participation Rate: 100% | 1 Year S&P 500® Cap Rate 10% Buffer •Minimum Cap: 5% •Minimum Buffer: 10% •Minimum Participation Rate: 100% 1 Year S&P 500® Cap Rate 15% Buffer •Minimum Cap: 4% •Minimum Buffer: 15% •Minimum Participation Rate: 100% | 1 Year S&P 500® Enhanced Cap Rate 10% Buffer •Minimum Cap: 5% •Minimum Buffer: 10% •Minimum Participation Rate: 100% •Maximum Spread: 2% 1 Year S&P 500® Enhanced Cap Rate 15% Buffer •Minimum Cap: 4% •Minimum Buffer: 15% •Minimum Participation Rate: 100% •Maximum Spread: 2% | 1 Year S&P 500® Step Rate Plus 10% Buffer •Minimum Buffer: 10% •Minimum Participation Rate: 60% •Minimum Step Rate: 1% | 1 Year S&P 500® Dual Directional 10% Buffer •Minimum Cap: 1% •Minimum Buffer: 10% •Minimum Participation Rate: 100% 1 Year S&P 500® Dual Directional 15% Buffer •Minimum Cap: 1% •Minimum Buffer: 15% •Minimum Participation Rate: 100% | ||||||||||
Negative investment returns do not impact investments allocated to the 0% Floor option. Negative investment returns may result in a loss of up to 90% of amounts invested in 10% Buffer option Segments, and up to 85% of amounts invested in 15% Buffer option Segments.
Not all Index Strategies or options contained in this prospectus may be available under your version of the Contract. The following options will be available for Contracts purchased on or after March 17, 2025: 1 Year S&P 500® Cap Rate 15% Buffer, 1 Year S&P 500® Enhanced Cap Rate 10% Buffer, 1 Year S&P 500® Enhanced Cap Rate 15% Buffer, 1 Year S&P 500® Dual Directional 10% Buffer, and 1 Year S&P 500® Dual Directional 15% Buffer.
We may add new Index Strategies in the future. For any Index Strategies that are offered under this Contract, Participation Rates will be at least 50%, Cap Rates (if applicable) will be at least 1%, Spreads (if applicable) will be no greater than 10%, Step Rates (if applicable) will be at least 1%, Buffers (if applicable) will be at least 5%, and Floors (if applicable) will be at least 0%.
We may add Index Strategies that do not offer a Buffer or any downside protection. Further, we may remove Index Strategies, including all strategies that provide a Buffer or any downside protection. As a result, future Index Segments might not offer downside protection. At least one Index Strategy option will always be available. This means that we might eliminate all Index Strategies but one, and an investor would be limited to investing in one Index Strategy with terms that they may not find acceptable, or other investment options where the performance is not based on the performance of an index and do not offer protection from investment loss. If you are not satisfied with the investment options in your Contract, you may surrender it at any time. A surrender will result in a surrender charge in the first fifteen Contract Years and result in a decrease to your Cash Surrender Value. Further, if the total of your surrender proceeds and any withdrawals exceeds the total premiums paid, any excess amount will typically be taxed as ordinary income. You may also receive an additional amount upon surrender if you purchased the Enhanced Cash Value Rider. If you were to surrender your Contract and purchase another contract, the new contract would be subject to a new surrender charge period and would offer different investment options and have different fees, benefits, and risks.
The maximum amount that can be allocated annually to the Variable Investment Options from the Index Strategies is 25% of the maturity value of each Index Strategy Segment.
PLEASE READ THE PROSPECTUSES
This prospectus sets forth information about the Index Strategies and associated information related to the Contract that you should know before purchasing. Please read this prospectus for more detail about the Index Strategies. Keep it for future reference. This prospectus must be read along with the prospectus for your Contract. You must also read your Contract, which includes any optional riders you elected. Certain terms used in this prospectus may be defined in the prospectus for your Contract. Those terms have the same meaning when used in this prospectus. The prospectus describing your Contract can be found online at www.Prudential.com/eProspectus.
Clients seeking information regarding their particular investment needs should contact a financial professional. Index-linked and variable life insurance contracts are complex insurance and investment vehicles. You should work with a financial professional to decide whether the Contract and features are appropriate for you based on a thorough analysis of your particular needs, financial objectives, investment goals, time horizons and risk tolerance.
The Contract is not a short-term investment and may not be appropriate if you need ready access to cash. The Contract is designed to provide benefits on a long-term basis. Consequently, you should not use the Contract as a short-term investment or savings vehicle.
There is a risk of substantial loss of your principal. The risk of loss may be greater in the case of a withdrawal from a Segment with a Buffer on any date other than a Segment start date or maturity date. If you take a withdrawal (including withdrawals taken to pay Contract charges and expenses, Death Benefit payments, loans, transfers, and surrenders) prior to a Segment’s maturity, we will use an Interim Value to determine the fair market value of the Segment at the time of the transaction. The Interim Value is designed to represent the fair value of the Segment on the Valuation Day, taking into account the potential gain or loss of the Index at Segment maturity. The Interim Value reflects the change in fair value due to economic factors of the investment instruments (including derivatives) supporting the Segment. The Interim Value may result in a loss even if the Index Value at the time the Interim Value is calculated is higher than the Index Value on the Segment start date. Because the downside protection provided by a Buffer normally does not apply to the Interim Value, it is theoretically possible that you could lose most of your investment, potentially up to 100% of your investment, in extreme scenarios such as an unprecedented complete market collapse. Surrender charges, withdrawal fees and taxes may also apply to a withdrawal prior to a Segment’s maturity. See Valuing Your Investment And Interim Value Of Index Strategy Segments and RISK FACTORS on Page 5 for more information.
The Contract permits monthly charges to be deducted from the Index Strategies prior to the end of a Segment if amounts in the Variable Investment Options, Fixed Rate Option, and Fixed Holding Account are insufficient to cover monthly deductions, and such ongoing deductions could have adverse effects on values under the Contract. Investors should carefully consider whether to retain enough value in the Variable Investment Options and fixed options to cover their monthly deductions, and should consult with a financial professional about the appropriateness of the Index Strategies for them.
The Index Strategies investment options may not be available through all selling broker-dealers in the future. This prospectus does not constitute an offering in any jurisdiction in which such offering may not lawfully be made. This prospectus discloses all material terms of the Contract’s Index Strategies, including any state or intermediary variations.
We are obligated to pay all amounts promised to Contract Owners under the Contract. The obligations to Contract Owners and beneficiaries arising under the Contracts are our general corporate obligations. Guarantees and benefits within the Contract are subject to our creditworthiness and claims paying ability.
OTHER CONTRACTS
We offer a variety of fixed and variable life insurance contracts. They offer features and have fees and charges that are different from those offered by this prospectus. Not every contract or feature is offered through every selling firm or in every state. Upon request, your financial professional can show you information regarding other Pruco Life contracts that your financial professional sells. You can also contact us to find out more about the availability of any of the Pruco Life contracts.
AVAILABLE INFORMATION
Additional information about us and this offering is available in the registration statement and the exhibits thereto, as well as in documents incorporated by reference into this prospectus (which means they are legally part of this prospectus). You may review and obtain copies of these materials at no cost to you by contacting us. They may also be obtained through the Securities and Exchange Commission’s (“SEC”) website (www.SEC.gov), which the SEC maintains for us and other registrants that file electronically with the SEC. Please see How to Reach Us in ADDITIONAL INFORMATION later in this prospectus for our Service Office address.
THE CONTRACT IS NOT A DEPOSIT OR OBLIGATION OF, OR ISSUED, GUARANTEED OR ENDORSED BY, ANY BANK, AND IS NOT INSURED OR GUARANTEED BY THE U.S. GOVERNMENT, THE FEDERAL DEPOSIT INSURANCE CORPORATION (FDIC), THE FEDERAL RESERVE BOARD OR ANY OTHER AGENCY.
THESE SECURITIES HAVE NOT BEEN APPROVED OR DISAPPROVED BY THE SECURITIES AND EXCHANGE COMMISSION OR ANY STATE SECURITIES COMMISSION, NOR HAS THE SECURITIES AND EXCHANGE COMMISSION OR ANY STATE SECURITIES COMMISSION PASSED UPON THE ACCURACY OR ADEQUACY OF THIS PROSPECTUS. ANY REPRESENTATION TO THE CONTRARY IS A CRIMINAL OFFENSE.
PRUDENTIAL, PRUDENTIAL FINANCIAL, PRUCO LIFE AND THE ROCK LOGO ARE SERVICE MARKS OF THE PRUDENTIAL INSURANCE COMPANY OF AMERICA AND ITS AFFILIATES. OTHER PROPRIETARY PRUDENTIAL MARKS MAY BE DESIGNATED AS SUCH THROUGH USE OF THE SM OR ® SYMBOLS.
FOR FURTHER INFORMATION CALL 800-778-2255 OR GO TO OUR WEBSITE AT WWW.PRUDENTIAL.COM/EPROSPECTUS.
(This page is intentionally left blank.)
CONTENTS OF THIS PROSPECTUS
(This page is intentionally left blank.)
SUMMARY OF INDEX STRATEGIES
The Index Strategies are investment options to which you may choose to allocate all or part of your net premiums or Contract Fund, subject to restrictions when enrolled in the Segment Maturity Allocation Program and when used in combination with certain riders. See Segment Maturity Allocation Program and Riders later in this prospectus for more detail. The Index Strategies provide limited exposure to potential market growth opportunities with a certain level of protection in down market cycles. The Index Strategies receive an amount called “Index Interest,” which is based in part on the performance of an external index (“Index”), subject to minimums and maximums. Index Interest can be positive or negative, which means it is possible to lose value and prior earnings when investing in the Index Strategies.
We currently offer Index Strategies based on the S&P 500® Index Price Return, which is the S&P 500® Index excluding dividends. The S&P 500® Index is comprised of 500 stocks considered representative of the overall market. Although the Index Strategies provide Index Interest linked to an Index, money placed in the Index Strategies is not a direct investment in a particular Index (you cannot invest directly in an Index). You are not purchasing or investing in any of the stocks that make up the Index and therefore have no rights of ownership such as the right to earn dividends, receive distributions, or the right to vote. Since the S&P 500® Index Price Return does not include dividends, a direct investment in the securities comprising the Index may result in a higher rate of return. Life insurance contracts provide other benefits such as a Death Benefit and the downside protection options offered by this Contract.
Amounts in the Index Strategies become part of your Contract Fund. The Index Strategies are comprised of one or more Index Strategy Segments (“Segments”). When you allocate net premiums or transfer amounts from your Contract Fund to the Index Strategies, we place those funds temporarily into accounts called the Fixed Holding Accounts. Then, on each Monthly Transfer Date, we transfer the entire balance of the Fixed Holding Accounts into the corresponding Index Strategies. Each time we transfer the value of a Fixed Holding Account to an Index Strategy, we create a new Segment. Each Segment matures one year from the date it was created. We reserve the right to create Segments with maturity dates based on different durations. At Segment maturity we determine the change in Index Value and apply the Segment's predetermined Buffer, Spread, Step Rate, Participation Rate, Index Growth Floor, and Index Growth Cap, as applicable, to an Index Strategy, to ultimately calculate the Segment’s Index Interest and final Segment maturity value. The maximum amount that can be allocated annually to the Variable Investment Options from the Index Strategies is 25% of the maturity value of each Index Strategy Segment. For more information on the components and calculations of the Index Strategies, see DESCRIPTION OF THE INDEX STRATEGIES. We currently offer the following types of Index Strategies: Capped With Floor, Capped With Buffer, Enhanced Cap Rate With Spread and Buffer, Step Rate Plus With Buffer, and Dual Directional With Buffer.
How the Index Strategies Work
The following chart provides a comparative and summarized overview of the Index Strategies. A complete description of each Index Strategy with numeric examples is provided in the section DESCRIPTION OF THE INDEX STRATEGIES.
1
Provides a percentage of Index Interest up to a Cap (subject to a guaranteed minimum) and down to a Floor. •If the Index Return is positive, the Index Return is multiplied by the Participation Rate. ◦If the result is greater than or equal to the Cap Rate, then the percentage of Index Interest is equal to the Cap. ◦If the result is less than the Cap, the percentage of Index Interest is equal to the result. •If the Index Return is zero or negative, the percentage of Index Interest is 0% due to the 0% Floor. Offers downside protection, but limited upside potential. Guaranteed minimums: 1 Year S&P 500® Cap Rate 0% Floor ◦Minimum Cap: 2% ◦Minimum Floor: 0% ◦Minimum Participation Rate: 100% | Provides a percentage of Index Interest up to a Cap (subject to a guaranteed minimum) and down to any negative return in excess of a Buffer. •If the Index Return is positive, the Index Return is multiplied by the Participation Rate. ◦If the result is greater than or equal to the Cap Rate, then the percentage of Index Interest is equal to the Cap. ◦If the result is less than the Cap, the percentage of Index Interest is equal to the result. •If the Index Return is zero, the Index Interest is 0%. •If the Index Return is negative, and: ◦equal to or less than the Buffer, the percentage of Index Interest is 0%. ◦greater than the Buffer, the percentage of negative Index Interest is the amount by which the negative Index Return exceeds the Buffer. Offers a level of downside protection, but limits upside potential. Guaranteed minimums: 1 Year S&P 500® Cap Rate 10% Buffer ◦Minimum Cap: 5% ◦Minimum Buffer: 10% ◦Minimum Participation Rate: 100% 1 Year S&P 500® Cap Rate 15% Buffer* ◦Minimum Cap: 4% ◦Minimum Buffer: 15% ◦Minimum Participation Rate: 100% | Provides a percentage of Index Interest up to a Cap (subject to a guaranteed minimum) and down to any negative return in excess of a Buffer. •If the Index Return is positive, the Index Return is multiplied by the Participation Rate. ◦If the result is greater than or equal to the Cap Rate plus the Spread, the Index Interest is equal to the Cap Rate. ◦If the result is greater than the Spread, but less than the Cap Rate plus the Spread, the Index Interest is equal to the result minus the Spread. ◦If the result is greater than or equal to zero and equal to or less than the Spread, the percentage of Index Interest is 0%. •If the Index Return is negative, and: ◦equal to or less than the Buffer, the percentage of Index Interest is 0%. ◦greater than the Buffer, the percentage of negative Index Interest is the amount by which the negative Index Return exceeds the Buffer. Offers higher level of upside potential, after the deduction of a Spread, along with downside protection. Guaranteed minimums/maximums: 1 Year S&P 500® Enhanced Cap Rate 10% Buffer* ◦Minimum Cap: 5% ◦Minimum Buffer: 10% ◦Minimum Participation Rate: 100% ◦Maximum Spread: 2% 1 Year S&P 500® Enhanced Cap Rate 15% Buffer* ◦Minimum Cap: 4% ◦Minimum Buffer: 15% ◦Minimum Participation Rate: 100% ◦Maximum Spread: 2% | Provides a percentage of Index Interest up to the greater of 1) the Index Return multiplied by a Participation Rate and 2) a Step Rate (both subject to a guaranteed minimum) and down to any negative return in excess of a Buffer. •If the Index Return is zero or positive, the percentage of Index Interest is equal to the greater of (a) the Index Return multiplied by the Participation Rate and (b) the Step Rate. •If the Index Return is negative, and: ◦equal to or less than the Buffer, percentage of Index Interest is 0%. ◦greater than the Buffer, the percentage of negative Index Interest is the amount by which the negative Index Return exceeds the Buffer. Offers an upside potential with no maximum, as well as a level of downside protection. Guaranteed minimums: 1 Year S&P 500® Step Rate Plus 10% Buffer ◦Minimum Buffer: 10% ◦Minimum Participation Rate: 60% ◦Minimum Step Rate: 1% | Provides a percentage of Index Interest up to a Cap (subject to a guaranteed minimum) when the Index Return is positive and down to any negative return in excess of a Buffer when the Index Return is negative. •If the Index Return is positive, the Index Return is multiplied by the Participation Rate. ◦If the result is greater than or equal to the Cap Rate, then the percentage of Index Interest is equal to the Cap. ◦If the result is less than the Cap, the percentage of Index Interest is equal to the result. •If the Index Return is zero, the Index Interest is 0%. •If the Index Return is negative, and: ◦equal to or less than the Buffer, a positive percentage of Index Interest amount is applied. The percentage is equal to the absolute value of the result. ◦greater than the Buffer, the percentage of negative Index Interest is the amount by which the negative Index Return exceeds the Buffer. Offers a level of downside protection and upside potential even when Index Returns are negative. Guaranteed minimums: 1 Year S&P 500® Dual Directional 10% Buffer* ◦Minimum Cap: 1% ◦Minimum Buffer: 10% ◦Minimum Participation Rate: 100% 1 Year S&P 500® Dual Directional 15% Buffer* ◦Minimum Cap: 1% ◦Minimum Buffer: 15% ◦Minimum Participation Rate: 100% | ||||||||||
| * The following options are available for Contracts purchased on or after March 17, 2025: 1 Year S&P 500® Cap Rate 15% Buffer, 1 Year S&P 500® Enhanced Cap Rate 10% Buffer, 1 Year S&P 500® Enhanced Cap Rate 15% Buffer, 1 Year S&P 500® Dual Directional 10% Buffer, and 1 Year S&P 500® Dual Directional 15% Buffer. | ||||||||||||||
2
 | ||||||||||||||
Examples:
The Cap Rate, when applicable, is the maximum of any positive interest we will credit when the Index Return is positive. For example, if the Index Return is 12% and the Cap Rate is 4%, we will credit 4% interest at the end of the Segment, meaning your Index Value will increase by that percent.
The Floor, when applicable, is the maximum amount your Segment Value may decline due to negative Index performance. For example, if the Index Return is -12% and the Floor is 0%, your Index Value will decline by 0% at the end of the Segment.
The Buffer, when applicable, is the level of protection from negative Index Returns. Any negative return that exceeds the Buffer level will result in a negative impact to your Segment Value. For example, if the Buffer level is 10% and the Index Return is -12%, your Index Value will decline by 2% (the amount of negative return in excess of the Buffer) at the end of the Segment.
The Participation Rate is a percentage that is multiplied by the positive Index Return to calculate the amount of Index Interest that will apply to a Segment (not to exceed the Cap, when applicable). For example, if the Index Return is 10% and the Participation Rate is 70%, the amount of interest calculated is 7% (10% x 70% = 7%).
The Spread, when applicable, is a percentage that reduces the value of positive Index Returns used in the calculation of Index Interest that will apply to a Segment. The Spread is subtracted from the Index Return. For example, if the Index Return is 10% and the Spread is 2%, the Index Return that would be used to calculate Index Interest is 8% (10% - 2% = 8%).
The Step Rate, when applicable, is the minimum rate that may be credited to a Segment when the Index Return is zero or positive. For example, if the Step Rate is 6% and the Index Return is 1%, the amount of Index Interest we will credit is 6%.
3
The features of an Index Strategy may change from one term to the next, new Index Strategies may be added, and existing Index Strategies may be terminated. We do not guarantee that the Company will always offer Index Strategies that provide downside protection. For any Index Strategies that are offered under this Contract, Participation Rates will be at least 50%, Cap Rates (if applicable) will be at least 1%, Spreads (if applicable) will be no greater than 10%, Step Rates (if applicable) will be at least 1%, Buffers (if applicable) will be at least 5%, and Floors (if applicable) will be at least 0%.
If you choose to invest in Index Strategies, you must provide us with written allocation instructions in Good Order. You may change these instructions at any time, but we reserve the right to defer allocation instructions into Index Strategies received less than two business days prior to a Segment’s start date until the next available Segment start date for that Index Strategy. For currently available Index Strategies and associated rates, please refer to our website at www.Prudential.com/eProspectus. Any changes to Index Strategies’ availability or rates (other than upside limits) will be described in the prospectus. You will receive notice of new upside limit rates prior to a Segment start date. Our current administrative practice is to set upside limit rates monthly and make them available on our website by the fifth day of each month. The rate applicable to a Segment is the rate that is currently in force and shown on our website on the Segment start date. All Segments are created on the 15th of the month (or the next business day, if the 15th falls on a weekend or holiday), which means investors will typically have at least ten days to review current rates before the next Segment is created. New rates may be different than rates previously applied to your Contract and from the current rates that we are offering for newly issued Contracts. We currently offer Index Strategies for one-year terms. The Contract currently offers Index Strategies with 10% and 15% Buffers, and different Buffers may be offered with new Index Strategy options. When we offer a new Index Strategy with a Buffer, the Buffer will never be less than 5%. Any loss beyond the Buffer level reduces the Contract Fund value allocated to the Index Strategy. This means it is possible for you to lose up to 95% of your investment in a Segment that is allocated to an Index Strategy with a 5% Buffer. Please see Types of Index Strategies for more information.
If (1) you take a loan or withdrawal, (2) you transfer out of a Segment prior to maturity, (3) we process a Contract fee or charge, (4) surrender your Contract, or (5) we pay a death claim between a Segment start date and Segment maturity date of an Index Strategy with a Buffer, we will use an Interim Value to determine the fair market value of each Index Strategy Segment at the time of the transaction. The Interim Value is also used to determine how much the Index Strategy Segment Base will be reduced after a withdrawal, transfer or charge. If you withdraw, transfer a portion out of, or we process a charge from Contract Fund amounts allocated to an Index Strategy with a Buffer, the withdrawal, transfer, or charge will cause an immediate reduction to your Index Strategy Segment Base in a proportion equal to the reduction in the Segment’s Interim Value. A proportional reduction could be larger than the dollar amount of your withdrawal, transfer or charge. Reductions to your Index Strategy Segment Base will negatively impact your Interim Value for the remainder of the Segment and will result in lower Index Interest on the Segment maturity date. Once your Index Strategy Segment Base is reduced during a Segment, it will not increase for the remainder of the Segment.
The Interim Value is designed to represent the fair value of the Index Strategy with a Buffer on each Valuation Day, taking into account the potential gain or loss of the Index at the Segment maturity date. The Interim Value reflects the change in fair value due to economic factors of the investment instruments (including derivatives) supporting the Index Strategies with a Buffer. The Interim Value helps protect us from bearing the costs of potential investment losses and ensures that we will be able to meet our obligations under the Contract when amounts are removed from an Index Strategy before the Segment maturity date. The Interim Value may result in a loss even if the Index Value at the time the Interim Value is calculated is higher than the Index Value on the Segment start date of an Index Strategy with a Buffer because the amount withdrawn will not participate in the Index Return at Segment maturity. Because the downside protection provided by a Buffer normally does not apply to the Interim Value, it is theoretically possible that you could lose most of your investment, potentially up to 100% of your investment, in extreme scenarios such as an unprecedented complete market collapse. See Effect Of Interim Value and Valuing Your Investment And Interim Value of Index Strategies with a Buffer for more information.
Each of these functions, components and calculations of the Index Strategies are described later in this prospectus. It is important that you understand how the Index Strategies function as well as the limitations and impacts on other Contract features and functions.
There is no additional charge for investing in an Index Strategy, however, Contract charges and expenses do apply. You should review the “Fee Table” and “Charges and Expenses” sections in the Contract’s prospectus for more information.
All guarantees are based on our claims paying ability and financial strength. Current and historical rates and performance for the Index Strategies can be found at www.Prudential.com/eProspectus.
Right To Cancel
Generally, you may return the Contract for a refund within 10 days after you receive it (or within any longer period of time required by state law). Please refer to your Contract’s prospectus for more information regarding your right to cancel (or “free look”) your Contract within a certain number of days. You may not allocate your Contract Fund to the Index Strategies prior to the end of your right to cancel period. Any amounts you have instructed us to allocate to the Index Strategies will be placed in a money market investment option until your right to cancel period has ended. At the end of your right to cancel period, any amounts you have instructed us to allocate to the Index Strategies will be placed in the Fixed Holding Accounts until the next Index Strategy Segment start date.
Right To Discontinue And Limit Amounts Allocated To The Index Strategies
We reserve the right to restrict or terminate future allocations to the Index Strategies at any time, however, at least one Index Strategy option will always be available. We may also temporarily suspend offering Index Strategy Segments at any time and for any reason including emergency conditions as determined by the Securities and Exchange Commission. We are not obligated to continue to offer Segments with any particular level of downside protection. We reserve the right to establish a maximum amount or a maximum percentage for any single Contract that can be allocated to the Index Strategies. We also reserve the right to impose a cut-off date for
4
allocations into an Index Strategy Segment. This would require Contract Funds to be allocated to a Fixed Holding Account a certain number of days prior to an Index Strategy Segment start date.
If an Index is discontinued or changed in a manner that results in a material change in the formula or method of calculating the Index, we reserve the right to substitute it with an alternative Index and will notify you of any such substitution. Upon substitution of an Index, we will calculate your Index Return on the replaced Index up until the date of substitution and the substitute Index from the date of substitution to the Index Strategy maturity date. An Index substitution will not change your Index Strategy. A substitution of an Index between the Index Strategy start date and Index Strategy maturity date may impact the calculation of your Index Interest on the Index Strategy maturity date. When we notify you of any substitution of an Index, we will also inform you of the potential impacts to your Index Interest.
RISK FACTORS
Risk Of Loss – Index Strategies – You take the investment risk for amounts allocated to one or more Index Strategies since the Index Interest is based upon the performance of the reference Index, subject to any limitations imposed by the Index Strategy. When applicable, the Buffer is the level of protection from negative Index Return provided by the Index Strategy. Any negative Index Interest in excess of the Buffer reduces the Contract Fund allocated to the Index Strategy. You bear the risk of the negative Index Return in excess of the Buffer. Please note, the assessment of fees and charges can also result in a reduction of the Contract Fund allocated to any of the Index Strategy types. Negative investment returns do not impact investment allocations to the 0% Floor option. Negative investment returns may result in a loss of up to 90% of amounts invested in 10% Buffer option Segments, and up to 85% of amounts invested in 15% Buffer option Segments.
Risks Associated With the Indices – Because the S&P 500® Index is comprised of a collection of equity securities, in each case the value of the component securities is subject to market risk, or the risk that market ups and downs may cause the value of the component securities to go up or down, sometimes rapidly and unpredictably. Market ups and downs can result from disasters and other events, such as storms, earthquakes, fires, outbreaks of infectious diseases (such as COVID-19), utility failures, terrorist acts, political and social developments, and military and governmental actions. In addition, the value of equity securities may increase or decline for reasons directly related to the issuers of the securities. Equity markets are subject to the risk that the value of the securities may fall due to general market and economic conditions. Market ups and downs may exist with these indices, which means that the value of the indices can change dramatically over a short period of time in either direction. Indices are not funds and are not available for direct investment. Since the S&P 500® Index Price Return does not include dividends, a direct investment in the securities comprising the Index may result in a higher rate of return. Life insurance contracts provide other benefits such as a Death Benefit and the downside protection options offered by this Contract.
Effect Of Interim Value – To determine the Interim Value for a Segment with a Buffer, we apply a formula which does not reflect the actual performance of the applicable Index, but rather a determination of the value of hypothetical underlying investments at the time of the Interim Value calculation. This amount could be more or less than if you had held the Segment with a Buffer until the Segment maturity date. It also means that you could have a negative performance, even if the value of the Index has increased at the time of the calculation. All withdrawals from a Segment with a Buffer on any date other than a Segment start date or maturity date, including withdrawals taken to pay Contract charges and expenses, death benefit payments, transfers, loans, and surrenders paid before the Segment maturity date will be based on the Interim Value. Withdrawals before a Segment maturity date could have adverse impacts even if the value of the Index has increased at the time of the calculation because an early withdrawal will not allow you to participate in the Index Return for the Segment with a Buffer with your entire Index Strategy Segment Base. Because the downside protection provided by a Buffer normally does not apply to the Interim Value, it is theoretically possible that you could lose most of your investment, potentially up to 100% of your investment, in extreme scenarios such as an unprecedented complete market collapse. If you withdraw Contract Funds allocated to an Index Strategy, the withdrawal will cause an immediate reduction to your Index Strategy Segment Base in a proportion equal to the reduction in your Interim Value. A proportional reduction may be larger than the dollar amount of your withdrawal even if the value of the Index has increased. See Impact Of Withdrawals On Segment Value (next below) for additional information.
Impact Of Withdrawals On Segment Value – Withdrawals taken for any reason, including to pay Contract charges and expenses, death benefit payments, transfers, loans, and surrenders, can negatively impact your Segment value. (1) If a withdrawal is taken from Contract Funds allocated to a Segment with a Buffer, the withdrawal will cause an immediate reduction to your Index Strategy Segment Base in a proportion equal to the reduction in your Segment’s Interim Value. A proportional reduction could be larger than the dollar amount of your withdrawal. Reductions to your Index Strategy Segment Base will negatively impact your Interim Value for the remainder of the Segment(s) with a Buffer and will result in the application of a lower Index Interest on the Segment with a Buffer at maturity. Once your Index Strategy Segment Base is reduced during any Segment with a Buffer, it will not increase for the remainder of the Segment with a Buffer. (2) If a withdrawal is taken from Contract Funds allocated to a floored (non-buffered) Segment it will cause an immediate reduction in your Index Segment Strategy Base and result in the application of lower Index Interest at maturity. Once your Index Strategy Segment Base is reduced during any floored Segment, it will not increase for the remainder of the floored Segment. In either instance, even if Index performance has been positive, the Index Return will be applied against a lower Index Segment Strategy Base resulting in lower (or zero) Index Interest.
Impact of Monthly Charges on Segment Value – The Contract permits monthly charges to be deducted from the Index Strategies prior to the end of a Segment if amounts in the Variable Investment Options, Fixed Rate Option, and Fixed Holding Account are insufficient to cover monthly deductions, and such ongoing deductions could have adverse effects on values under the Contract. Investors should carefully consider whether to retain enough value in the Variable Investment Options and fixed options to cover their monthly deductions, and should consult with a financial professional about the appropriateness of the Index Strategies for them.
5
Availability Of Index Strategies Will Vary Over Time – Before allocating to an Index Strategy Segment, you should determine the Index Strategies, Buffers, Spreads, Floors, Caps, Participation Rates and Step Rates available to you. We reserve the right to change Caps, Spreads, Participation Rates and/or Step Rates at any time prior to a Segment start date, subject to the applicable guaranteed minimum rate. At least one Index Strategy option will always be available, which means the Company reserves the right to eliminate all but one Index Strategy. There is no guarantee that an Index Strategy will be available in the future. You should make sure the Index Strategies you select are appropriate for your investment goals. A change in Cap, Spread, Participation or Step Rate may limit the Index Interest you receive. We reserve the right to offer Index Strategies with different Buffers, which may impact the amount of negative Index Interest applied to your Contract Fund.
Availability Of Index Strategies With Downside Protection May Vary – We may add Index Strategies that do not offer a Buffer or any downside protection. Further, we may remove all Index Strategies that provide a Buffer or any downside protection. As a result, future Index Segments would also change and there might not be any Segments that offer downside protection. If we choose not to offer an Index Strategy with downside protection or eliminate existing Index Strategies, you will have the option of allocating your funds to at least one Index Strategy, one or more Variable Investment Options, or the Fixed Rate Option. If you are not satisfied with the investment options in your Contract, you may surrender it at any time. A surrender will result in a surrender charge in the first fifteen Contract Years. Further, if the total of your surrender proceeds and any withdrawals exceeds the total premiums paid, any excess amount will typically be taxed as ordinary income. You may also receive an additional amount upon surrender if you purchased the Enhanced Cash Value Rider.
Reallocation Of Index Strategies – On the Segment maturity date for an Index Strategy Segment, the amount allocated to that Segment will be reallocated based upon your instructions we received in Good Order, or if none has been received in Good Order, automatically renew into the next available Segment for the same Index Strategy option. If the same Index Strategy is no longer available, the amount will be transferred into the Fixed Rate Option, and the amount may be transferred among the Variable Investment Options, subject to applicable transfer restrictions, or into another available Index Strategy on the next Index Strategy Segment start date. You must provide instructions for reallocation, in Good Order, at least two business days prior to a designated Segment start date. Failure to provide timely instructions may result in amounts being transferred into the Fixed Holding Account (if the existing Index Strategy no longer is available), and could remain in the Fixed Holding Account until the next Index Strategy Segment start date. The maximum amount that can be allocated annually to the Variable Investment Options from the Index Strategies is 25% of the maturity value of each Index Strategy Segment. This means that it may take years to exit the Index Strategies. In order to exit sooner, you would need to either take a withdrawal and incur partial surrender charges and taxes, enroll in a Segment Maturity Allocation Program (which would also take several years to exit and which prohibits allocations to the Index Strategies during that time), or allocate to the Fixed Rate Option (which is similarly restricted from allocating more than 25% to the Variable Investment Options).
Limitation On Index Interest – Index Growth Cap – If you elect an Index Strategy with an Index Growth Cap, the Index Interest is limited by any applicable Cap, which means that your Index Interest could be lower than if you had invested directly in a fund based on the applicable Index. The Index Growth Cap does not guarantee any level of Index Return. The Index Growth Cap exists for the full term of the Index Strategy Segment. Index Growth Caps, upon renewal, may be higher or lower than the initial Index Growth Cap but will never be less than the Guaranteed Minimum Index Growth Cap. Renewal Index Growth Caps may differ from the Caps used for new life insurance contracts or for other life insurance contracts issued at different times.
Limitation On Index Interest – Participation Rate – If you elect an Index Strategy with a Participation Rate, your Index Interest may be limited if the applicable Participation Rate is less than 100%, which means that your Index Interest may be lower than if you had invested directly in a fund based on the applicable Index. If you elect an Index Strategy with an applicable Participation Rate equal to 100%, your percentage of Index Interest will be equal to the Index Return subject to the effect of any Cap, Step Rate, or Spread (if applicable). If the Participation Rate is greater than 100%, your percentage of Index Interest may exceed the Index Return. A Participation Rate only applies when the Index Return is positive. The Participation Rate does not guarantee any level of Index Return. Participation Rates apply for the full term of the Index Strategy Segment. Participation Rates are determined at our discretion.
Limitation On Index Interest – Spread – If you elect an Index Strategy with a Spread, when the Index Return is positive and greater than the Spread, the Index Return will be reduced by the Spread, and subject to the Cap Rate to arrive at the Index Interest. If the Index Return is positive but less than or equal to the Spread, your Index Interest would be zero. As a result, your Index Interest could be lower than if you had invested directly in a fund based on the applicable Index or allocated to another available Index Strategy that does not include a Spread. The Spread exists for the full term of the Index Strategy and will never be greater than the Guaranteed Maximum Spread.
Limitation On Index Interest – Step Rate – If you elect an Index Strategy with a Step Rate, the Participation Rate may be less than 100%. If the Index Return is zero or positive, the percentage of Index Interest is equal to the greater of (a) the Index Return multiplied by the Participation Rate and (b) the Step Rate, which could result in lower Index Interest than if you had invested directly in a fund based on the applicable Index.
Substitution Of An Index – We have the right to substitute a comparable Index prior to an Index Strategy Segment maturity date if any Index is discontinued or if the calculation of an Index is substantially changed (such as a material change in the formula or method of calculating the Index). We would attempt to choose a substitute Index that has a similar investment objective and risk profile to the replaced Index and would notify you of any such substitutions. Upon substitution of an Index, we will calculate your Index Return on the replaced Index up until the date of substitution and the substitute Index from the date of substitution to the Segment maturity date. Other than the reference Index, an Index substitution will not change the terms of your Index Strategy. The performance of the new Index may not be as good as the one that it substituted and as a result your Index Return may have been better if there had been no substitution. At least one Index Strategy will always be available on your Contract, but we reserve the right to close an Index Strategy at any time. If this happens, no new transfers to that Index Strategy will be allowed and amounts expiring on Segment maturity dates
6
will be moved by us to the Fixed Rate Option, unless you submit separate maturing Segment allocation instructions, until no value remains in that Index Strategy. If an Index Strategy is withdrawn, replaced, or closed, we will notify you and any assignee of record.
Effect Of Certain Contract Riders – (1) If your Contract includes either the BenefitAccess Rider or Overloan Protection Rider, you may be required to reallocate your entire Contract Fund to the Fixed Rate Option. While the riders’ conditions are in effect, you will not have access to the Index Strategies or the Variable Investment Options, which could result in limiting the growth potential of your Contract Fund. (2) If you elect the Extended Plus No-Lapse Guarantee option of the Lapse Protection Rider, you will only be able to allocate your Contract Fund to the Index Strategies with Buffers for the first ten (10) Contract Years. You will not be able to allocate to the other investment options until your eleventh (11) Contract Year.
Potential Federal Tax Consequences – Your Contract is structured to meet the definition of life insurance under Section 7702 of the Internal Revenue Code. At issue, the Contract Owner chooses one of the following definition of life insurance tests: (1) Cash Value Accumulation Test or (2) Guideline Premium Test. We reserve the right to refuse to accept a premium payment that would, in our opinion, cause this Contract to fail to qualify as life insurance for federal tax purposes. Although we believe that the Contract should qualify as life insurance for tax purposes, there are some uncertainties, particularly because the Secretary of Treasury has not yet issued permanent regulations that bear on this question. Current tax law generally excludes Death Benefits from the gross income of the beneficiary of a life insurance contract. However, the Death Benefit paid to the Beneficiary could be subject to income tax in certain instances, such as if the Contract was previously transferred in a reportable policy sale. Your Death Benefit may also be subject to estate tax. In addition, you generally are not subject to taxation on any increase in the Contract value until it is withdrawn. Generally, you are taxed on surrender proceeds and the proceeds of any withdrawals only if those amounts, when added to all previous distributions, exceed the total premiums paid. Amounts received upon surrender or withdrawal (including any outstanding Contract loans) in excess of premiums paid are treated as ordinary income.
Special rules govern the tax treatment of life insurance policies that meet the definition of a Modified Endowment Contract under Section 7702A of the Internal Revenue Code. The Contract could be classified as a Modified Endowment Contract if premiums in amounts that are too large are paid or a decrease in the Basic Insurance Amount is made (or a rider removed). Under current tax law, pre-death distributions, including loans and assignments, are taxed less favorably (on a gain-first basis) under Modified Endowment Contracts. Death Benefit payments under Modified Endowment Contracts, however, like Death Benefit payments under other life insurance contracts, generally are excluded from the gross income of the beneficiary.
Disclosure contained herein is based on current tax law and not intended as tax advice. Tax laws and interpretations are subject to change at any time, which may impact your Contract. You should consult your own tax adviser for complete information and advice.
Issuing Company – No company other than Pruco Life has any legal responsibility to pay amounts that Pruco Life owes under the Contract. You should look to the financial strength of Pruco Life for its claims-paying ability. Amounts allocated to the Index Strategies are held in a non-registered, non-insulated separate account. These assets are subject to the claims of the creditors of Pruco Life and the benefits provided under the Index Strategies are subject to the claims paying ability of Pruco Life.
Business Continuity Risks – The Company is also subject to risks related to disasters and other events, such as storms, earthquakes, fires, outbreaks of infectious diseases (such as COVID-19), utility failures, terrorist acts, political and social developments, and military and governmental actions. These risks are often collectively referred to as “business continuity” risks. These events could adversely affect the Company and our ability to conduct business and process transactions. Although the Company has business continuity plans, it is possible that the plans may not operate as intended or required and that the Company may not be able to provide required services, process transactions, deliver documents or calculate values. It is also possible that service levels may decline as a result of such events.
Cyber Security Risks – With the increasing use of technology and computer systems in general and, in particular, the internet to conduct necessary business functions, we are susceptible to operational, information security and related risks. These risks, which are often collectively referred to as “cyber security” risks, may include deliberate or malicious attacks, as well as unintentional events and occurrences. These risks are heightened by our offering of products with certain features, including those with automatic asset transfer or re-allocation strategies, and by our employment of complex investment, trading and hedging programs. Cyber security is generally defined as the technology, operations and related protocol surrounding and protecting a user’s computer hardware, network, systems and applications and the data transmitted and stored therewith. These measures ensure the reliability of a user’s systems, as well as the security, availability, integrity, and confidentiality of data assets. Deliberate cyber-attacks can include, but are not limited to, gaining unauthorized access (including physical break-ins and attempts to fraudulently induce employees, customers, or other users of these systems to disclose sensitive information in order to gain access) to computer systems in order to misappropriate and/or disclose sensitive or confidential information; deleting, corrupting or modifying data; and causing operational disruptions. Cyber-attacks may also be carried out in a manner that does not require gaining unauthorized access, such as causing denial-of-service attacks on websites (in order to prevent access to computer networks). In addition to deliberate breaches engineered by external actors, cyber security risks can also result from the conduct of malicious, exploited or careless insiders, whose actions may result in the destruction, release or disclosure of confidential or proprietary information stored on an organization’s systems.
Ukraine-Russia Conflict Risk – The military invasion of Ukraine initiated by Russia in February 2022 and the resulting response by the United States and other countries have led to economic disruptions, as well as increased volatility and uncertainty in the financial markets. It is not possible to predict the ultimate duration and scope of the conflict, or the future impact on U.S. and global economies and financial markets. The performance of the Index(es) may be adversely affected.
7
DESCRIPTION OF THE INDEX STRATEGIES
Investing In the Index Strategies
Premium Allocations To the Index Strategies – Net premiums are allocated to your investment options pursuant to your premium allocation instructions, subject to restrictions when used in combination with certain riders or if you're enrolled in the Segment Maturity Allocation Program. See Segment Maturity Allocation Program below and Riders later in this prospectus for more detail. You may allocate up to 100% of your net premiums to the Index Strategies. Net premium allocation instructions are also used for any other amounts placed into the Contract Fund, such as loan repayments, interest credits on outstanding loans, and any Enhanced Disability Benefit payment.
Fixed Holding Accounts – Net premiums and other amounts allocated to the Index Strategies, or funds requested to be transferred to the Index Strategies, will be temporarily placed in a Fixed Holding Account corresponding to an Index Strategy on the effective date of the payment or requested transfer, prior to being transferred to the Index Strategy Segment(s) on the Monthly Transfer Date. Additionally, any portion of a maturing Segment allocated to the Index Strategies will also be placed in a Fixed Holding Account on the applicable Segment maturity date, prior to reallocation to the next Segment or another investment option per your instructions. Net premiums may not be directly allocated to the Fixed Holding Account, as it is only intended to temporarily hold the funds that are being allocated, or requested to be transferred, to a corresponding Index Strategy. Transfers out of a Fixed Holding Account may be requested. For more information, see Transfers And Restrictions On Transfers. Funds may be deducted from a Fixed Holding Account to pay monthly charges, withdrawals, or loans.
Amounts in the Fixed Holding Accounts are part of your Contract Fund. We guarantee that the part of the Contract Fund allocated to the Fixed Holding Accounts will accrue interest daily at an effective annual rate that we declare periodically, but not less than an effective annual rate of 1%. We are not obligated to credit interest at a rate higher than an effective annual rate of 1%, although we may do so.
Monthly Transfer Dates – Each month the current value of the Fixed Holding Accounts (including any interest earned) is transferred into new Segments for the Index Strategies you selected. This transfer occurs on the 15th day of each month and we may refer to it as the Segment start date. If the 15th of the month falls on a weekend or holiday, or any other time the New York Stock Exchange ("NYSE") is closed, the transfer to the Segments will process on the next business day, but we will use the last published Index Value preceding the start date. For example, October 15, 2022, falls on a Saturday, therefore, the transfer from the Fixed Holding Accounts to the Index Strategies would process on Monday, October 17, 2022, with a starting Index Value based on the closing Index Value from Friday, October 14, 2022.
We reserve the right to retain any funds in the Fixed Holding Accounts that were received into the Fixed Holding Accounts within two business days prior to a start date until the following start date. We will notify you in advance if we exercise this right.
Index Strategy Segments (“Segments”) – A new Index Strategy Segment may be created on each monthly Segment start date. Amounts transferred from the Fixed Holding Accounts are combined with any Designated Transfer amounts when creating new Segments. Segments may only be created on monthly start dates. At any given time, the value in the Index Strategies will be equal to the sum of the value in each Segment.
The Segment duration is the time-period allocated to each Index Strategy Segment. The term begins on the Segment start date and ends on the Segment maturity date. Segment durations are one (1) year.
Once a Segment is created its Index Growth Cap, Step Rate, Spread, Participation Rate, Buffer and Floor, as applicable, cannot be changed. No transfers may be requested out of a Segment prior to the Segment maturity date. Under certain circumstances, the Contract may require amounts to be transferred out of Segments prior to the maturity date(s). See IMPORTANT CONSIDERATIONS OF INVESTING IN THE INDEX STRATEGIES ON CONTRACT FUNCTIONS, FEATURES, AND RIDERS later in this prospectus.
Segment Maturity – Segments mature one year from the Segment start date on which they were created. If the 15th of the month falls on a weekend or holiday, or any other time the NYSE is closed, the Segment's maturity will be processed on the next business day, but we will use the last published Index Value preceding the Segment maturity date. Continuing with the example under Monthly Transfer Dates above, when the Index Interest is applied in October of 2023, it would be based on the closing Index Values from Friday, October 14, 2022, and Friday, October 13, 2023, since October 15, 2023, falls on a Sunday.
At Segment maturity, Index Interest may be applied. If your Contract lapses or terminates before the Segment maturity date, no Index Interest will be applied.
After the Contract is issued, you may submit maturing Segment allocation instructions that will direct the proceeds of maturing Segments to your chosen investment option(s), including the Fixed Rate Option, the Index Strategies, or Variable Investment Options, subject to the provisions of any optional Riders you have elected. The maximum amount that can be allocated annually to the Variable Investment Options from the Index Strategies is 25% of the maturity value of each Index Strategy Segment. This means that it may take years to exit the Index Strategies. In order to exit sooner, you would need to either take a withdrawal and incur partial surrender charges and taxes, enroll in a Segment Maturity Allocation Program (which would also take several years to exit and which prohibits allocations to the Index Strategies during that time), or allocate to the Fixed Rate Option (which is similarly restricted from allocating more than 25% to the Variable Investment Options).
If you elect the Extended Plus No-Lapse Guarantee option of the Lapse Protection Rider, your allocations are currently restricted to the Index Strategies with a Buffer for the first ten (10) Contract Years. Allocation instructions must be in whole percentages totaling 100%. Your maturing Segment allocation instructions must be received in Good Order at our Service Office to become effective. By default, and unless maturing Segment allocation instructions are provided by you, 100% of a maturing Segment value will be allocated
8
to the next available Segment of the same Index Strategy. Value from maturing Segments allocated to the Index Strategies will be temporarily placed into the corresponding Fixed Holding Account on the Segment maturity date and included in the current monthly transfer process to establish a new Segment.
We reserve the right to delay the election of, or changes to, maturing Segment allocation instructions that are received within two business days prior to a monthly start date. We will notify you in advance if we exercise this right.
Segment Maturity Allocation Program – If you intend to reallocate the entire balance of your Index Strategies to the Variable Investment Options, you must schedule consecutive annual reallocations by enrolling in the Segment Maturity Allocation Program and following the instructions on our administrative form. The form can be requested by contacting your Pruco Life representative or our customer service office at 800-778-2255, Monday through Friday, 8:00 a.m. to 8:00 p.m., Eastern Time. While enrolled in this program, you will be prohibited from making any allocations to any Index Strategy and you will also be required to allocate the maximum allowable maturing Segment Value to the Variable Investment Options. If you have instructed us to make designated transfers, those instructions will terminate upon enrollment. It could take up to 35 months to complete the program. After this program, you may submit instructions to reallocate additional maturing Segment Values to the Variable Investment Option and you may provide new designated transfer instructions. If you have elected the Extended Plus No-Lapse Guarantee, you may not enroll in the Segment Maturity Allocation Program until the 11th Contract Year. Terms of this program are subject to change at our discretion.
Index – Each Index Strategy references an Index that determines the Index Return used to compute the Index Interest. When you allocate to an Index Strategy that is linked to the performance of an Index, you are not investing in the Index. We currently offer Index Strategies based on the S&P 500® Index Price Return, which is the S&P 500® Index excluding dividends. The S&P 500® Index is comprised of 500 stocks considered representative of the overall market. An Index is unmanaged and not available for direct investment. See Appendix B for important information about the Index.
Index Value – The Index Value on any date is the published value of the S&P 500® Index, excluding any dividends that may be paid by the firms that comprise the Index, as of the close of business on that date. If there is no published closing value for the Index on a Segment start date or a Segment maturity date, we will use the most recently published closing value for the Index.
Index Strategy Segment Base – The Index Strategy Segment Base is used in determining the value of an Index Strategy Segment prior to the Segment maturity date and the Index Interest applied on the Segment maturity date.
For the Index Strategies without a Buffer, at any point in time prior to a Segment’s maturity date, the Index Strategy Segment Base is the initial amount transferred to the Segment on the start date, less amounts withdrawn and/or deducted (including loans).
For the Index Strategies with a Buffer, at any point in time prior to a Segment’s maturity date, the Index Strategy Segment Base is the initial amount transferred to the Segment on the start date, less amounts withdrawn and/or deducted (including loans) in the same proportion that the amounts reduced the Interim Value for that Segment.
If the Index Strategy Segment Base is less than zero, we will consider it to be zero.
Index Interest – Index Interest may be applied on each Segment maturity date using the Index Strategy Segment Base, the Index Value on the Segment maturity date, the Index Value on the Segment start date, the Participation Rate, the Index Growth Floor, the Index Growth Cap, the Buffer, the Spread, and the Step Rate. The method we use to compute interest is shown in the examples that follow for each Index Strategy. Index Interest can be positive or negative.
Participation Rate – The Participation Rate is used in determining Index Interest for each Index Strategy Segment. Index Interest is limited to the Participation Rate multiplied by the Index Return, minus the Spread (if applicable). We will determine the Participation Rate for each Segment in advance. Once a Segment is created, its Participation Rate will not change. The Participation Rate applicable for any future Index Strategy Segment may change at our discretion. The Participation Rate for each Segment will not be lower than the guaranteed minimum Participation Rate for the Index Strategy. For more information, see Types Of Index Strategies.
Index Growth Floor (“Floor”) – Certain Index Strategies apply an Index Growth Floor, which is used in determining Index Interest for each Segment. Losses resulting from negative Index Returns are prevented by the Index Growth Floor. We will determine the Floor for each Segment in advance. Once a Segment is created, its Floor will not change. The Floor applicable for any future Segments may change at our discretion. The Floor for each Segment will not be lower than the guaranteed minimum Index Growth Floor for the Index Strategy. The Floor is not a guarantee against loss, as the deduction of Contract charges and fees could reduce the overall cash value of the Index Strategy Segment. For more information, see Types Of Index Strategies.
Index Growth Cap (“Cap”) – Certain Index Strategies apply an Index Growth Cap, which is used in determining Index Interest for each Segment. Gains resulting from positive Index Returns are limited by the Index Growth Cap. We will determine the Cap for each Segment in advance. Once a Segment is created, its Cap will not change. The Cap applicable for any future Segment may change at our discretion. The Cap for each Segment will not be lower than the guaranteed minimum Index Growth Cap for the Index Strategy. For more information, see Types Of Index Strategies.
Buffer – Certain Index Strategies apply a Buffer, which is used in determining Index Interest for each Segment. Losses resulting from negative Index Returns are limited by the Buffer. Any negative Index Return in excess of the Buffer reduces the value of the Contract Fund. We will determine the Buffer for each Segment in advance. Once a Segment is created, its Buffer will not change. The Buffer applicable for any future Index Strategy may change at our discretion. The Buffer for each Segment will not be lower than the guaranteed minimum Buffer for the Index Strategy. The guaranteed minimum Buffer that may be offered for a new Index Strategy is 5%. For more information, see Types Of Index Strategies.
Step Rate – Certain Index Strategies apply a Step Rate, which is used in determining Index Interest for each Segment. If the Index Return is zero or positive, we will credit interest in an amount at least equal to the Step Rate. We will determine the Step Rate for each Segment in advance. Once a Segment is created, its Step Rate will not change. The Step Rate applicable for any future Segment
9
may change at our discretion. The Step Rate for each Segment will not be lower than the guaranteed minimum Step Rate for the Index Strategy. For more information, see Types Of Index Strategies.
Spread – Certain Index Strategies apply a Spread, which is used in determining Index Interest for each Segment. Gains resulting from positive Index Returns are reduced by the Spread. We will determine the Spread for each Segment in advance. Once a Segment is created, its Spread will not change. The Spread applicable for any future Segment may change at our discretion. The Spread for each Segment will not be greater than the guaranteed maximum Spread for the Index Strategy. For more information, see Types Of Index Strategies.
Designated Transfers – To facilitate large premium payments intended for the Index Strategies, you may establish reoccurring, monthly transfers, called Designated Transfers, to the Index Strategies. This will allow for multiple Segments for each Index Strategy to be created, over time, from one (or more) premium payment. When you create a Designated Transfer, we move the dollar amount specified from the Fixed Rate Option to the elected Index Strategies on the Monthly Transfer Date. The amount of the Designated Transfer is combined with any amounts transferred from the corresponding Fixed Holding Accounts to form new Segments. You may choose to limit the number of monthly Designated Transfers to a set number of occurrences. Designated Transfers must be specified in dollar amounts (not percentages) and can be directed to one or more of the available Index Strategies. Designated Transfers may not originate from any of the Variable Investment Options. There is no minimum Designated Transfer dollar amount or number of occurrences.
If on any Monthly Transfer Date, the value in the Fixed Rate Option is less than the specified amount, we will transfer the full value of Fixed Rate Option to the designated Index Strategy(ies). Months where only a partial transfer or no transfer takes place because the Fixed Rate Option has insufficient value, or no value, will count against the number of months elapsed in your instructions. Your Designated Transfer instructions stay in effect until cancelled by you, are stopped by us due to certain situations described under Loans and Riders, you enroll in the Segment Maturity Allocation Program, or the requested number of monthly occurrences have been processed. If the Fixed Rate Option value is zero and the Designated Transfer instructions have not been cancelled, stopped, or expired, Designated Transfers will automatically resume when the Fixed Rate Option value is replenished. You may change the amount of the Designated Transfer at any time and your new instructions will take effect on the next Monthly Transfer Date.
Your request to change or cancel your Designated Transfer instructions must be received in Good Order at our Service Office to become effective. We reserve the right to postpone the effective date for one month of any request to add or change a Designated Transfer if the request is received within two business days of a monthly start date. We will notify you in advance if we exercise this right.
Types Of Index Strategies
The Contract offers multiple Index Strategies which provide Index Interest based on the performance of an underlying Index. Index Interest is the amount you receive on an Index Strategy Segment maturity date based on the Index Strategy Segment Base and the performance limitations imposed by the Index Strategy. The Index Interest may be positive or negative, which means you can lose Contract Fund value and prior earnings. You may allocate all or a portion of your premium payments or Contract Fund into one or more Index Strategies. The Index Strategies are not invested in any underlying Index. We do not guarantee any Index Interest will be applied to the Index Strategy Segments. There is a risk of loss of your investment with Buffered strategies because the Segment will participate in the negative Index Return in excess of the level of protection provided by the Buffers. There is also a risk of loss with the Capped with Floor Index Strategy if the Index Return is less than the Contract fees and charges assessed during the Segment.
We currently offer the following Index Strategies: Capped With Floor, Capped With Buffer, Enhanced Cap Rate With Spread And Buffer, Step Rate Plus with Buffer, and Dual Directional With Buffer. These Index Strategies are explained below. As a result of economic market conditions, or utilization of the Index Strategies, we reserve the right to add and remove Index Strategies at any time. Additions or removals would be effective with any newly issued contracts or upon reallocation for any existing Contract Owner. Index Strategy removals would not impact existing Contract Owners currently allocated to that Index Strategy prior to the maturity date(s) of any open Segment(s). Index Strategy reallocation instructions must be made via a form provided by us.
If you are allocating to an Index Strategy with an additional Premium Payment, please note that we reserve the right to limit, suspend or reject any additional Premium Payment at any time, but would do so only on a non-discriminatory basis.
Note Regarding Examples – The examples set forth below, as well as other examples found throughout this prospectus, are intended to illustrate how various features of the Contract work. These examples should not be considered a representation of past or future performance of any Index Strategies. Actual performance may be greater or less than those shown in the examples. Similarly, the percentage of Index Interest in the examples are not an estimate or guarantee of future Index performance. The Caps, Participation Rates, Step Rates, Buffers, Floor, and Spread for the Index Strategies shown in the following examples are for illustrative purposes only and may not reflect actual declared rates. In addition, values may be rounded for display purposes only.
10
Capped With Floor Index Strategy
■1 year S&P 500® Cap Rate 0% Floor option
The Capped With Floor Index Strategy offers potential for Index Interest up to an Index Growth Cap (“Cap”) and protects your Contract from losses through an Index Growth Floor (“Floor”). The Floor is 0% in all scenarios, which means that you will never lose your investment due to negative Index Returns.
The Index Growth Floor is the minimum rate of interest that will be applied to a given Segment and is used in determining the Index Interest for each Segment at maturity. When calculating the Index Interest, the Index Growth Floor is applied after the Participation Rate and before the Index Growth Cap.
The guaranteed minimum Index Growth Floor rate for the Capped with Floor Index Strategy is 0%. At Segment maturity, the Index Growth Floor will be applied when determining the Index Interest.
Although the floor provides protection against loss due to negative Index Returns, the deduction of Contract charges and fees could reduce the overall cash value of the Index Strategy.
The Index Growth Cap (“Cap”) is the maximum rate that may be credited to a Capped with Floor Index Strategy Segment. A different Cap may be declared for different Segments. The Capped with Floor Index Strategy is available in 1-year Segments.
If the Index Return multiplied by the Participation Rate is positive and equal to or greater than the Cap, then the percentage of Index Interest is equal to the Cap. If the Index Return multiplied by the Participation Rate is positive, but less than the Cap, the percentage of Index Interest is equal to the Index Return multiplied by the Participation Rate.
If the Index Return is equal to or less than the Floor, the percentage of Index Interest is equal to the Floor.
Hypothetical Example: how the Capped With Floor Index Strategy works
| Assumptions: Cap (8%); Floor (0%); Participation Rate (100%) | |||||||||||
Scenario 1: Positive Index Return of 4% is less than the Cap. Your percentage of Index Interest is 4%. | Scenario 2: Positive Index Return of 15% exceeds the Cap. Your percentage of Index Interest is 8% which is equal to the Cap. | Scenario 3: Flat Index Return of 0% is equal to the Floor. Your percentage of Index Interest is 0%. | Scenario 4: Negative Index Return of -5% is below the Floor. Due to the 0% floor, you are protected from loss and your percentage of Index Interest is 0%. | ||||||||
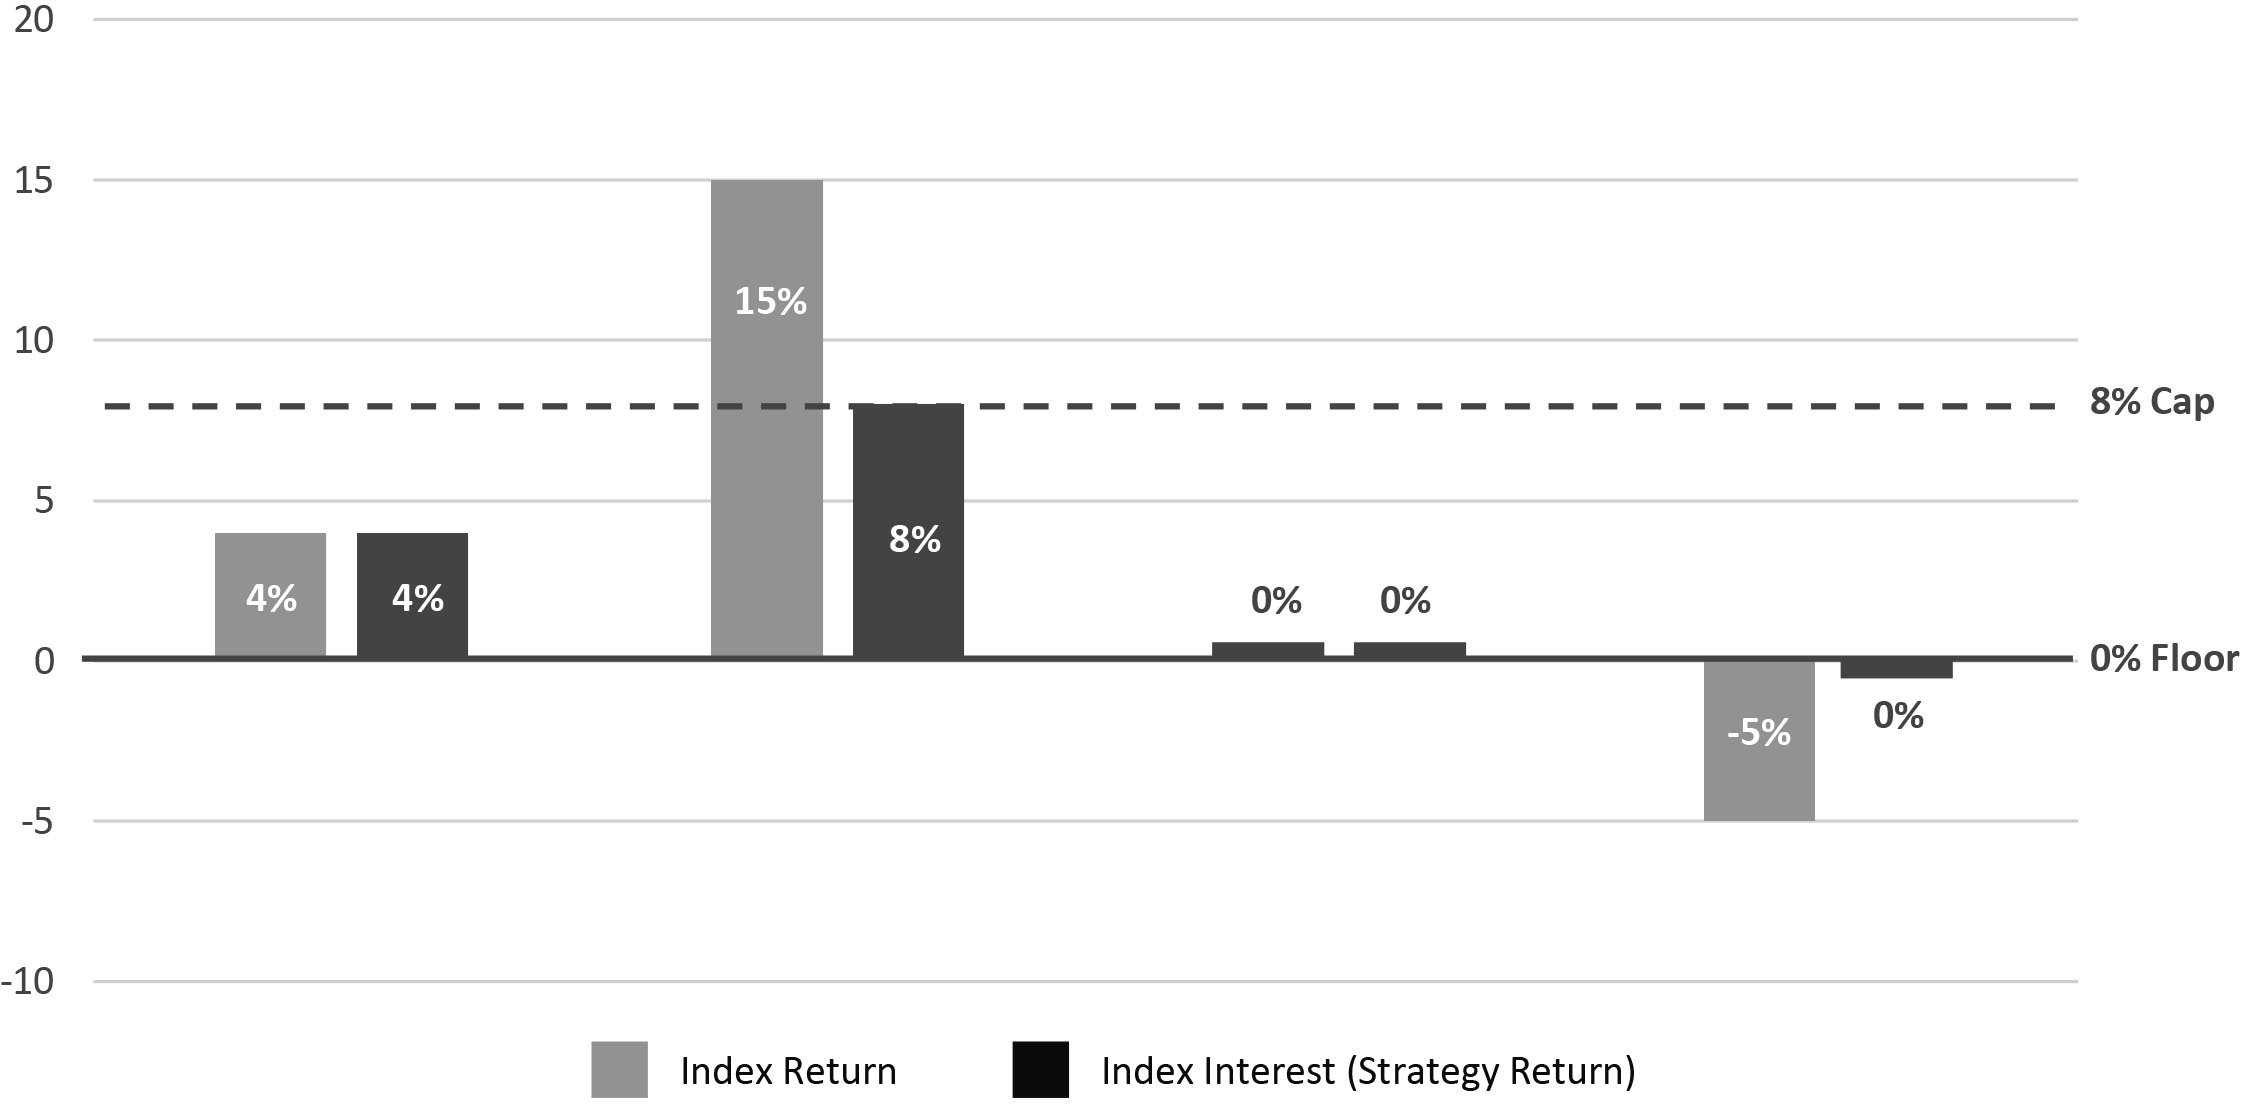 | |||||||||||
In the preceding hypothetical example the strategy's upside potential equals 100% of the Index Return up to an assumed Index Growth Cap of 8%. Downside protection is provided by the Floor where index losses below the Floor are protected.
The Cap, Participation Rate and Floor apply to a Segment for the duration of the Segment. We will declare new rates for each subsequent Segment.
Subsequent Caps may be higher or lower than previously declared Caps but will never be less than the guaranteed minimum Index Growth Cap. Subsequent Caps may differ from the Caps used for new contracts or for other contracts issued at different times. We will determine new Caps on a basis that does not discriminate unfairly within any class of contracts. The guaranteed minimum Index Growth Cap equals 2.00% for a one-year Segment.
11
The Participation Rate applicable for any future Index Strategy Segment may change at our discretion. The Participation Rate for each Segment will not be lower than the guaranteed minimum Participation Rate. The guaranteed minimum Participation Rate is 100%.
Capped With Buffer Index Strategy
■1 Year S&P 500® Cap Rate 10% Buffer option
■1 Year S&P 500® Cap Rate 15% Buffer option
The Capped with Buffer Index Strategy offers potential for Index Interest up to an Index Growth Cap (“Cap”) and provides a level of downside protection through a Buffer.
The Index Growth Cap (“Cap”) is the maximum rate that may be credited to a Capped with Buffer Index Strategy Segment at maturity. Cap Rates may vary by Buffer option. A different Cap may be declared for different Segments. The Capped with Buffer Index Strategy is available in 1-year Segments.
The Buffer is the level of protection from negative Index Return applied to amounts allocated to a Segment on the maturity date. Any negative Index Return in excess of the Buffer reduces the maturity value of the Contract Fund allocated to the Segment. This Index Strategy provides an option with a 10% Buffer and a 15% Buffer.
If the Index Return multiplied by the Participation Rate is positive and equal to or greater than the Cap, then the percentage of Index Interest is equal to the Cap. If the Index Return multiplied by the Participation Rate is positive, but less than the Cap, the percentage of Index Interest is equal to the Index Return multiplied by the Participation Rate.
If the Index Return is zero or negative, but less than or equal to the Buffer, the percentage of Index Interest is 0%. Otherwise, the percentage of Index Interest is equal to the negative Index Return in excess of the Buffer. The Participation Rate does not apply when the Index Return is negative.
Hypothetical Example: how the Capped With Buffer Index Strategy works
| Assumptions: Cap (12%); Buffer (10%); Participation Rate (100%) | |||||||||||
Scenario 1: Positive Index Return of 4% is less than the Cap. Your percentage of Index Interest is 4%. | Scenario 2: Positive Index Return of 20% exceeds the Cap. Your percentage of Index Interest is 12%, which is equal to the Cap. | Scenario 3: Negative Index Return of -4% is within the Buffer. Due to the 10% Buffer, you are protected from loss and your percentage of Index Interest is 0%. | Scenario 4: Negative Index Return of -12% exceeds the Buffer. The Buffer protects you from the first -10% of loss, so your percentage of Index Interest is -2%. | ||||||||
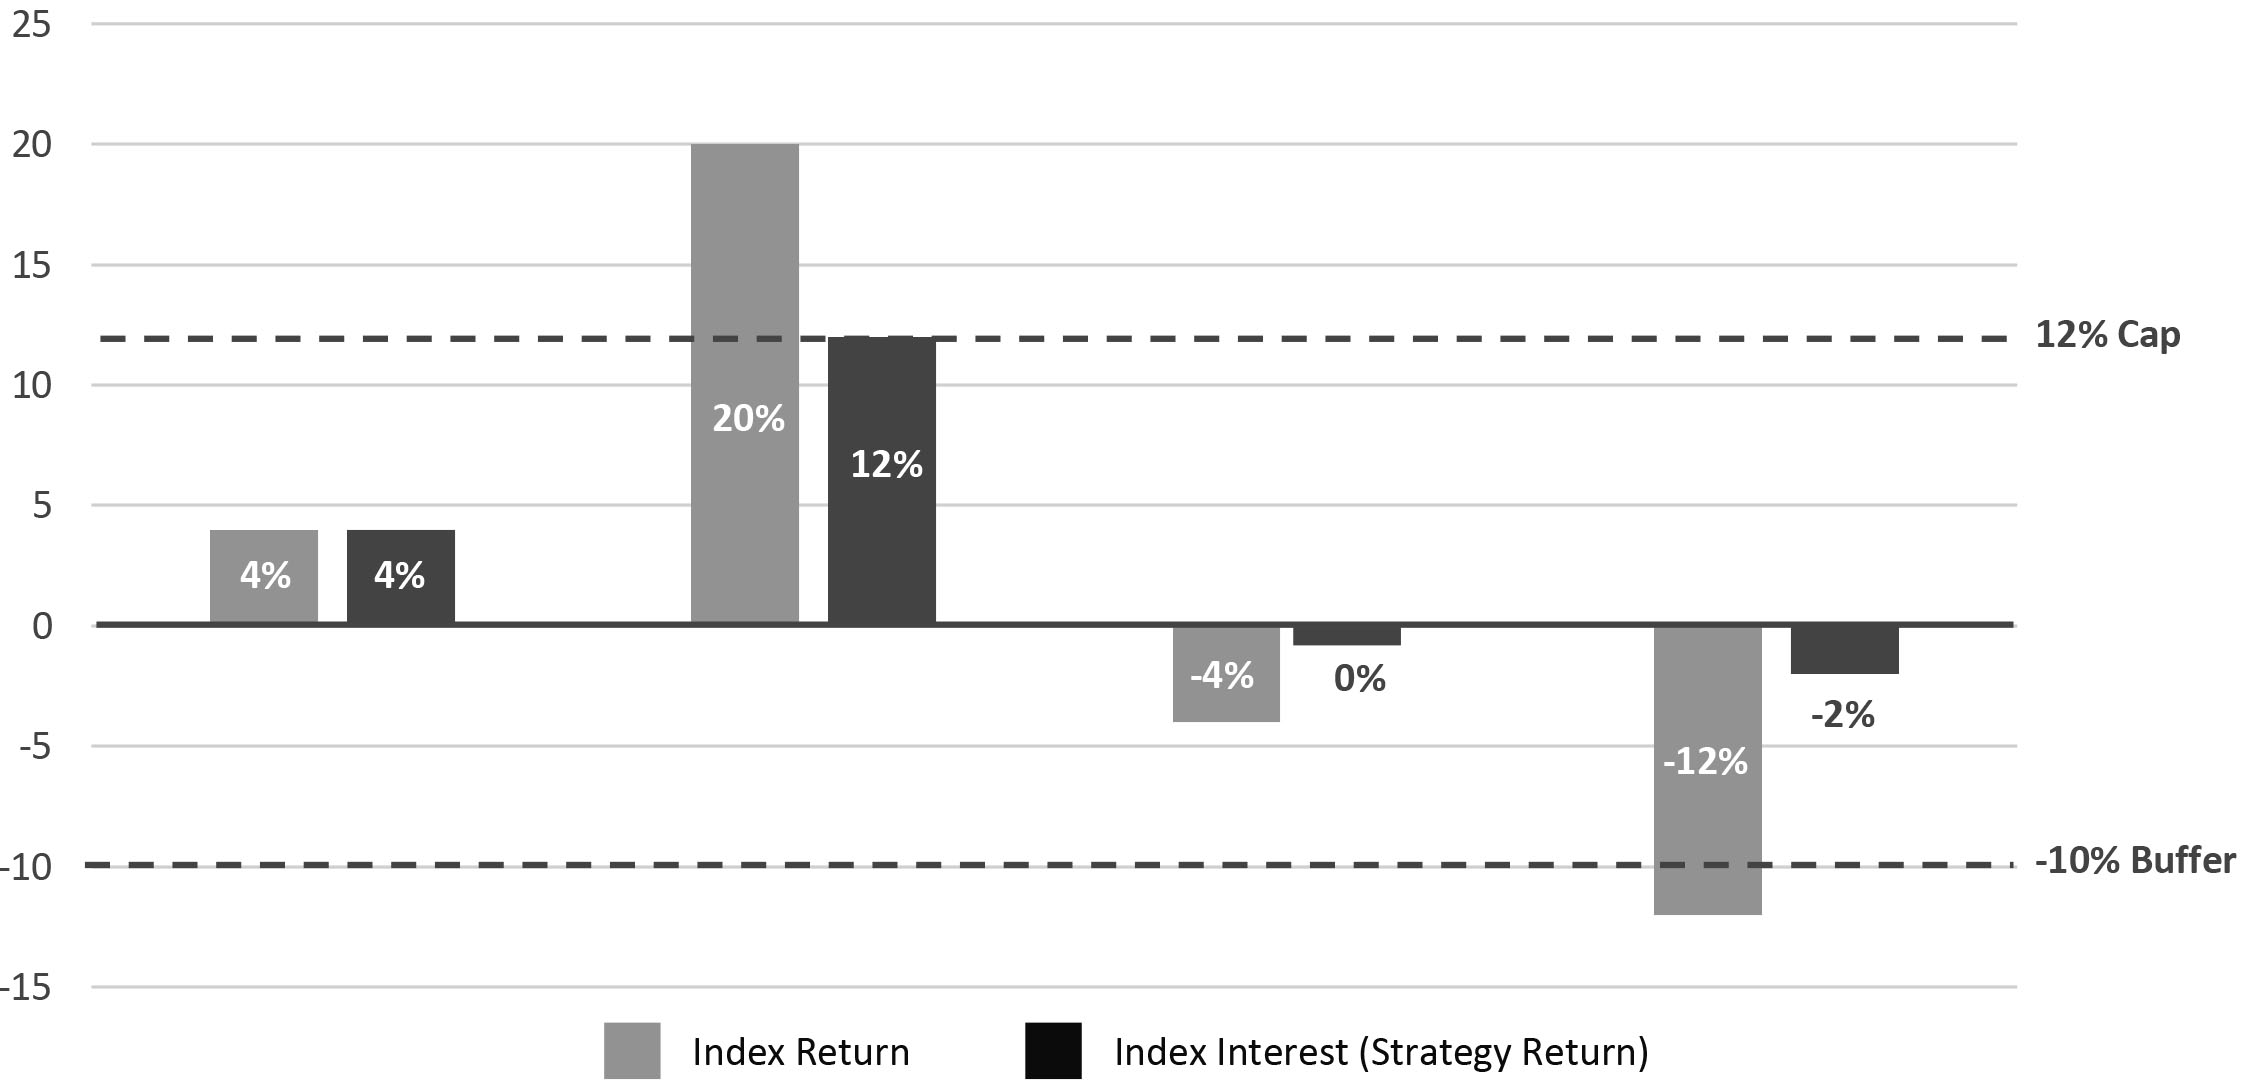 | |||||||||||
In the preceding hypothetical example the strategy's upside potential equals 100% of the Index Return up to an assumed Index Growth Cap of 12%. Partial downside protection is provided through the Buffer where index losses within the Buffer are protected. Index losses that exceed the Buffer will result in a loss of value to the Contract Fund.
The Cap and Participation Rate apply to a Segment for the duration of the Segment. We will declare new rates for each subsequent Segment.
12
Subsequent Caps may be higher or lower than previously declared Caps but will never be less than the guaranteed minimum Index Growth Cap. Subsequent Caps may differ from the Caps used for new contracts or for other contracts issued at different times. We will determine new Caps on a basis that does not discriminate unfairly within any class of contracts. The guaranteed minimum Index Growth Cap for the 10% Buffer option equals 5% for a one-year Segment. The guaranteed minimum Index Growth Cap for the 15% Buffer option equals 4% for a one-year Segment.
The Participation Rate applicable for any future Index Strategy Segment may change at our discretion. The Participation Rate for each Segment will not be lower than the guaranteed minimum Participation Rate. The guaranteed minimum Participation Rate for both the 10% Buffer option and 15% Buffer option is 100%.
Hypothetical Example: how the Capped With Buffer Index Strategy works in negative Index Return scenarios
Partial downside protection is provided through the Buffer where Index losses within the Buffer are protected. Index losses that exceed the Buffer will result in a loss of value to the Contract Fund. The following hypothetical example demonstrates how the Buffer functions in scenarios where the Index Return is negative at Segment maturity.
| Scenario 3: Negative Return Within Buffer | Scenario 4: Negative Return Exceeds Buffer | |||||||
| Index Strategy option | 1 Year Cap Rate With 10% Buffer | 1 Year Cap Rate With 10% Buffer | ||||||
| Index Value at Segment Start Date | 1,569 | 1,506 | ||||||
| Index Value at Segment End Date | 1,506 | 1,325 | ||||||
| Index Return | -4% ((1506-1569)/1569) | -12% ((1325-1506)/1506) | ||||||
| Buffer | 10% | 10% | ||||||
| Percentage of Index Interest | 0% | -2% | ||||||
| Index Strategy Segment Base | $100,000 | $100,000 | ||||||
| Index Strategy Segment Base Upon Segment Maturity† | $100,000 | $98,000 ($100,000-$2,000) | ||||||
| Explanation on how the Buffer was applied | Because the Buffer protects against the first 10% of the loss, no negative Index Interest is applied to the Index Strategy Segments. | Because the Buffer provides protection from the first 10% of the loss, the Index Strategy Segment only experiences a 2% loss (-12% Index Return + 10% Buffer = -2%). -2% * $100,000 (Index Strategy Base Upon Segment Maturity) = -$2,000 (Index Interest). | ||||||
†In this example Contract charges did not come from Index Strategies. Segment values will be reduced when value needs to be deducted from a Segment to cover charges and expenses. Also assumes no loans or withdrawals. | ||||||||
13
Scenario 3: Negative Index Return of -4% is within the Buffer. Due to the 10% Buffer, you are protected from loss and your percentage of Index Interest is 0%. | Scenario 4: Negative Index Return of -12% exceeds the Buffer. The Buffer protects you from the first -10% of loss, so your Index Interest is -2%. | ||||
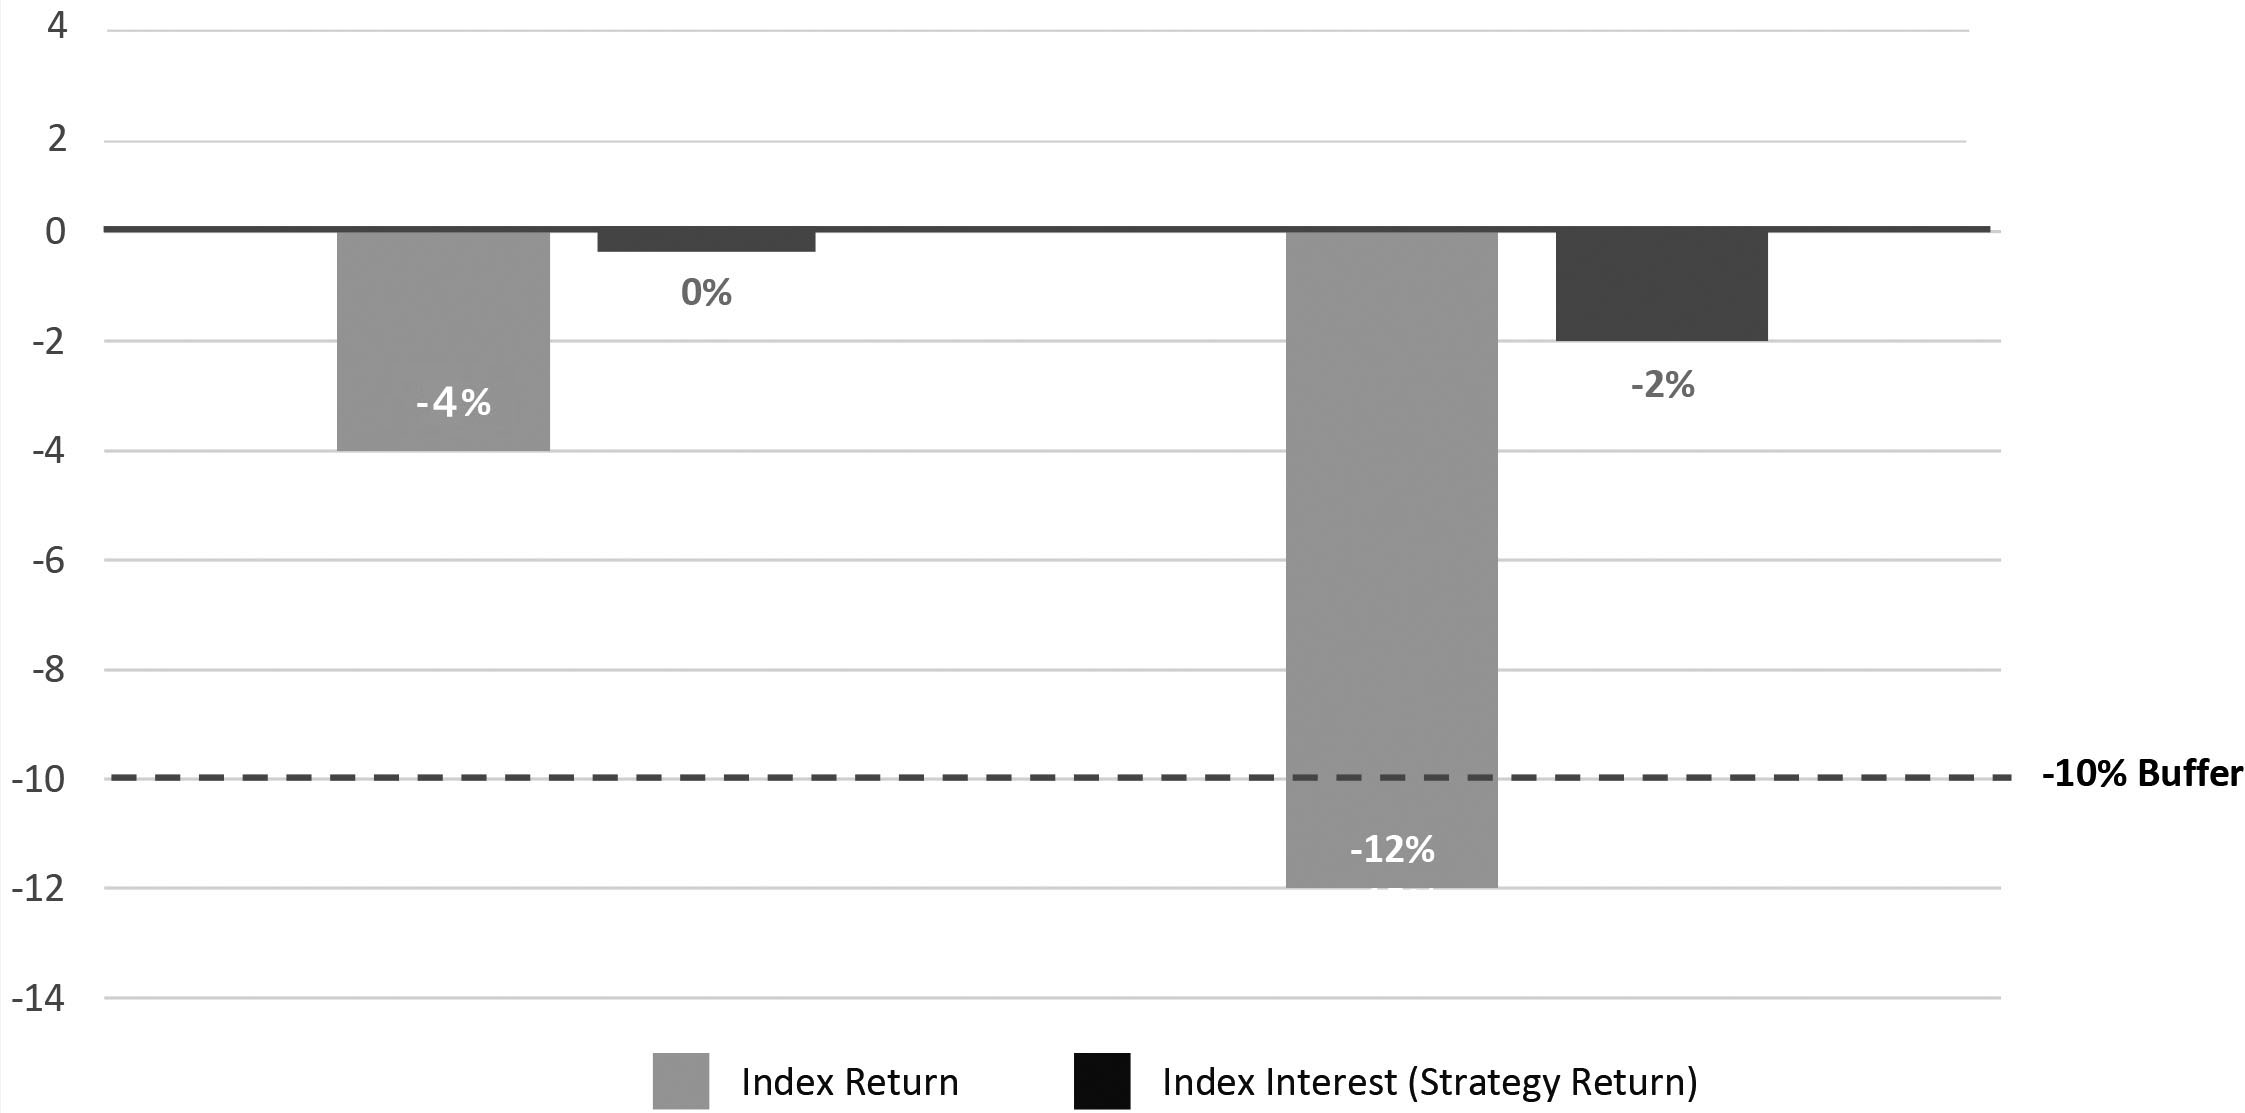 | |||||
Enhanced Cap Rate With Spread And Buffer Index Strategy
■1 Year S&P 500® Enhanced Cap Rate 10% Buffer option
■1 Year S&P 500® Enhanced Cap Rate 15% Buffer option
The Enhanced Cap Rate With Spread And Buffer Index Strategy offers potential for higher Index Interest through a higher Cap Rate in exchange for a Spread, which reduces a percentage of the positive Index Return. This strategy also provides a level of downside protection through a Buffer.
The Index Growth Cap (“Cap”) is the maximum rate that may be credited to an Enhanced Cap Rate With Spread And Buffer Index Strategy Segment at maturity. A different Cap may be declared for different Segments. The Cap may vary by Buffer option. The Enhanced Cap Rate With Spread And Buffer Index Strategy is available in 1-year Segments.
The Spread is a percentage that reduces positive Index Return. On the Index Strategy Segment maturity date, the Spread reduces the percentage of positive Index Returns used in the calculation of Index Interest that may be applied. The Spread may vary by Buffer option.
The Buffer is the percentage of protected negative Index Return applied to amounts allocated to a Segment on the maturity date. Any negative Index Return in excess of the Buffer reduces the maturity value of the Contract Fund allocated to the Segment. This Index Strategy provides an option with a 10% Buffer and a 15% Buffer.
A higher Cap does not guarantee you will receive a higher amount of Index Interest, because interest crediting for the Enhanced Cap Rate With Spread and Buffer Index Strategy depends on the applicable Cap, Spread and Index Return. There is no guarantee that the Enhanced Cap Rate With Spread and Buffer Index Strategy will outperform any other available Index Strategy and may underperform available Index Strategies due to the application of the Spread.
If the Index Return multiplied by the Participation Rate is positive and greater than or equal to the Cap plus the Spread, the percentage of Index Interest is equal to the Cap.
If the Index Return multiplied by the Participation Rate (“the result”) is positive and greater than the Spread, but less than the Cap Rate plus the Spread, the percentage of Index Interest is equal to the result minus the Spread.
If the Index Return multiplied by the Participation Rate is greater than or equal to zero, and less than or equal to the Spread, the percentage of Index Interest is 0%.
The Spread and Participation Rate do not apply when Index Return is zero or negative.
If the Index Return is negative, but less than or equal to the Buffer, the percentage of Index Interest is 0%. Otherwise, the percentage of Index Interest is equal to the negative Index Return in excess of the Buffer.
14
Hypothetical Example: how the Enhanced Cap Rate With Spread And Buffer Index Strategy works in positive Index Return scenarios
| Assumptions: Cap (30%); Spread (2%); Buffer (10%); Participation Rate (100%). | ||||||||
Scenario 1: The Index Return is 35%, which is greater than the Cap plus Spread, the Index Interest is 30% which is equal to the cap. | Scenario 2: The Index Return is 15%, which is less than the Cap plus Spread, the Index Interest would be 13%, which is equal to the Index Return minus the Spread. | Scenario 3: The Index Return is 1%, an amount greater than zero, but less than the Spread, the Index Interest would be 0%. | ||||||
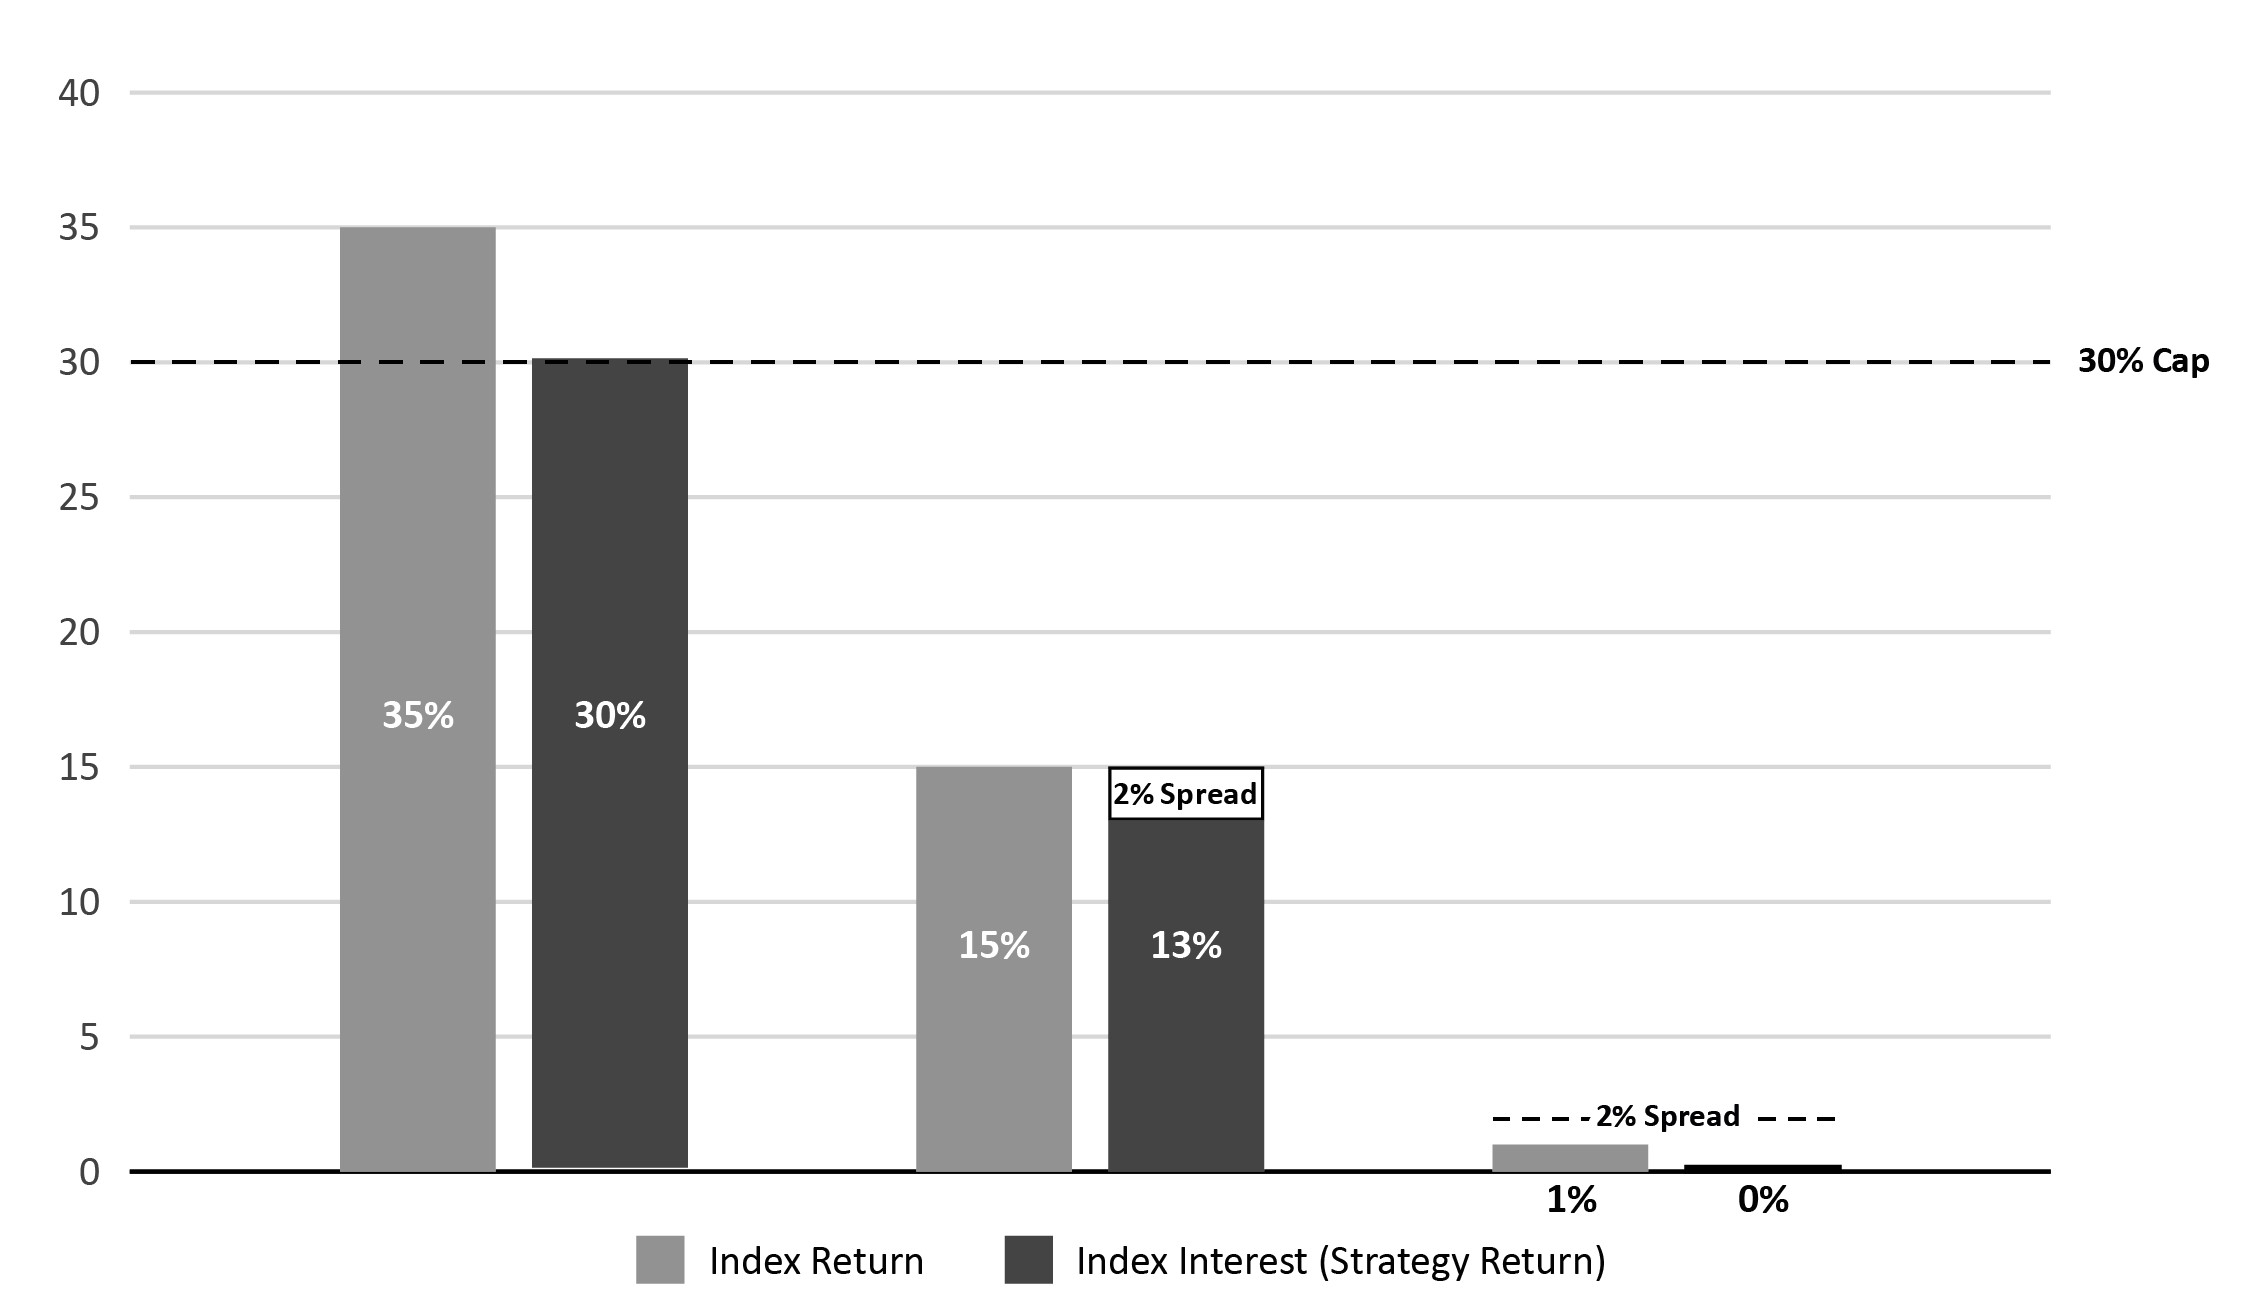 | ||||||||
Hypothetical Example: how the Enhanced Cap Rate With Spread And Buffer Index Strategy works in negative Index Return scenarios
Index losses that exceed the Buffer will result in a loss of value to the Contract Fund. The following hypothetical example demonstrates how the Buffer functions in scenarios where the Index Return is negative and exceeds the Buffer at Segment maturity.
Scenario 4: Negative Return Within Buffer | Scenario 5: Negative Return Exceeds Buffer | |||||||
Index Strategy option | 1 Year Enhanced Cap Rate With 10% Buffer | 1 Year Enhanced Cap Rate With 10% Buffer | ||||||
| Index Value at Segment Start Date | 1569 | 1506 | ||||||
| Index Value at Segment End Date | 1491 | 1280 | ||||||
| Index Return | -5% ((1491-1569)/1569) | -15% ((1280-1506)/1506) | ||||||
| Buffer | 10% | 10% | ||||||
| Percentage of Index Interest | 0% | -5% | ||||||
| Index Strategy Segment Base | $100,000 | $100,000 | ||||||
Index Strategy Segment Base Upon Segment Maturity† | $100,000 | $95,000 ($100,000 - $5,000) | ||||||
15
Explanation on how the Buffer was applied | Because the Buffer protects against the first 10% of the loss, no negative Index Interest is applied to the Index Strategy Segments. | Because the Buffer provides protection from the first 10% of the loss, the Index Strategy Segment only experiences a 5% loss (-15% Index Return + 10% Buffer = -5%). -5% * $100,000 (Index Strategy Base Upon Segment Maturity) = -$5,000 (Index Interest). | ||||||
†In this example Contract charges did not come from Index Strategies. Segment values will be reduced when value needs to be deducted from a Segment to cover charges and expenses. Also assumes no loans or withdrawals. | ||||||||
| Assumptions: Cap (30%); Spread (2%); Buffer (10%); Participation Rate (100%). | |||||
Scenario 4: The Index Return is -5%, an amount within the Buffer, the Index Interest would be 0%. | Scenario 5: The Index Return is -15%, an amount that exceeds the Buffer, the Index Interest would be -5%. | ||||
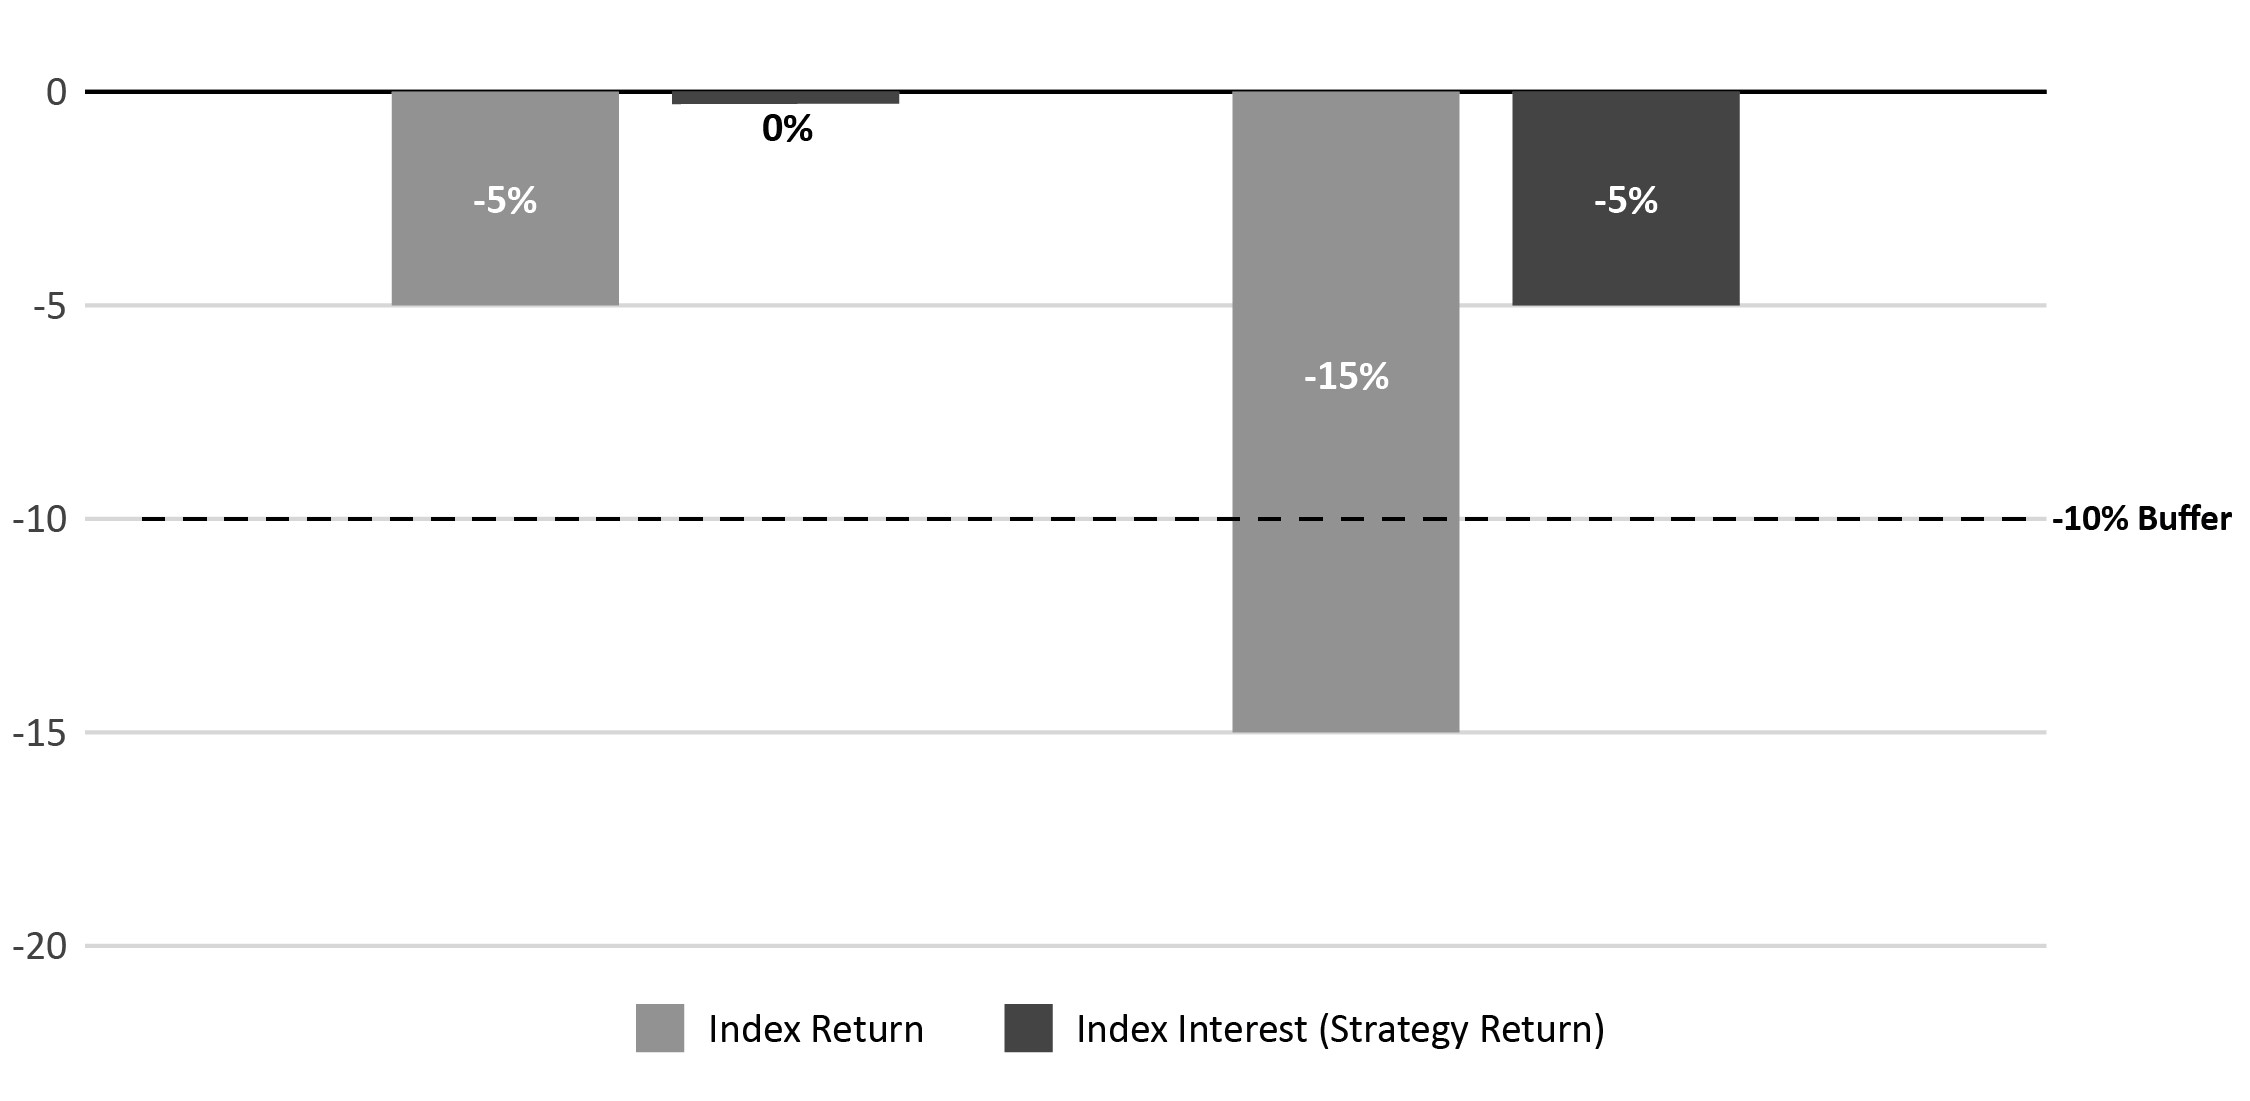 | |||||
In the preceding hypothetical examples the strategy's upside potential equals 100% of the Index Return up to an assumed Index Growth Cap of 30%, minus the Spread of 2%. Partial downside protection is provided by the Buffer where index losses within the Buffer are protected. Index losses that exceed the Buffer will result in a loss of value to the Contract Fund.
The Cap, Participation Rate, Spread and Buffer apply to a Segment for the duration of the Segment. We will declare new rates for each subsequent Segment.
Subsequent Caps and/or Spreads may be higher or lower than the initial Cap and/or Spread but will never be less than the guaranteed minimum Index Growth Cap or greater than the guaranteed maximum Spread. Subsequent Caps and/or Spreads may differ from the Cap and/or Spreads used for new contracts or for other contracts issued at different times. We will determine new Caps and Spreads on a basis that does not discriminate unfairly within any class of contracts. The guaranteed minimum Index Growth Cap varies by Buffer option. The Guaranteed Minimum Index Growth Cap for the 10% Buffer option equals 5% for a one-year Segment. The Guaranteed Minimum Index Growth Cap for the 15% Buffer option equals 4% for a one-year Segment. The guaranteed maximum Spread for both the 10% and 15% Buffer options, for a one-year segment, equals 2%.
The Participation Rate applicable for any future Index Strategy Segment may change at our discretion. The Participation Rate for each Segment will not be lower than the guaranteed minimum Participation Rate. The guaranteed minimum Participation Rate for both the 10% Buffer option and 15% Buffer option is 100%.
Step Rate Plus With Buffer Index Strategy
■1 year S&P 500® Step Rate Plus 10% Buffer option
The Step Rate Plus With Buffer Index Strategy offers upside potential for higher Index Interest that is not limited by an Index Growth Cap (“Cap”), in exchange for a lower Participation Rate, which is used to limit Index Interest. This Strategy also offers a level of downside protection through a Buffer.
When the Index Return is zero or positive, the Step Rate is the minimum percentage of Index Interest that would be applied at maturity. The Participation Rate used in the Step Rate Plus with Buffer Index Strategy is the percentage of an Index Return that may be credited if the Index Return multiplied by the Participation Rate exceeds the Step Rate at maturity. A Participation Rate only
16
applies when the Index Return is positive and the application of the Participation Rate results in a percentage of an Index Return that is greater than the Step Rate. The Step Rate Plus with Buffer Index Strategy is available in 1-year Segments.
The Buffer is the level of protection from negative Index Return applied to a Segment on the maturity date. Any negative Index Return in excess of the Buffer reduces the maturity value of the Contract Fund allocated to the Segment. This Index Strategy provides a 10% Buffer.
If the Index Return is zero or positive, the percentage of Index Interest is equal to the greater of (a) the Index Return multiplied by the Participation Rate and (b) the Step Rate. If the Index Return is negative, but less than or equal to the Buffer, the percentage of Index Interest is 0%. Otherwise, the Index Interest is equal to the negative Index Return in excess of the Buffer. The Participation Rate does not apply when the Index Return is negative.
Hypothetical Example: how the Step Rate Plus With Buffer Index Strategy works in positive Index Return scenarios
Upside potential – When the Index Return multiplied by the Participation Rate is zero or positive the Index Interest will be the greater of the Step Rate or the Index Return multiplied by the Participation Rate. Assumptions: Step Rate (6%); Buffer (10%); Participation Rate (90%). | ||||||||
Scenario 1: The Index Return is 4%. Your percentage of Index Interest is the greater of the 6% Step Rate or 90% participation in the 4% Index Return, which is 3.6%. Your Index Interest is 6%. | Scenario 2: The Index Return is 20%. Your percentage of Index Interest is the greater of the 6% Step Rate or 90% participation in the 20% Index Return, which is 18%. Your Index Interest is 18%. | Scenario 3: The Index Return is 6.5%. Your percentage of Index Interest is the greater of the 6% Step Rate or 90% participation in the 6.5% Index Return, which is 5.85%. Your Index Interest is 6%. | ||||||
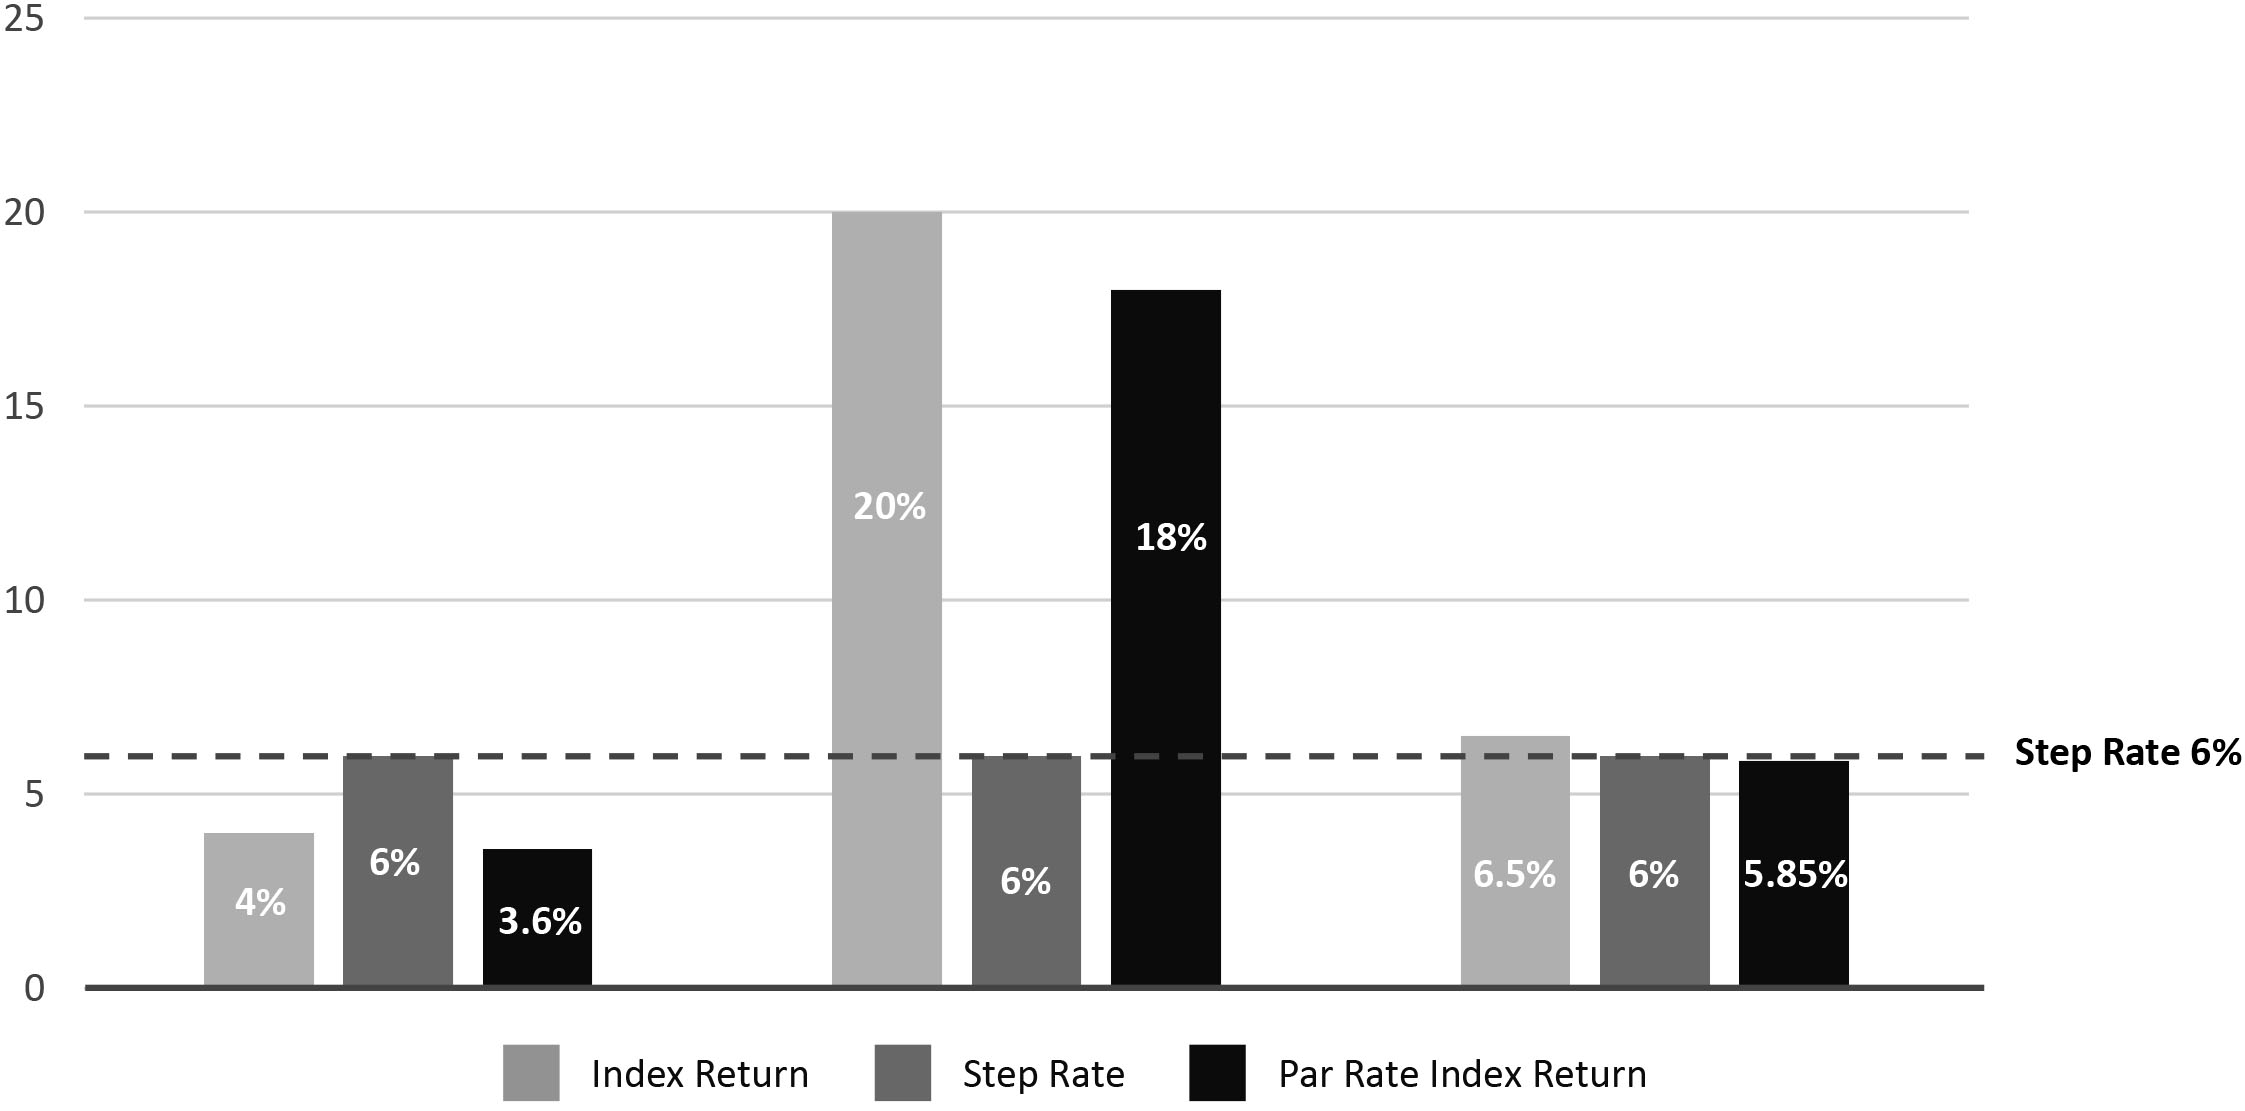 | ||||||||
Hypothetical Example: how the Step Rate Plus With Buffer Index Strategy works in negative Index Return scenarios
Partial downside protection is provided through the Buffer where Index losses within the Buffer are protected. Index losses that exceed the Buffer will result in a loss of value to the Contract Fund. The following hypothetical example demonstrates how the Buffer functions in scenarios where the Index Return is negative at Segment maturity.
17
| Scenario 4: Negative Return Within Buffer | Scenario 5: Negative Return Exceeds Buffer | |||||||
| Index Strategy option | 1 Year Step Rate With 10% Buffer | 1 Year Step Rate With 10% Buffer | ||||||
| Index Value at Segment Start Date | 1,569 | 1,506 | ||||||
| Index Value at Segment End Date | 1,506.00 | 1,249.00 | ||||||
| Index Return | -4% ((1506-1569)/1569) | -17% ((1249-1506)/1506) | ||||||
| Buffer | 10% | 10% | ||||||
| Percentage of Index Interest | 0% | -7% | ||||||
| Index Strategy Segment Base | $100,000 | $100,000 | ||||||
| Index Strategy Segment Base Upon Segment Maturity† | $100,000 | $93,000 ($100,000-$7,000) | ||||||
| Explanation on how the Buffer was applied | Because the Buffer protects against the first 10% of the loss, no negative Index Interest is applied to the Index Strategy Segments. | Because the Buffer provides protection from the first 10% of the loss, the Index Strategy Segment only experiences a 7% loss (-17% Index Return + 10% Buffer = -7%). -7% * $100,000 (Index Strategy Base Upon Segment Maturity) = -$7,000 (Index Interest) | ||||||
| †In this example Contract charges did not come from Index Strategies. Segment values will be reduced when value needs to be deducted from a Segment to cover charges and expenses. Also assumes no loans or withdrawals. | ||||||||
| Assumptions: Step Rate (6%); Buffer (10%); Participation Rate (90%). | |||||
Scenario 4: Negative Index Return of -4% is within the Buffer. Due to the 10% Buffer, you are protected from loss and your percentage of Index Interest is 0%. | Scenario 5: Negative Index Return of -17% exceeds the Buffer. The Buffer protects you from the first -10% of loss, so your percentage of Index Interest is -7%. | ||||
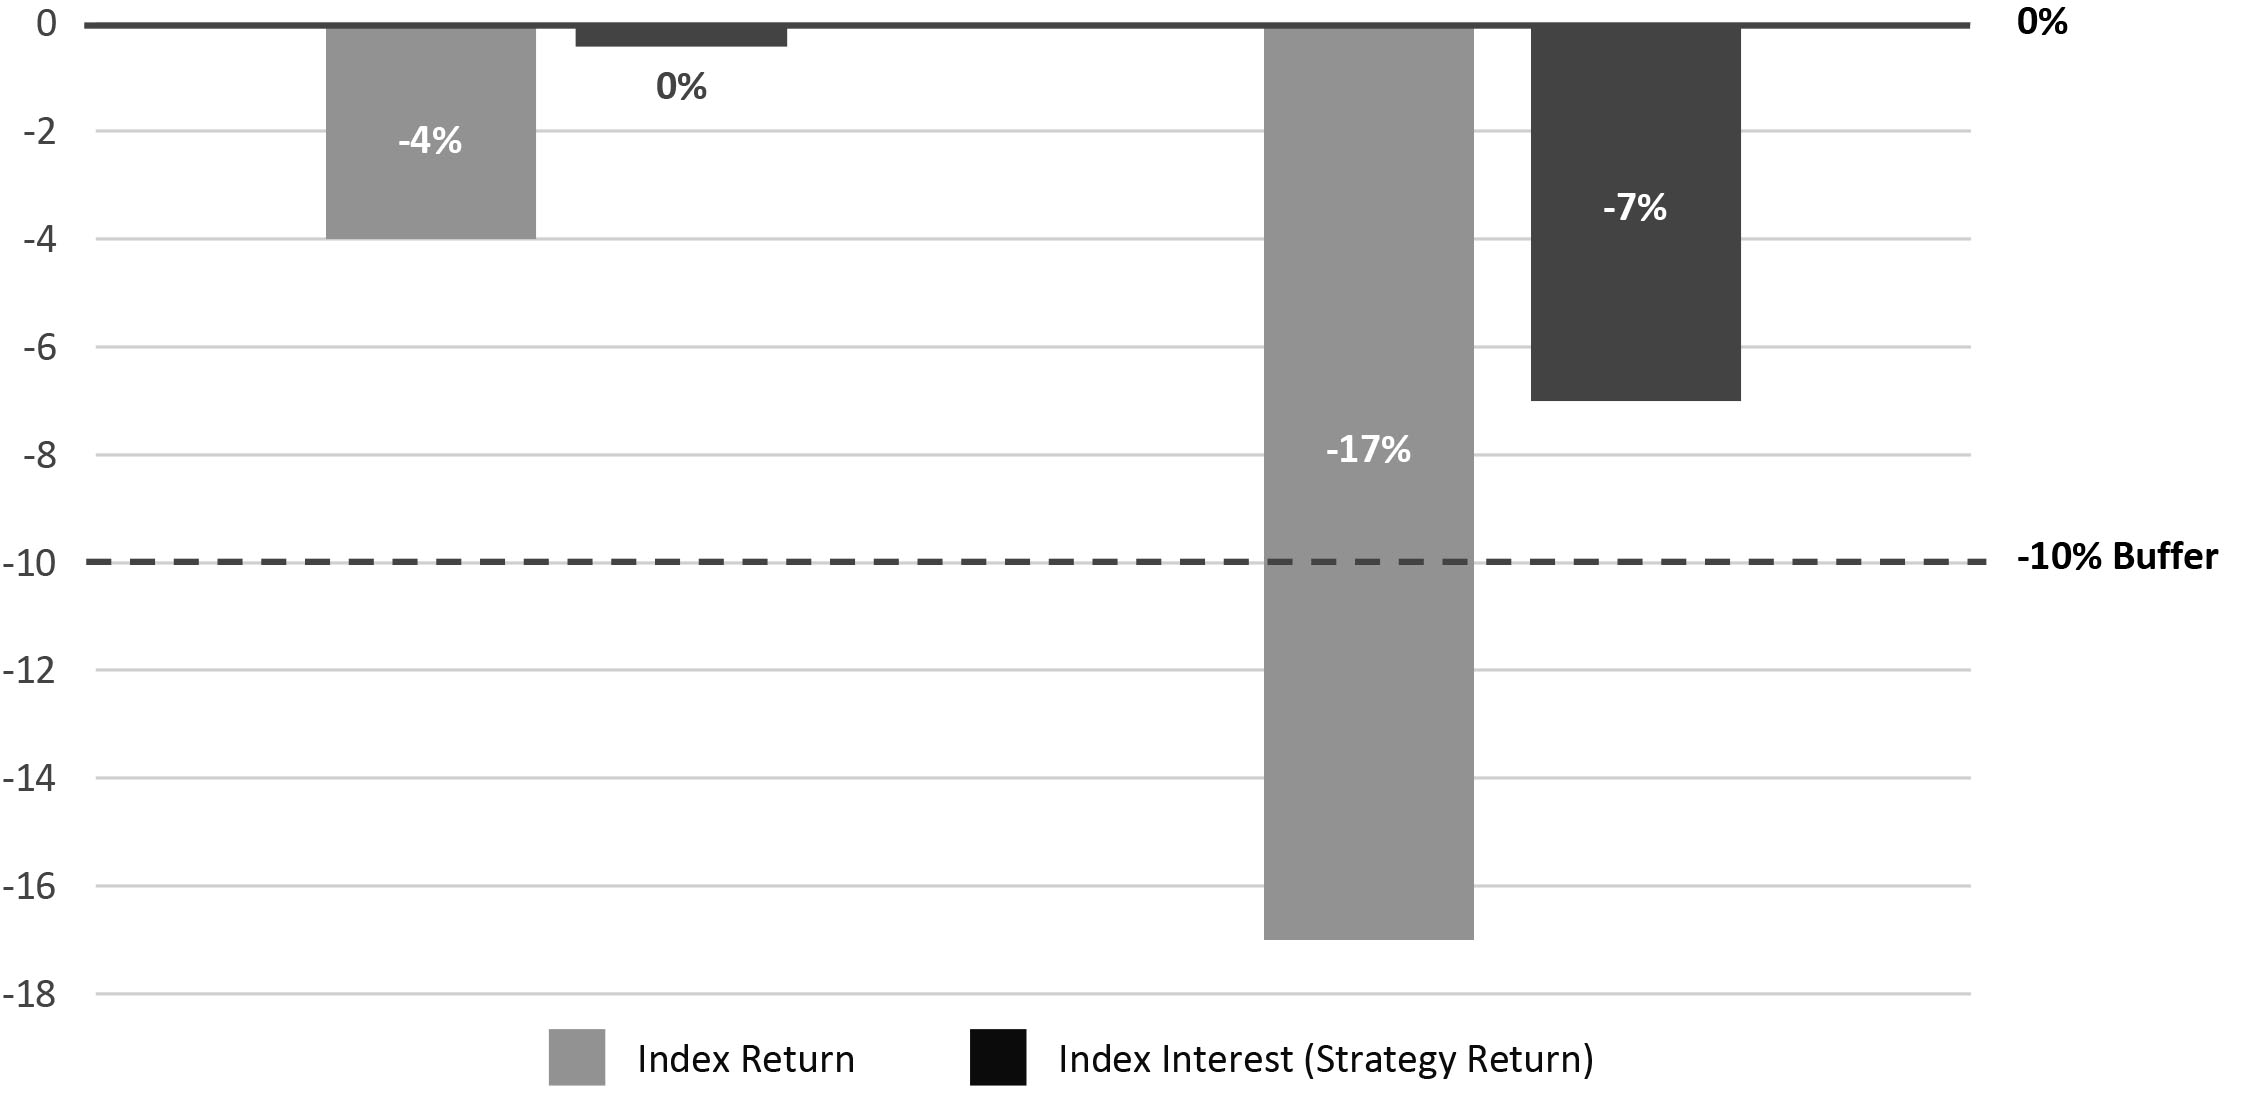 | |||||
There is no maximum amount of Index Interest with the Step Rate Plus with Buffer Index Strategy, although the Index Interest will be limited by the Participation Rate. The Step Rate and Participation Rate apply to a Segment for the duration of the Segment. We will declare a new Step Rate and Participation Rate for each subsequent Segment.
Subsequent Step Rates and Participation Rates may be higher or lower than previously declared Step Rates and Participation Rates, but will never be less than the guaranteed minimum Step Rate and guaranteed minimum Participation Rate. The guaranteed minimum Step Rate equals 1%. The guaranteed minimum Participation Rate is 60%. Subsequent Step Rates and Participation Rates may differ from the Step Rates and Participation Rates used for new Contracts or for other Contracts issued at different times. We will determine new Step Rates and Participation Rates on a basis that does not discriminate unfairly within any class of Contracts.
18
Dual Directional With Buffer Index Strategy
■1 year S&P 500® Dual Directional 10% Buffer option
■1 Year S&P 500® Dual Directional 15% Buffer option
The Dual Directional with Buffer Index Strategy offers potential for Index Interest up to an Index Growth Cap (“Cap”) when Index Returns are positive, and offers potential for positive Index Interest even when Index Returns are negative, as long as the negative Index Return is equal to or within the Buffer.
The Index Growth Cap (“Cap”) is the maximum rate that may be credited to a Dual Directional with Buffer Index Strategy Segment at maturity when the Index Return is positive. A different Cap may be declared for different Segments. The Cap Rate may vary by the Buffer option. The Dual Directional With Buffer Index Strategy is available in 1-year segments.
The Buffer is the percentage of protected negative Index Return applied to amounts allocated to a Segment on the maturity date. Any negative Index Return in excess of the Buffer reduces the maturity value of the Contract Fund allocated to the Segment. This Index Strategy provides options with a 10% Buffer and a 15% Buffer.
The Dual Directional with Buffer Index Strategy provides (i) a percentage of Index Interest equal to the Index Return up to a Cap Rate when the Index Return is positive and (ii) a percentage of Index Interest equal to the absolute value of the Index Return, not limited by a Cap Rate, when the Index Return is negative and equal to or within the Buffer. The absolute value of the Index Return is the value without regard to the mathematical sign (positive or negative) of the Index Return.
If the Index Return multiplied by the Participation Rate is positive and equal to or greater than the Cap, then the percentage of Index Interest is equal to the Cap.
If the Index Return multiplied by the Participation Rate is zero or positive, but less than the Cap Rate, the percentage of Index Interest is equal to the Index Return.
If the Index Return is negative, but less than or equal to the Buffer:
•The percentage of Index Interest will be the absolute value (without regard to the mathematical sign (positive or negative)) of the Index Return. This means a positive percentage of Index Interest can be applied to your Contract even when the Index Return is negative.
•Index Interest is not limited by the Cap Rate. The percentage of Index Interest will be greater than the Cap Rate when the Buffer level is greater than the Cap Rate, and the absolute value of the Index Return exceeds the Cap Rate.
If the Index Return negative and is greater than the Buffer:
•The percentage of Index Interest is equal to the negative Index Return in excess of the Buffer.
•Any negative Index Return in excess of the Buffer reduces the maturity value of the Contract Fund allocated to the Segment.
•The Participation Rate does not apply when the Index Return is negative.
19
Hypothetical Example: how the Dual Directional With Buffer Index Strategy works in positive Index Return scenarios
| Assumptions: Cap Rate (12%); Buffer (10%); Participation Rate (100%). | ||||||||||||||
Scenario 1: The Index Return is 5%, which is less than the Cap Rate. Your Index Interest is 5%. | Scenario 2: The Index Return is 15%, which is greater than the Cap Rate, the Index Interest would be 12%, which is equal to the Cap Rate. | |||||||||||||
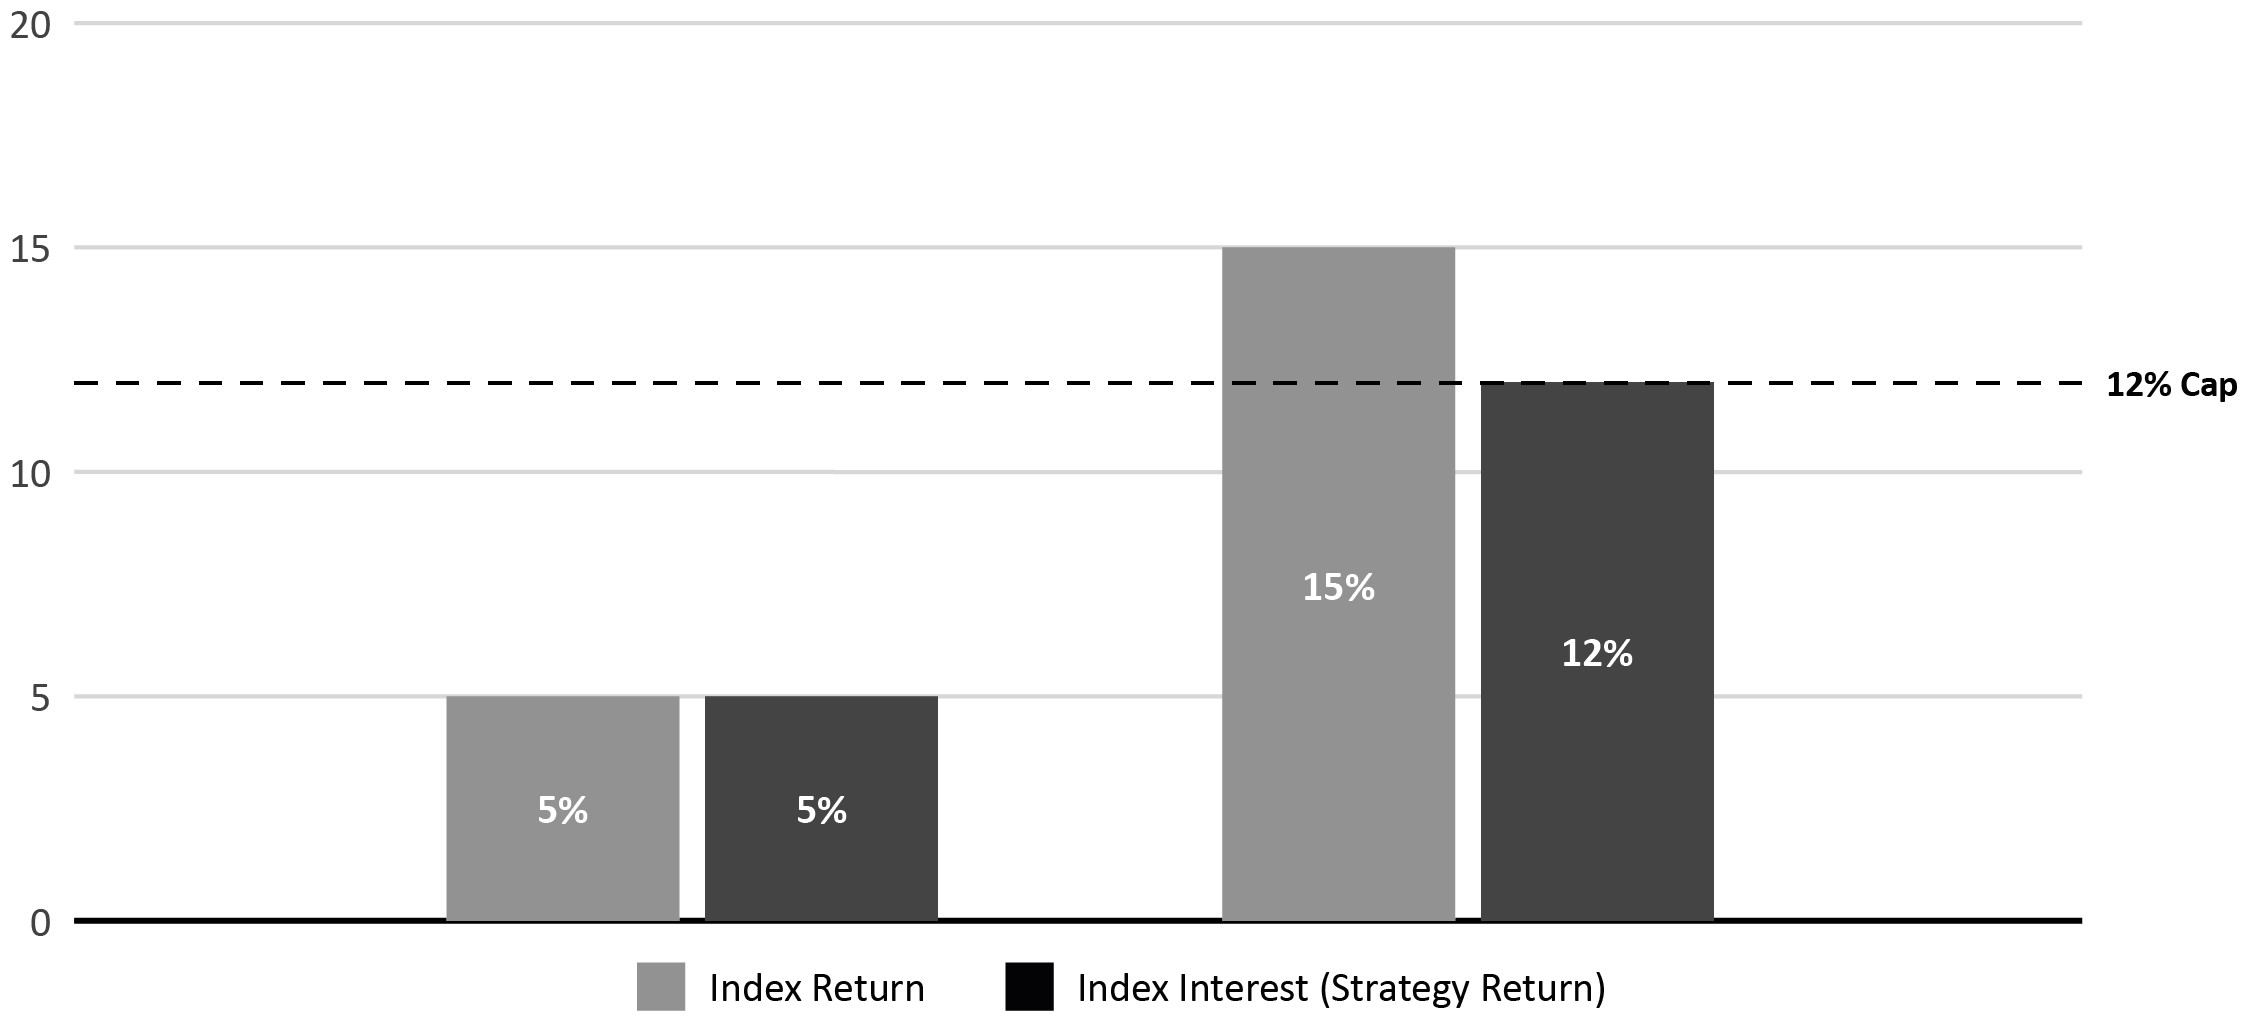 | ||||||||||||||
Hypothetical Example: how the Dual Directional With Buffer Index Strategy works in negative Index Return scenarios
Index losses that exceed the Buffer will result in a loss of value to the Contract Fund. The following hypothetical example demonstrates how the Buffer functions in scenarios where the Index Return is negative and exceeds the Buffer at Segment maturity.
| Scenario 3: Negative Return Within Buffer | Scenario 4: Negative Return Equal to Buffer | Scenario 5: Negative Return Exceeds Buffer | |||||||||
Index Strategy option | 1 Year Dual Directional With 10% Buffer | 1 Year Dual Directional With 10% Buffer | 1 Year Dual Directional With 10% Buffer | ||||||||
| Index Value at Segment Start Date | 1569 | 1673 | 1506 | ||||||||
| Index Value at Segment End Date | 1443 | 1506 | 1280 | ||||||||
| Index Return | -8% ((1443-1569)/1569) | -10% ((1506-1673)/1673) | -15% ((1280-1506)/1506) | ||||||||
| Buffer | 10% | 10% | 10% | ||||||||
| Percentage of Index Interest | 8% | 10% | -5% | ||||||||
| Index Strategy Segment Base | $100,000 | $100,000 | $100,000 | ||||||||
Index Strategy Segment Base Upon Segment Maturity† | $108,000 ($100,000 + $8,000) | $110,000 ($100,000 + $10,000) | $95,000 ($100,000 - $5,000) | ||||||||
Explanation on how the Buffer was applied | The Buffer reverses the first 10% of the loss, so positive Index Interest is applied to the Index Strategy Segment | The Buffer reverses the first 10% of the loss, so positive Index Interest is applied to the Index Strategy Segment even if the Cap Rate is a lower amount (e.g. 6%) | Because the Buffer provides protection from the first 10% of the loss, the Index Strategy Segment only experiences a 5% loss (-15% Index Return + 10% Buffer = -5%). -5% * $100,000 (Index Strategy Base Upon Segment Maturity) = -$5,000 (Index Interest). | ||||||||
†In this example Contract charges did not come from Index Strategies. Segment values will be reduced when value needs to be deducted from a Segment to cover charges and expenses. Also assumes no loans or withdrawals. | |||||||||||
20
Assumptions: Cap Rate (12%); Buffer (10%); Participation Rate (100%). | ||||||||
Scenario 3: The Index Return is -8%, an amount within the Buffer, the Index Interest would be 8%. | Scenario 4: The Index Return is -10%, an amount equal to the Buffer, the Index Interest would be 10%. | Scenario 5: The Index Return is -15%, an amount that exceeds the Buffer, the Index Interest would be -5% | ||||||
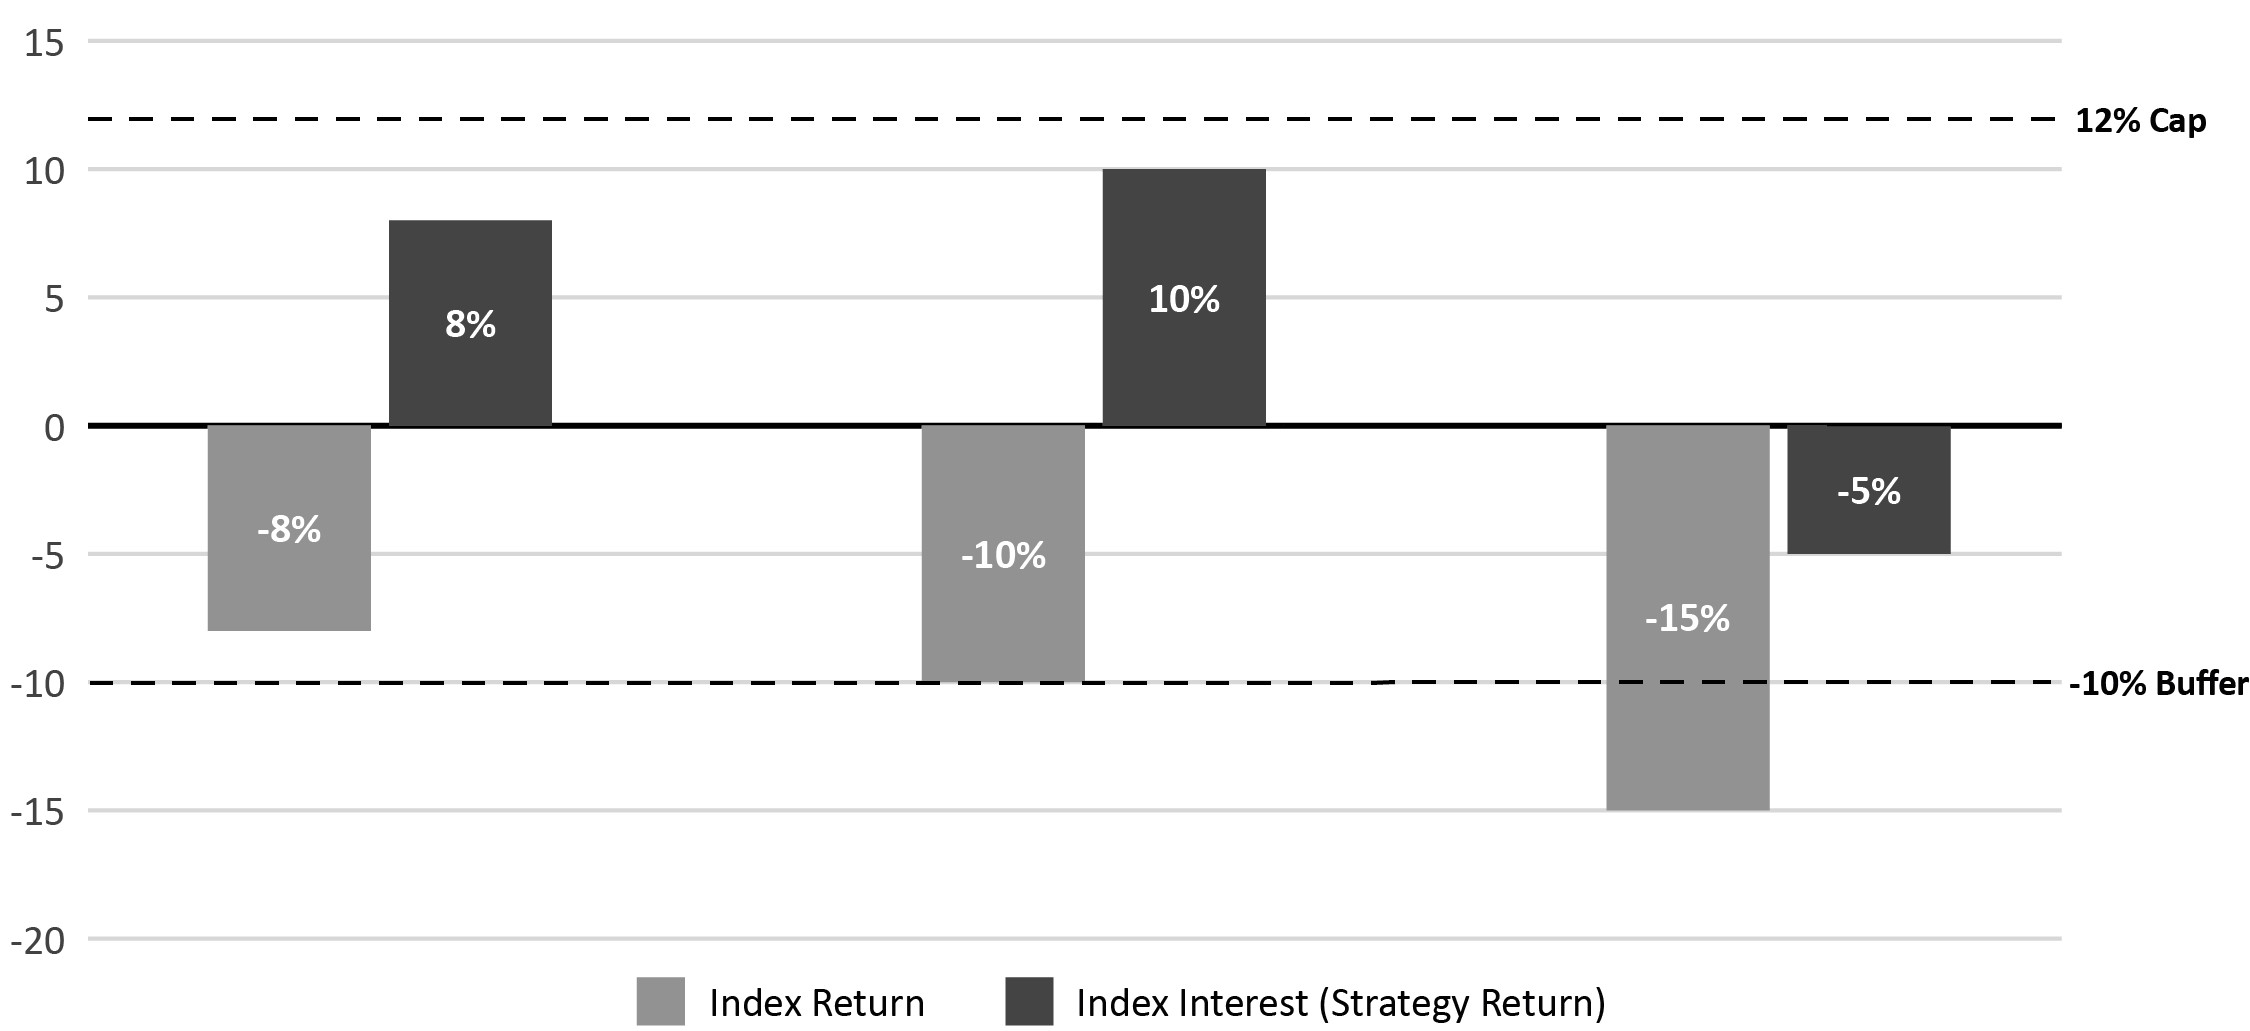 | ||||||||
In the preceding hypothetical examples, the strategy's upside potential equals 100% of the Index Return up to an assumed Index Growth Cap of 12%. Index losses equal to or less than the 10% Buffer result in positive Index Interest. Index losses that exceed the Buffer will result in a loss of value to the Contract Fund.
The Cap and Participation Rate apply to a Segment for the duration of the Segment. We will declare new rates for each subsequent Segment.
Subsequent Cap Rates may be higher or lower than the initial Cap Rate but will never be less than the Guaranteed Minimum Cap Rate. Subsequent Cap Rates may differ from the Cap Rates used for new contracts or for other contracts issued at different times. We will determine new Cap Rates on a basis that does not discriminate unfairly within any class of contracts. The guaranteed minimum Index Growth Cap for both the 10% Buffer Level and 15% Buffer options equals 1% for a one-year segment.
The Participation Rate applicable for any future Index Strategy Segment may change at our discretion. The Participation Rate for each Segment will not be lower than the guaranteed minimum Participation Rate. The guaranteed minimum Participation Rate for both the 10% Buffer option and 15% Buffer option is 100%.
Valuing Your Investment And Interim Value Of Index Strategy Segments
Processing and Valuing Transactions – Pruco Life is generally open to process financial transactions on those days that the New York Stock Exchange (NYSE) is open for trading. There may be circumstances where the NYSE does not open on a regularly scheduled date or time or closes at an earlier time than scheduled (normally 4:00 p.m. Eastern Time). Generally, financial transactions received in Good Order before the close of regular trading on the NYSE will be processed according to the value next determined following the close of business. Financial transactions received on a non-business day or after the close of regular trading on the NYSE will be processed based on: (1) the value next computed on the next Valuation Day for Variable Investment Options, or (2) the value determined using the last published Index Value for Index Strategies.
We will not process any financial transactions involving purchase or redemption orders on days that the NYSE is closed. Pruco Life will also not process financial transactions involving purchase or redemption orders or transfers on any day that:
a.trading on the NYSE is restricted;
b.an emergency, as determined by the SEC, exists making redemption or valuation of securities held in the Separate Account impractical;
c.the SEC, by order, permits the suspension or postponement for the protection of security holders; or
d.the applicable Index Value is not published.
In certain circumstances, we may need to correct the processing of an order. In such circumstances, we may incur a loss or receive a gain depending upon the price of the security when the order was executed and the price of the security when the order is corrected. With respect to any gain that may result from such order correction, we will retain any such gain as additional compensation for these correction services. We will also bear any loss that may result from such order correction and your Contract values will not be negatively impacted.
21
Interim Value Of Index Strategies With a Buffer – On each Valuation Day during the year, other than Segment start date(s) and Segment maturity date(s), each Index Strategy with a Buffer is valued using an Interim Value. When we discuss Interim Value, it is only in relation to Index Strategies that offer a Buffer. Interim Value is not calculated for the Index Strategy(ies) with an Index Growth Floor. The Interim Value is used to calculate amounts available for withdrawal, loan, surrender, transfer, payment of a death claim, or payment of Contract fees and charges before the Segment maturity date. The Interim Value also is used to determine how much the Index Strategy Segment Base will be reduced after a deduction, transfer, charge, or withdrawal.
The Interim Value is also included in the value of the Contract Fund and Cash Surrender Value to reflect the amount in the applicable Segment prior to the maturity date. The Interim Value reflects the value of each Segment of an Index Strategy with a Buffer taking into account the current price of the underlying Index, the time remaining until the Segment maturity date, and the current value of the investments we have made to fund our obligations under the Index Strategy Segment. The Interim Value is an estimate of the current value of fixed income and derivative instruments we could purchase to assure our ability to meet our obligations to the Contract Owner at a Segment maturity date. We use a portfolio of fixed income instruments and derivatives to replicate our obligations to calculate Index Interest for the Index Strategy Segments. These derivatives are valued using the Black-Scholes Model. There are many external factors that may impact the Interim Value including changes in the Indices, changes in the interest rate environment, and volatility.
The Interim Value assesses the fair value of the assets allocated to an Index Strategy Segment (Index Strategy Segment Base) plus the current value of the portfolio of options utilized to replicate the performance of these Index Strategy Segments.
The Interim Value for the applicable Index Strategy Segment is equal to (1) + (2) where:
(1) is the fair value of the Index Strategy Segment Base on the Valuation Day the Interim Value is calculated.
(2) is the current value of replicating the portfolio of options on the Valuation Day the Interim Value is calculated.
1.The fair value of the Index Strategy Segment Base is meant to represent the market value of the investments supporting each Index Strategy Segment.
2.Current value of replicating the portfolio of options – We utilize a fair market value methodology to value replicating the portfolio of options that support this product.
For each Index Strategy Segment, we solely designate and value options, each of which is tied to the performance of the Index associated with the Index Strategy. We use derivatives to provide an estimate of the gain or loss on the Index Strategy Segment Base that could occur at the end of the Index Strategy Segment Duration. This estimate also reflects the impact of the Index Growth Cap, Participation Rate, Step Rate, Spread, and Buffer at the end of the Index Strategy Segment as well as the estimated cost of exiting the replicating options prior to the Index Strategy Segment maturity date. The valuation of the options is based on standard methods for valuing derivatives and based on inputs from third party vendors. The methodology used to value these options is determined solely by us and may vary, higher or lower, from other estimated valuations or the actual selling price of identical derivatives. Any variance between our estimated fair value price and other estimated or actual prices may be different from Index Strategy type to Index Strategy type and may also change from day to day.
See Appendix A for additional information regarding the Interim Value calculation.
The following hypothetical example assumes no deductions from the Segments and also uses one day market data for calculating the fair value and the option value during the start of the Segment, at 9 months into the Segment, and at maturity. Years (12 months) are assumed to have 365 days.
Net Premium Payment: $150,000 | |||||||||||||||||
| Allocated to: | Amount Invested: | Participation Rate: | Index Growth Cap Rate / {Step Rate}: | Spread: | Buffer: | ||||||||||||
20% 1-Year Capped with Floor | $30,000 | 100% | 7% | N.A. | N.A. | ||||||||||||
20% 1-Year Capped with Buffer | $30,000 | 100% | 20% | N.A. | 10% | ||||||||||||
20% 1-Year Enhanced Cap Rate with Spread & Buffer | $30,000 | 100% | 25% | 2% | 10% | ||||||||||||
20% 1-Year Step Rate Plus with Buffer | $30,000 | 90% | {6%} | N.A. | 10% | ||||||||||||
20% 1-Year Dual Directional with Buffer | $30,000 | 100% | 12% | N.A. | 10% | ||||||||||||
On the Index Strategy Segment Start Date
| Index Strategy | Capped With Floor | Capped With Buffer | Enhanced Cap Rate With Spread & Buffer | Step Rate Plus With Buffer | Dual Directional With Buffer | ||||||||||||
| Index Strategy Segment Duration (in months) | 12 | 12 | 12 | 12 | 12 | ||||||||||||
Months elapsed since Segment Start Date | 0 | 0 | 0 | 0 | 0 | ||||||||||||
| Buffer | N/A | 10% | 10% | 10% | 10% | ||||||||||||
| Starting Index Value | 1,000 | 1,000 | 1,000 | 1,000 | 1,000 | ||||||||||||
Index Strategy Segment Base | $30,000 | $30,000 | $30,000 | $30,000 | $30,000 | ||||||||||||
22
Index Return Is Negative — Value At 9 Months
| Index Strategy | Capped With Floor | Capped With Buffer | Enhanced Cap Rate With Spread & Buffer | Step Rate Plus With Buffer | Dual Directional With Buffer | ||||||||||||
Months Elapsed since Segment Start Date | 9 | 9 | 9 | 9 | 9 | ||||||||||||
Months Remaining in Segment Duration | 3 | 3 | 3 | 3 | 3 | ||||||||||||
| Index Value on Calculation Date | 800 | 800 | 800 | 800 | 800 | ||||||||||||
| Index Return on Calculation Date | -20% | -20% | -20% | -20% | -20% | ||||||||||||
| 1. Fair Value of Index Strategy Segment Base | N/A | $29,882.26 | $29,920.23 | $29,534.20 | $29,698.40 | ||||||||||||
| 2. Options Value | N/A | -$3,082.40 | -$3,078.47 | -$3,082.08 | -$2,723.13 | ||||||||||||
| Interim Value for each Index Strategy Segment (1+2) | N/A | $26,799.87 | $26,841.76 | $26,755.14 | $27,200.85 | ||||||||||||
Interim Value | $30,000 | $26,799.87 | $26,841.76 | $26,755.14 | $27,200.85 | ||||||||||||
Index Return Is Negative — Value At Segment Maturity
| Index Strategy | Capped With Floor | Capped With Buffer | Enhanced Cap Rate With Spread & Buffer | Step Rate Plus With Buffer | Dual Directional With Buffer | ||||||||||||
Months Elapsed since Segment Start Date | 12 | 12 | 12 | 12 | 12 | ||||||||||||
Months Remaining in Segment Duration | 0 | 0 | 0 | 0 | 0 | ||||||||||||
| Index Value on Calculation Date | 800 | 800 | 800 | 800 | 800 | ||||||||||||
| Index Return on Calculation Date | -20% | -20% | -20% | -20% | -20% | ||||||||||||
| Percentage of Index Interest | 0% | -10% | -10% | -10% | -10% | ||||||||||||
| Index Interest | $0 | -$3,000 | -$3,000 | -$3,000 | -$3,000 | ||||||||||||
Maturity Value (Segment Base + Index Interest) | $30,000 | $27,000 | $27,000 | $27,000 | $27,000 | ||||||||||||
Index Return Is Positive — Value At 9 Months
Index Strategy | Capped With Floor | Capped With Buffer | Enhanced Cap Rate With Spread & Buffer | Step Rate Plus With Buffer | Dual Directional With Buffer | ||||||||||||
Months Elapsed since Segment Start Date | 9 | 9 | 9 | 9 | 9 | ||||||||||||
Months Remaining in Segment Duration | 3 | 3 | 3 | 3 | 3 | ||||||||||||
| Index Value on Calculation Date | 1,200 | 1,200 | 1,200 | 1,200 | 1,200 | ||||||||||||
| Index Return on Calculation Date | 20% | 20% | 20% | 20% | 20% | ||||||||||||
| 1. Fair Value of Index Strategy Segment Base | N/A | $29,532.88 | $29,683.52 | $29,534.20 | $29,698.40 | ||||||||||||
| 2. Options Value | N/A | $4,799.73 | $5,152.60 | $5,455.63 | $3,225.01 | ||||||||||||
| Interim Value for Each Index Strategy Segment (1+2) | N/A | $34,681.99 | $35,072.83 | $35,292.85 | $33,148.99 | ||||||||||||
Interim Value | $30,000 | $34,681.99 | $35,072.83 | $35,292.85 | $33,148.99 | ||||||||||||
23
Index Return Is Positive — Value At Segment Maturity
| Index Strategy | Capped With Floor | Capped With Buffer | Enhanced Cap Rate With Spread & Buffer | Step Rate Plus With Buffer | Dual Directional With Buffer | ||||||||||||
Months Elapsed since Segment Start Date | 12 | 12 | 12 | 12 | 12 | ||||||||||||
Months Remaining in Segment Duration | 0 | 0 | 0 | 0 | 0 | ||||||||||||
| Index Value on Calculation Date | 1,200 | 1,200 | 1,200 | 1,200 | 1,200 | ||||||||||||
| Index Return on Calculation Date | 20% | 20% | 20% | 20% | 20% | ||||||||||||
Percentage of Index Interest | 7% | 20% | 18% | 18% | 12% | ||||||||||||
Index Interest | $2,100 | $6,000 | $5,400 | $5,400 | $3,600 | ||||||||||||
Maturity Value (Strategy Base + Index Interest) | $32,100 | $36,000 | $35,400 | $35,400 | $33,600 | ||||||||||||
Managing Your Account Value
Unless required by the terms of the Contract, which includes any riders you have elected, you may not transfer Contract Funds out of an Index Strategy Segment prior to its maturity date.
You may transfer Contract Funds between Variable Investment Options at any time, subject to any transfer limitations described in your Contract’s prospectus. On each Segment maturity date, subject to any allocation restrictions (described in the table below), you may reallocate Contract Funds allocated to Variable Investment Options, the Fixed Rate Option, and any Index Strategy Segment that has reached its maturity date into any available Index Strategy.
Upon receipt of your instructions in Good Order for reallocation of Contract Funds to or from an Index Strategy, we will process the reallocation on the next Segment start date. If we do not receive instructions from you in Good Order prior to the Segment start date, the value of the Contract Fund in any Index Strategy Segment that has reached the Segment maturity date will automatically be allocated to the next Segment of the same Index Strategy or to your last known instructions we have on file. If the same Index Strategy is no longer available, the value of the Contract Fund in any Index Strategy Segment that has reached the Segment maturity date will automatically be allocated to the Fixed Rate Option.
The table below shows when transfers among the investment options are permitted. If you submit a claim under the Chronic Illness Option of the BenefitAccess Rider or exercise the Overloan Protection Rider, you will be subject to additional transfer restrictions and we will apply the Interim Value to any transfers from the Index Strategy Segment before the Segment maturity date. See Riders for more detail.
From Account | To Account | When Allocation Can Occur | ||||||
Variable Investment Option | Variable Investment Option or Fixed Rate Option | Any Business Day (subject to annual limit(1)) | ||||||
Variable Investment Option or Fixed Rate Option | Index Strategy Segment (including Fixed Holding Account) | Allocations can move to the Fixed Holding Account on any Business Day, then to the Index Strategy Segment on the next available start date (subject to annual limit(1)) | ||||||
Index Strategy Segment | Index Strategy Segment or Fixed Rate Option (including Fixed Holding Account) | Index Strategy Segment Maturity Date (subject to limitations(2) | ||||||
Index Strategy Segment | Variable Investment Option | Index Strategy Segment Maturity Date (subject to limitations(2)(3)) | ||||||
| Fixed Rate Option | Variable Investment Option | Any Business Day (subject to annual limit(4)) | ||||||
1.Currently limited to twelve (12) transfers per Contract Year or twenty (20) transfers per Calendar Year.
2.If you elected the Extended Plus No-Lapse Guarantee option of the Lapse Protection Rider, you may only allocate to Index Strategies with Buffers for the first ten (10) Contract Years.
3.The maximum amount that can be allocated annually to the Variable Investment Options from the Index Strategies is 25% of the maturity value of each Index Strategy Segment. If you intend to reallocate the entire balance of your Index Strategies to the Variable Investment Options, you must schedule consecutive annual reallocations by enrolling in the Segment Maturity Allocation Program and following the instructions on our administrative form. The form can be requested by contacting your Pruco Life representative or our customer service office at 800-778-2255, Monday through Friday, 8:00 a.m. to 8:00 p.m., Eastern Time.
4.Annual reallocation elections are currently limited to the greatest of: (1) 25% of the value of the Fixed Rate Option as of the end of the previous Contract Year; (2) $5,000; and (3) the amount allocated to the Variable Investment Options from the Fixed Rate Option in the prior year.
24
IMPORTANT CONSIDERATIONS OF INVESTING IN THE INDEX STRATEGIES ON CONTRACT FUNCTIONS, FEATURES, AND RIDERS
Charges And Expenses
Unless you have directed otherwise, monthly Contract charges (Cost of Insurance, Administrative Charge for the Basic Insurance Amount, Additional Mortality Charge for Certain Risks, and Charges for Rider Coverage) are generally deducted proportionately from the dollar amounts held in each of the Variable Investment Options and the Fixed Rate Option. If the amounts in the Variable Investment Options and the Fixed Rate Option are insufficient to cover the monthly charges, the Variable Investment Options and the Fixed Rate Option will be reduced to zero and the remaining amount due will be deducted first proportionally from dollar amounts held in each of the Fixed Holding Accounts and then (if necessary) from the Index Strategies. Monthly charges deducted from the Index Strategies will be taken proportionally from the most recently created Segment first and continue in a last in – first out (“LIFO”) manner, as needed. Monthly charges deducted from an Index Strategy prior to Segment maturity may result in significant loss due to the Interim Value calculation, particularly if the deductions are ongoing.
Surrender Charge – If, during the first fifteen (15) Contract Years the Basic Insurance Amount is decreased (including as a result of a withdrawal or a Death Benefit type change), we may deduct a percentage of the surrender charge. The surrender charge is generally deducted proportionately from the dollar amounts held in each of the Variable Investment Options and the Fixed Rate Option. If the amounts in the Variable Investment Options and the Fixed Rate Option are insufficient to cover the surrender charge, the Variable Investment Options and the Fixed Rate Option will be reduced to zero and the remaining amount due will be deducted first proportionally from dollar amounts held in each of the Fixed Holding Accounts and then (if necessary) the Index Strategies. A surrender charge deducted from the Index Strategies will be taken proportionally from the most recently created Segment first and continue in a last in - first out (“LIFO”) manner, as needed.
Mortality And Expense Risk Charge – This charge is not assessed against amounts allocated to the Fixed Rate Option, the Fixed Holding Accounts, or the Index Strategies.
Allocated Charges – The Index Strategies and the Fixed Holding Accounts may not be used as a source fund for allocated charges.
Interim Value Of Index Strategies With a Buffer – The Interim Value is used to calculate amounts available for withdrawal, loan, surrender, transfer, payment of a Death Benefit claim, or payment of Contract fees and charges. It is also used to determine how much the Index Strategy Segment Base will be reduced after such a transaction, which could result in a loss that might not otherwise be realized if the full Index Strategy Segment Base remained in the Segment until Segment maturity. It may also result in gains that would not otherwise be realized at Segment maturity. Because the downside protection provided by a Buffer normally does not apply to the Interim Value, it is theoretically possible that you could lose most of your investment, potentially up to 100% of your investment, in extreme scenarios such as an unprecedented complete market collapse. The Interim Value helps ensure that we will be able to meet our obligations under the Contract by shifting the risk of potential investment losses from the Company to you.
Riders
BenefitAccess Rider – When you submit a claim under the Chronic Illness Option, you must authorize a transfer of all Contract Fund value from the Variable Investment Options, the Index Strategies, and the Fixed Holding Accounts to the Fixed Rate Option. You will not receive Benefit Payments if you do not transfer all Contract Fund value to the Fixed Rate Option. Also, your net premium allocation instructions may only utilize the Fixed Rate Option while your claim is reviewed and while you are receiving Benefit Payments. When a claim is submitted, any open Segments must be immediately transferred to the Fixed Rate Option at each Segment’s Interim Value, if applicable. In other words, you may not hold those Segments until maturity. A transfer out of an Index Strategy at a Segment’s Interim Value may result in significant loss.
Each Benefit Payment will reduce the Contract Fund, which will be entirely allocated to the Fixed Rate Option.
Overloan Protection Rider – If you exercise this rider, any unloaned Contract Fund value remaining in the Variable Investment Options, Index Strategies, and Fixed Holding Accounts must be transferred to the Fixed Rate Option. Premium allocation instructions must be updated, if necessary, to only include the Fixed Rate Option. When the rider is exercised any open Segment must immediately be transferred to the Fixed Rate Option at each Segment’s Interim Value, if applicable. In other words, you may not hold those Segments until maturity. A transfer out of an Index Strategy at a Segment’s Interim Value may result in significant loss.
Lapse Protection Rider – If you elect the Lapse Protection Rider and choose the Extended Plus No-Lapse Guarantee option, your investment allocations will be restricted to the Index Strategies with Buffers for the first ten (10) Contract Years. This means you will not have access to the Fixed Rate Option, Index Strategies with Floors or the Variable Investment Options until the beginning of Contract Year eleven (11). Any premium payments received during the first ten (10) Contract Years will be immediately allocated to the Index Strategies with Buffers on the next Segment start date. Maturing Segments during the first ten (10) Contract Years will automatically be reallocated to the same Index Strategy on the next Segment start date, unless you request they be allocated to a different Index Strategy with a Buffer. You will not be allowed to utilize the Designated Transfer program. Although you will have reallocation access to the other investment options beginning in Contract Year eleven (11), any other transfer limitations imposed under the Contract will still apply.
Premiums
Allocation Of Premiums – In addition to the Variable Investment Options and the Fixed Rate Option, you may choose to allocate all or a portion of your net premiums to the Index Strategies. After the end of the 10 day right to cancel period, initial and subsequent net premium amounts allocated to the Index Strategies will be placed in the Fixed Holding Accounts until the next Monthly Transfer Date. We reserve the right to retain any funds in the Fixed Holding Accounts that were received into the Fixed Holding Accounts within two business days prior to a start date until the following monthly start date. We will notify you in advance if we exercise this right.
25
While you are enrolled in the Segment Maturity Allocation Program you will be prohibited from making allocations to any Index Strategy.
We reserve the right to initiate a transfer restriction period whenever a requested loan causes a reduction in value of a Segment. Net Premiums may not be allocated to the Index Strategies during this period. See Loans subsection that follows.
Transfers And Restrictions On Transfers – You may transfer amounts from the Variable Investment Options and/or the Fixed Rate Option to the Index Strategies. Amounts transferred to the Index Strategies will first be placed in the Fixed Holding Accounts until the next start date. Any such requested transfers count towards the limit of 12 transfers per Contract Year and the limit of 20 transfers per calendar year. Transfers from the Fixed Rate Option to the Index Strategies may be made in any amount or percentage and are exempt from the maximum amount limitations applied when requesting a transfer from the Fixed Rate Option to the Variable Investment Options. If you elect the Extended Plus No-Lapse Guarantee option of the Lapse Protection Rider, you may only transfer among Index Strategies with Buffers for the first ten Contract Years. If you submit a claim under the Chronic Illness Option of the BenefitAccess Rider or exercise the Overloan Protection Rider your entire Contract Fund must be allocated to the Fixed Rate Option and you may not transfer to any other investment option. We reserve the right to adjust the limits on the amounts or percentages that may be transferred among the investment options. Additionally, we reserve the right to retain any funds in the Fixed Holding Accounts that were received into the Fixed Holding Accounts within two business days prior to a start date until the following monthly start date. We will notify you in advance if we exercise this right.
Other than at time of Segment maturity, you may not transfer any amounts from the Index Strategies to either the Variable Investment Options, subject to limitations, or the Fixed Rate Option.
You may allocate up to 25% of the maturity value of each Index Strategy Segment to the Variable Investment Options. If you want to allocate more than 25%, you must enroll in our Segment Maturity Allocation Program. This program allows you to allocate the entire maturity value of each Segment to the Variable Investment Options. You will be prohibited from making transfers to any Index Strategy while you are enrolled in this program. If you have instructed us to make designated transfers, those instructions will terminate upon enrollment. When your Segment Maturity Allocation Program ends you may provide new designated transfer instructions. If you have elected the Extended Plus No-Lapse Guarantee, you may not enroll in the Segment Maturity Allocation Program until the 11th Contract Year.
You may transfer amounts from the Fixed Holding Accounts to the Fixed Rate Option. You may not transfer amounts from the Fixed Holding Accounts to the Variable Investment Options. Any such requested transfers from the Fixed Holding Accounts applies towards the limit of 12 transfers per Contract Year and the limit of 20 transfers per calendar year. Transfers from the Fixed Holding Accounts to the Fixed Rate Option may be made in any amount or percentage. You may not conduct transfers from the Fixed Holding Accounts via the website. We reserve the right to deny a transfer request from the Fixed Holding Accounts if the request is received within two business days prior to a Monthly Transfer Date. We will notify you in advance if we exercise this right.
Designated Transfers do not count towards the limit of 12 transfers per Contract Year or the limit of 20 transfers per calendar year. We reserve the right to count such transfers towards the limit. The Fixed Rate Option transfer restrictions do not apply to Designated Transfers.
We reserve the right to initiate a transfer restriction period whenever a requested loan causes a reduction in value of a Segment. See Loans subsection that follows.
Default Reallocations/Transfers – If you have not instructed us otherwise, any Index Strategy Segment that has reached a Segment maturity date will automatically renew into the same Index Strategy. If the same Index Strategy is no longer available, the Contract Funds associated with the closed Index Strategy will be transferred proportionally according to your current instructions, or, if you have no instructions on file, the amount at Segment maturity will default to the Fixed Rate Option. We reserve the right to stop offering any Index Strategy at any time.
Dollar Cost Averaging – The Index Strategies, the Fixed Rate Option, and the Fixed Holding Accounts may not participate in dollar cost averaging.
Auto-Rebalancing – The Index Strategies, the Fixed Rate Option, and the Fixed Holding Accounts may not participate in auto-rebalancing.
Death Benefits
When Death Benefit Proceeds Are Paid – We have the right to delay payment of the Death Benefit attributable to the Fixed Rate Option and Fixed Holding Accounts for up to six months (or a shorter period if required by applicable law). Where required, we will pay interest if such a payment is delayed for more than the number of days established by applicable law. We have the right to postpone paying the part of the proceeds that is to come from any Index Strategy and/or any variable investment option if: (1) the New York Stock Exchange is closed; (2) the SEC requires that trading be restricted or declares an emergency; or (3) the applicable Index Value is not published. A Type B Death Benefit paid from an Index Strategy prior to Segment maturity may be significantly reduced due to an Interim Value calculation.
Contract Values
The total amount invested in the Contract Fund at any time consists of:
(a) the Variable Investment Options;
(b) the Fixed Rate Option;
(c) the Fixed Holding Accounts;
26
(d) the Index Strategies; and
(e) any Contract loan.
How the Contract’s Cash Surrender Value Will Vary – The Contract's Cash Surrender Value on any date will be the Contract Fund less any applicable surrender charge and less any Contract Debt plus any Additional Amount upon surrender. The Index Strategies and the Fixed Holding Accounts are part of the Contract Fund and therefore are included in the Contract’s Cash Surrender Value calculation. The Contract Fund value changes daily, reflecting:
(a) increases or decreases in the value of the Fund(s);
(b) interest credited on any amounts allocated to the Fixed Rate Option;
(c) interest credited on any amounts allocated to the Fixed Holding Accounts;
(d) any Index Interest on a maturing Index Strategy Segment;
(e) any value of an Index Strategy Segment prior to maturity;
(f) interest credited on any loan; and
(g) the daily asset charge for mortality and expense risks assessed against the Variable Investment Options.
Surrenders taken from an Index Strategy prior to Segment maturity may result in significant loss due to an Interim Value calculation.
Loans – When a loan is requested, an amount equal to the loan proceeds is transferred out of the Variable Investment Options and/or the Fixed Rate Option, as applicable. Unless you direct us to take the loan amount from specific investment options, and we agree, the reduction will be made proportionally based on the loanable value held in each of the Variable Investment Options and the Fixed Rate Option. If the amounts in the Variable Investment Options and the Fixed Rate Option are insufficient to cover the requested loan amount, the Variable Investment Options and the Fixed Rate Option will be reduced by the maximum available loanable amount and the remaining amount will be deducted first proportionally from dollar amounts held in each of the Fixed Holding Accounts and then (if necessary) the Index Strategies. Loans deducted from the Index Strategies will be taken from the most recently created Segment first and continue in a last in–first out (“LIFO”) manner, as needed. Loans deducted from an Index Strategy prior to Segment maturity may result in significant loss due to an Interim Value calculation.
You may not direct a loan to be deducted only from the Index Strategies or the Fixed Holding Accounts.
We reserve the right to initiate a transfer restriction period whenever a requested loan causes a reduction in value of a Segment or there is a non-elective transfer from a Segment to another investment option before the maturity date. The transfer restriction period is a 12-month period when no portion of a premium payment may be allocated to the Index Strategies, no transfers from the Variable Investment Options or Fixed Rate Option into the Index Strategies will be permitted, and Designated Transfers will be cancelled. This period begins on the date any portion of a loan causes a reduction in the value of a Segment, except to the extent such reduction is solely due to unpaid interest on the applicable loan; or the date there is a non-elective transfer from a Segment to another investment option before the Index Strategy Segment maturity date. When the transfer restriction period ends, you will again be permitted to allocate premiums to, and transfer funds into, the Index Strategies, and you may provide new Designated Transfer instructions. We will notify you in advance if we exercise this right.
Withdrawals – When a withdrawal is made, an amount equal to the withdrawal amount plus any associated charges is deducted from the Variable Investment Options and/or the Fixed Rate Option, as applicable. Unless you direct us to take the withdrawal plus any associated charges from specific investment options, and we agree, the reduction of the Contract Fund will be made proportionally based on the value held in each of the Variable Investment Options and the Fixed Rate Option. If the amounts in the Variable Investment Options and the Fixed Rate Option are insufficient to cover the requested withdrawal amount plus any associated charges, the Variable Investment Options and the Fixed Rate Option will be reduced to zero and the remaining amount will be deducted first proportionally from dollar amounts held in each of the Fixed Holding Accounts and then (if necessary) from the Index Strategies. Withdrawals deducted from the Index Strategies will be taken from the most recently created Segment first and continue in a last in - first out (“LIFO”) manner, as needed. Withdrawals deducted from an Index Strategy prior to Segment maturity may result in significant loss due to an Interim Value calculation.
You may not direct a withdrawal (and any associated charge), to be deducted only from the Index Strategies or the Fixed Holding Accounts.
When Proceeds Are Paid – We have the right to delay payment of the Cash Surrender Value attributable to the Fixed Rate Option and the Fixed Holding Accounts for up to six months (or a shorter period if required by applicable law). Where required, we will pay interest if such a payment is delayed for more than the number of days established by applicable law.
Elements Subject To Change – Subject to any guarantees described in this prospectus and your Contract’s prospectus, and shown in your Contract's data pages, we have the right to set and to change from time to time the following elements used in calculating the Index Interest for the Index Strategies: Buffer, Spread, Step Rate, Participation Rate, Index Growth Floor, and Index Growth Cap. We will not change the Index elements more frequently than once per month. Any setting of, or changes to any element described above will take into consideration one or more factors including, but not limited to expenses, investment earnings, and profit. Changes will be based on our future expectations with respect to any one or more of the factors we use to determine such changes. Any changes in Index elements will be on a class basis as we determine, and such changes may increase or decrease the Index Interest for future Segments. All changes will be determined only prospectively.
Changes to the Buffer, Spread, Step Rate, Participation Rate, Index Growth Cap, and Index Growth Floor are not tied to the performance of an Index. Note that the most current Buffer, Spread, Step Rate, Participation Rate, Index Growth Cap, and Index Growth Floor can be found on www.Prudential.com/eProspectus or obtained by contacting your Pruco Life representative or our
27
customer service office at 800-778-2255, Monday through Friday, 8:00 a.m. to 8:00 p.m., Eastern Time. All changes to an Index’s Buffer or Index Growth Floor will also be reflected in this prospectus.
ADDITIONAL INFORMATION
About Our Index Strategy Separate Account
Assets supporting the Index Strategies are held in a non-insulated, non-unitized separate account established under Arizona law. These assets are subject to the claims of the creditors of Pruco Life and the benefits provided under the Index Strategies are subject to the claims paying ability of Pruco Life.
An Owner does not have any interest in or claim on the assets in the Separate Account. In addition, neither an Owner nor amounts allocated to the Index Strategies participate in the performance of the assets held in the Separate Account.
We are not obligated to invest according to specific guidelines or strategies except as may be required by Arizona and other state insurance laws.
Distribution Of Contracts
The Contract is distributed by Pruco Securities, LLC, which serves as the principal underwriter for the Pruco Life Variable Universal Account. The offering is intended to be continuous. The Index Strategies are only available under the Contract issued by the Company. Extensive information about the arrangements for distributing the Contract, including sales compensation, is included under “Distribution of Contract” in the Contract prospectus and statement of additional information. All of that information applies regardless of whether or not you elect the Index Strategies, and there is no additional plan of distribution or sales compensation with respect to the Index Strategies. There is also no change to the information regarding the fact the principal underwriter is an affiliate of the Company or an indirect wholly owned subsidiary of the Company.
How To Reach Us
You may contact us for further information at the address and telephone number inside the front cover of this prospectus. For service or questions about your Contract, please contact our Service Office at the phone number on the back cover, or at P.O. Box 7390, Philadelphia, Pennsylvania 19176.
Additional information about us and this offering is available in the registration statement and the exhibits thereto, as well as in documents incorporated by reference into this prospectus (which means they are legally part of this prospectus). You may review and obtain copies of these materials at no cost to you by contacting us. They may also be obtained through the Securities and Exchange Commission’s Internet Website (www.SEC.gov), which the SEC maintains for us, and other registrants that file electronically with the SEC.
Experts
The financial statements of Pruco Life Insurance Company as of December 31, 2025 and 2024 and for each of the three years in the period ended December 31, 2025 included in this prospectus have been so included in reliance on the report of PricewaterhouseCoopers LLP, an independent registered public accounting firm, given on the authority of said firm as experts in auditing and accounting.
Legal Proceedings
We are subject to legal and regulatory actions in the ordinary course of our business. Pending legal and regulatory actions include proceedings specific to us and proceedings generally applicable to business practices in the industry in which we operate. We may be subject to class action lawsuits and other litigation involving a variety of issues and allegations involving sales practices, claims payments and procedures, premium charges, contract servicing and breach of fiduciary duty to customers. We may also be subject to litigation arising out of our general business activities, such as our investments, contracts, leases and labor and employment relationships, including claims of discrimination and harassment, and could be exposed to claims or litigation concerning certain business or process patents. In addition, we, along with other participants in the businesses in which we engage, may be subject from time to time to investigations, examinations and inquiries, in some cases industry-wide, concerning issues or matters upon which such regulators have determined to focus.
Our litigation and regulatory matters are subject to many uncertainties, and given their complexity and scope, their outcome cannot be predicted. In some of our pending legal and regulatory actions, parties are seeking large and/or indeterminate amounts, including punitive or exemplary damages. It is possible that our results of operations or cash flow in a particular quarterly or annual period could be materially affected by an ultimate unfavorable resolution of pending litigation and regulatory matters depending, in part, upon the results of operations or cash flow for such period. In light of the unpredictability of our litigation and regulatory matters, it is also possible that in certain cases an ultimate unfavorable resolution of one or more pending litigation or regulatory matters could have a material adverse effect on our financial position.
Management believes, however, that, based on information currently known to it, the ultimate outcome of all pending litigation and regulatory matters, after consideration of applicable reserves and rights to indemnification, is not likely to have a material adverse effect on the Contract, the ability of Pruco Securities, LLC to perform its contract with us, or our ability to meet our obligations under the Contract.
28
ABOUT PRUCO LIFE INSURANCE COMPANY
Pruco Life Insurance Company (“Pruco Life”) is a wholly owned subsidiary of The Prudential Insurance Company of America (“Prudential Insurance”), which in turn is a direct wholly owned subsidiary of Prudential Financial, Inc. (“Prudential Financial”). Pruco Life is a stock life insurance company organized in 1971 under the laws of the State of Arizona. It is licensed to sell life insurance and annuities in the District of Columbia, Guam, and in all states except New York, and sells such products primarily through affiliated and unaffiliated selling firms. Pruco Life is located at 213 Washington Street, Newark, NJ 07102. Our internet address is www.Prudential.com.
Pruco Life has one wholly owned insurance subsidiary, Pruco Life Insurance Company of New Jersey (“PLNJ”). Pruco Life and its subsidiary are together referred to as the “Company”, “we” or “our” and all financial information is shown on a consolidated basis. PLNJ is a stock life insurance company organized in 1982 under the laws of the state of New Jersey. It is licensed to sell life insurance and annuities in New Jersey and New York only.
Prudential Insurance may make capital contributions to the Company, as needed, to enable it to comply with its reserve and capital requirements and fund expenses in connection with its business. Prudential Insurance is under no obligation to make such contributions and its assets do not back the benefits payable under the Company’s contract owners’ contracts.
No company other than Pruco Life has any legal responsibility to pay amounts that it owes its contract owners. Prudential Financial, however, exercises significant influence over the operations and capital structure of Pruco Life.
Pursuant to the delivery obligations under Section 5 of the Securities Act of 1933 (“Securities Act”) and Rule 159 thereunder, Pruco Life delivers this prospectus to current Contract Owners that reside outside of the United States. In addition, we may not market or offer benefits, features or enhancements to prospective or current Contract Owners while outside of the United States.
The SEC maintains an internet site (www.SEC.gov) that contains reports, proxy and information statements, and other information regarding issuers that file electronically with the SEC. We rely on the exemption from the reporting requirements of Section 15(d) of the Securities Exchange Act of 1934, as amended (the “1934 Act”), provided by Rule 12h-7 under the 1934 Act with respect to registered non-variable insurance contracts (such as contingent deferred annuities, index-linked investment options and fixed investment options subject to a market value adjustment) that we issue.
Our Business
Insurance Products
The Company sells variable annuities, indexed variable annuities and fixed annuities, contingent deferred annuities, variable life, term life and universal life insurance primarily through affiliated and unaffiliated distributors in the United States.
Variable and Indexed Variable Annuities
Our variable annuities are designed to provide tax-deferred asset accumulation through a suite of underlying variable investment options, annuitization options and death benefits. We sell indexed variable annuities that provide index-linked investment options in addition to these traditional investment options. Index strategies provide an interest component linked to, but not an investment in, the selected index, and its performance over the elected term, subject to parameters such as cap, step, participation and buffer rates, as well as contractual minimums and maximums. These annuities may include a protected income benefit.
Fixed and Fixed Indexed Annuities
Our single premium fixed indexed annuities offer flexibility to allocate account balances between an index-based strategy and a fixed rate strategy. The index-based strategy provides interest or an interest component linked to, but not an investment in, the selected index, and its performance over the elected term, subject to certain contractual minimums and maximums. The fixed rate strategy, not associated with an index, offers a guaranteed growth at a set interest rate for one year and can be renewed annually. These annuities may include principal protection and guaranteed lifetime withdrawal benefits.
We also sell single premium fixed annuities without index strategies that are designed to provide principal protection and guaranteed lifetime withdrawals, multi-year guaranteed annuities that are designed to provide tax-deferred growth with guaranteed rates of return over a specified guaranteed rate period, and single premium immediate group annuities that are designed to provide guaranteed income payments within an employer-based retirement plan.
Contingent Deferred Annuities
In June 2025, we began offering a contingent deferred annuity, which provides a longevity benefit designed to allow periodic withdrawals from a third-party investment account until the assets are depleted and we are obligated to make guaranteed payments, if ever.
Variable Life
Our variable life contracts are designed to provide permanent coverage for life with potential to accumulate contract cash value based on underlying investment options. Our variable life contracts offer flexibility in payment options and the potential to accumulate cash value through a suite of Variable Investment Options or a Fixed Rate Option. We sell indexed variable life contracts that provide index-linked investment options in addition to these traditional investment options. Index strategies credit interest to the cash value that is linked to, but not an investment in, the performance of an external index, subject to certain parameters such as cap, step, participation and buffer rates, as well as contractual minimums/maximums.
29
Term Life
Our term life contracts are designed to provide coverage for a specified number of years with a guaranteed tax-advantaged death benefit. Most of our term life contracts offer an income tax-free death benefit and guaranteed premiums that will stay the same during the level-premium period. Most of our term life contracts also offer a conversion option that allows the contract owner to convert the contract into a permanent contract that can potentially cover the insured for life.
Universal Life
We sell universal life contracts that are designed to provide permanent coverage for life with the potential to accumulate contract cash value. Our universal life contracts offer flexibility in payment options and the potential to accumulate cash value in an account that earns interest based on a crediting rate determined by the Company, subject to contractual minimums. Our indexed universal life contracts provide interest credited to the cash value that is linked to, but not an investment in, the performance of an external index subject to certain cap and participation rates as well as contractual minimums/maximums.
Other
We also offer third-party stable value bank owned life insurance (“BOLI”) contracts, which earn fee revenue in exchange for a guaranteed minimum interest rate on wrapped assets, and final expense insurance, a whole life product that provides coverage in smaller face amounts typically used for funeral expenses.
Revenues And Profitability
Our revenues primarily come in the form of:
•Fee income from asset management fees and service fees, which represent administrative service and distribution fees from many of our proprietary and non-proprietary mutual funds. The asset management fees are determined as a percentage of the average assets allocated to our proprietary mutual funds in our variable annuity and variable universal life products (net of sub-advisory expenses related to non-proprietary sub-advisers).
•Contract charges and fee income representing mortality, expense and other fees for various insurance-related options and features based on asset-based fees of the separate accounts, account value, premium, or guaranteed value, as applicable.
•Investment income (which contributes to the net spread over interest credited on certain products and related expenses).
•Premiums that are fixed in accordance with the terms of the contracts.
Our profitability is substantially impacted by our ability to appropriately price our products. We price our products based on:
•An evaluation of the risks assumed and consideration of applicable risk management strategies, including hedging and reinsurance costs.
•Assumptions regarding investment returns and contract owner behavior, including persistency, benefit utilization and the timing and efficiency of withdrawals for contracts with living benefit features, as well as other assumptions.
•Our life-related product assumptions of future mortality and morbidity, contract owner behavior, interest rates and investment returns, expenses, premium payment patterns, performance and cost of ceded reinsurance, separate account fund performance and product-generated tax deductions.
Marketing And Distribution
Our distribution efforts for our annuity products, which are supported by a network of internal and external wholesalers, are executed through a diverse group of distributors including:
•Third-party distribution through:
◦Broker-dealers;
◦Banks and wirehouses;
◦Independent financial planners; and
◦Marketing Organizations.
•Financial professionals associated with Prudential Advisors, Prudential's proprietary nationwide advice organization.
We primarily distribute our individual life products through the following three channels:
•Third-party distribution through:
◦Independent brokers;
◦Banks and wirehouses; and
◦General agencies and producer groups
•Financial professionals associated with Prudential Advisors, Prudential's proprietary nationwide advice organization.
•Trusted Partnerships, via embedded digital solutions through:
◦Credit Unions;
◦Mortgage originators;
◦Affinities; and
◦Digital marketing affiliates/paid media efforts.
30
Reinsurance
We regularly enter into third-party reinsurance agreements as either the ceding entity or the assuming entity. We also enter into affiliated reinsurance agreements as both the ceding and assuming entity for capital management purposes. As a ceding entity, exposure to the risks reinsured is reduced by transferring certain rights and obligations of the underlying insurance product to a counterparty. Conversely, as an assuming entity, exposure to the risks reinsured is increased by assuming certain rights and obligations of the underlying insurance products from a counterparty.
We enter into reinsurance agreements as the ceding entity for a variety of reasons but primarily to reduce exposure to loss, reduce risk volatility, provide additional capacity for future growth and for capital management purposes for certain of our variable annuity, term and universal life products. Under ceded reinsurance, we remain liable to the underlying contract owner if a third-party reinsurer is unable to meet its obligations. We evaluate the financial condition of reinsurers, monitor the concentration of counterparty risk and maintain collateral, as appropriate, to mitigate this exposure.
For contracts sold through 2017, we have reinsured the majority of our mortality risk which generally have maximum retained mortality risk amount of $100,000. For the new business going forward, Pruco Life retains the mortality risk not ceded to third-party or affiliated reinsurers, which may be up to $20 million on a single life and then down to $10 million per life for new business starting in 2020.
See “Management’s Discussion and Analysis of Financial Condition and Results of Operations” for a discussion of significant reinsurance transactions and their impact on our financial results.
Competition
We are among the industry’s largest providers of individual annuities and we compete with many providers of retirement savings and accumulation products, including large, well established insurance and financial services companies, and private equity firms. We believe our competitive advantage lies primarily in our innovative product features and our risk management strategies as well as brand recognition, financial strength, the breadth of our distribution platform and our customer service capabilities. We periodically adjust product offerings, prices and features based on the market and our strategy, with a goal of achieving customer and enterprise value.
In our life insurance business, we compete with many large, well-established life insurance companies in a mature market. We compete primarily based on price, service (including the speed and ease of underwriting), distribution channel relationships, brand recognition and financial strength. We periodically adjust product offerings, prices and features based on the market and our strategy, with a goal of achieving customer and enterprise value.
Regulation
Our businesses are subject to comprehensive regulation and supervision. The purpose of these regulations is primarily to protect our customers and the overall financial system. Many of the laws and regulations to which we are subject are regularly re-examined. Existing or future laws and regulations may become more restrictive or otherwise adversely affect our operations or profitability, increase compliance costs, or increase potential regulatory exposure. In recent years we have experienced, and expect to continue to experience, extensive changes in the laws and regulations, and regulatory frameworks, applicable to our businesses. We cannot predict how current or future initiatives will further impact existing laws, regulations and regulatory frameworks.
State insurance laws regulate all aspects of our business. Insurance departments in the District of Columbia, Guam and all states monitor our insurance operations. The Company is domiciled in Arizona and its principal insurance regulatory authority is the Arizona Department of Insurance and Financial Institutions (“AZ DIFI”). Our subsidiary PLNJ is domiciled in New Jersey and its principal insurance regulatory authority is the New Jersey Department of Banking and Insurance ("NJDOBI"). Generally, our insurance products must be approved by the insurance regulators in the state in which they are sold. Our insurance products are substantially affected by federal and state tax laws.
Our variable annuities and life insurance contracts and certain of our non-variable insurance products are considered securities under the U.S. federal securities laws and are generally required to be registered under the Securities Act of 1933 and are subject to regulation by the Securities and Exchange Commission (“SEC”) and the Financial Industry Regulatory Authority (“FINRA”). The separate accounts that support our registered variable insurance products are also required to be registered and must comply with the requirements of the Investment Company Act of 1940 and the SEC’s rules and regulations thereunder. The SEC and FINRA may from time to time make inquiries and conduct examinations of our compliance with federal securities laws and regulations.
Dodd-Frank Wall Street Reform and Consumer Protection Act
The Dodd-Frank Wall Street Reform and Consumer Protection Act (“Dodd-Frank”) increased the potential for federal regulation of our businesses. Under Dodd-Frank, the Financial Stability Oversight Council (“FSOC” or the “Council”) may designate a financial company as a non-bank systemically important financial institution (a “SIFI”) subject to supervision by the Board of Governors of the Federal Reserve System (“FRB”) if the FSOC determines that either (i) material financial distress at the entity, or (ii) the nature, scope, size, scale, concentration, interconnectedness, or mix of the entity’s activities, could pose a threat to domestic financial stability. In November 2023, the FSOC adopted revisions to SIFI designation guidance and the accompanying analytical framework for assessing risks from companies and activities, which will make it easier to designate financial companies as SIFIs going forward. In a House Financial Services Committee meeting on May 7, 2025, the Department of Treasury Secretary indicated that FSOC intends to reassess the 2023 guidance. Prudential is not currently designated as a SIFI.
We cannot predict what actions the FSOC will take with respect to designating Prudential or whether interpretive guidance, new legislation or other initiatives aimed at revising Dodd-Frank and regulation of the financial system will impact the Company.
31
ERISA
The Employee Retirement Income Security Act (“ERISA”) is a comprehensive federal statute that applies to U.S. employee benefit plans sponsored by private employers and labor unions. Plans subject to ERISA include pension and profit sharing plans and welfare plans, including health, life and disability plans. ERISA provisions include reporting and disclosure rules, standards of conduct that apply to plan fiduciaries and prohibitions on transactions known as “prohibited transactions,” such as conflict-of-interest transactions and certain transactions between a benefit plan and a party in interest. ERISA also provides for civil and criminal penalties and enforcement. Prudential Financial's insurance, investment management and retirement businesses provide services to employee benefit plans subject to ERISA, including services where Prudential Financial may act as an ERISA fiduciary. In addition to ERISA regulation of businesses providing products and services to ERISA plans, Prudential Financial becomes subject to ERISA’s prohibited transaction rules for transactions with those plans, which may affect Prudential Financial’s ability to enter transactions, or the terms on which transactions may be entered, with those plans, even in businesses unrelated to those giving rise to party in interest status.
Fiduciary Rules and Other Standards of Care
The Company and our distributors are subject to rules regarding the standard of care applicable to sales of our products and the provision of advice to our customers, including, among others, the U.S. Department of Labor (“DOL”) fiduciary rule, the SEC Regulation Best Interest, and the National Association of Insurance Commissioners (“NAIC”) Standard of Care regulations.
DOL Fiduciary Rule
The DOL “fiduciary” rule is a set of regulations establishing a uniform standard of care for investment professionals who provide advice to retirement savers. The rule is designed to ensure that investment professionals who are “fiduciaries” under the rule act in the best interest of their clients. The rule provides, among other things, that fiduciaries may not recommend investments that they own or in which they have a financial interest. The rule also requires fiduciaries to provide clients with certain information about their investment recommendations, including information about fees and risks. Compliance with the DOL fiduciary rule has resulted in increased costs.
In April 2024, the DOL adopted a final rule, which had been proposed in October 2023, titled the “Retirement Security Rule,” and issued final amendments to several prohibited transaction class exemptions (“PTEs”) available to investment advice fiduciaries. Key aspects of the final rule include, among other things: (1) a broader definition of “investment advice fiduciary,” which includes financial service providers who give compensated investment advice to individual retirement account owners, participants in workplace plans such as 401(k)s, and plan officials responsible for administering plans and managing plan assets; and (2) when relying on the amended PTEs, the requirement to comply with various conditions such as providing clients with certain information about their investment recommendations and complying with a best interest standard of care. The amended PTEs allow fiduciaries to engage in certain transactions that would otherwise be prohibited, provided they meet certain conditions designed to protect retirement investors.
The final rule and amended PTEs were scheduled to become effective in September 2024, with a one-year phase in period for certain conditions of the amended PTEs; however, there are pending legal challenges to the rule which could, among other things, delay its implementation in whole or in part. In July 2024, two United States District Courts issued orders staying the effective date of the rule during the pendency of the suits and any appeals. In September 2025, the DOL published a regulatory agenda indicating that the DOL will revisit the fiduciary rule in light of these legal proceedings.
SEC Regulation Best Interest
In June 2019, the SEC adopted a package of rulemakings and interpretative guidance that, among other things, requires broker-dealers to act in the best interest of retail customers when recommending securities transactions or investment strategies to them. The guidance also clarifies the SEC’s views of the fiduciary duty that investment advisers owe to their clients. The best interest standards became effective on June 30, 2020 and have been a focus of SEC examinations and enforcement activity since. The standards apply to recommendations to purchase certain of our products and have resulted in increased compliance costs.
NAIC Standard of Care
In February 2020, the NAIC adopted revisions to the model suitability rule applicable to the sale of annuities. The revised model regulation provides that the insurance salesperson must act “without placing the producer’s or the insurer’s financial interest ahead of the consumer’s interest.” As of April 21, 2025, all states have adopted the revised model regulation except New York, which adopted its own standard of care.
U.S. State Insurance Holding Company Regulation
We are subject to the Arizona insurance holding company law which requires us to register with the insurance department and to furnish annually financial and other information about the operations of the Company. Generally, all transactions with affiliates that affect the Company must be fair and reasonable and, if material, require prior notice and approval or non-disapproval by the AZ DIFI. Similar laws are applicable to PLNJ in New Jersey.
Change of Control
Most states have insurance laws that require regulatory approval of a direct or indirect change of control of an insurer or an insurer’s holding company. Laws such as these that apply to us prevent any person from acquiring control of Prudential Financial or of its insurance subsidiaries unless that person has filed a statement with specified information with the insurance regulators and has obtained their prior approval. Under most states’ statutes, acquiring 10% or more of the voting stock of an insurance company or its parent company is presumptively considered a change of control, although such presumption may be rebutted. New Jersey has recognized an additional presumption of control upon the holding or controlling of enough proxies to elect 10% or more of the board of directors of a New Jersey-domiciled insurance company or its parent company. Accordingly, any person who acquires “control” of
32
Prudential Financial, either by the acquisition of voting securities or, in the case of New Jersey, by the accumulation of proxies without the prior approval of the applicable insurance regulator of the states in which our U.S. insurance companies are domiciled will be in violation of these states’ laws and may be subject to injunctive action requiring the disposition or seizure of those securities or proxies by the relevant insurance regulator or prohibiting the voting of those securities or proxies and to other actions determined by the relevant insurance regulator. In addition, many state insurance laws require prior notification to state insurance departments of a change in control of a non-domiciliary insurance company doing business in that state.
Group-Wide Supervision
The New Jersey Department of Banking and Insurance ("NJDOBI") acts as the group-wide supervisor of Prudential Financial pursuant to New Jersey legislation that authorizes group-wide supervision of internationally active insurance groups (“IAIGs”). The law, among other provisions, authorizes NJDOBI to examine Prudential Financial and its subsidiaries, including by ascertaining the financial condition of the insurance companies for purposes of assessing enterprise risk. In accordance with this authority, NJDOBI receives information about Prudential Financial’s operations beyond those of its New Jersey domiciled insurance subsidiaries.
Additional areas of focus regarding group-wide supervision of insurance holding companies include the following:
•Examination. State insurance departments conduct comprehensive financial examinations of the books and records, financial reporting, contract filings, and market conduct of insurance companies domiciled in their states no less than every five years under state laws in accordance with NAIC models adopted nationwide. As group-wide supervisor, NJDOBI, along with our other insurance regulators, has expanded the periodic examinations to cover Prudential and all of its subsidiaries. In 2023, NJDOBI and AZ DIFI, along with the insurance regulators of Connecticut and Indiana, concluded a global consolidated group-wide examination of Prudential Financial and its subsidiaries for the five-year period ended December 31, 2021, with no reportable findings or statutory violations.
•Group Capital Calculation. The NAIC has developed and implemented a group capital calculation that uses a risk-based capital (“RBC”) aggregation methodology to serve as an additional tool to help state regulators assess potential risks within and across insurance groups.
•College of Supervisors. Several of our domestic and foreign regulators participate in an annual supervisory college facilitated by NJDOBI. The purpose of the supervisory college is to promote ongoing supervisory coordination, facilitate the sharing of information among regulators and enhance each regulator’s understanding of the Company’s risk profile.
We cannot predict what, if any, additional requirements and compliance costs any new group-wide standards will impose on Prudential Financial.
U.S. Insurance Operations
Generally, our insurance products must be approved by the insurance regulators in the state in which they are sold. Our insurance products are substantially affected by federal and state tax laws.
State Insurance Regulation
State insurance authorities have broad administrative powers with respect to all aspects of the insurance business including: (1) licensing to transact business; (2) licensing agents; (3) admittance of assets to statutory surplus; (4) regulating premium rates for certain insurance products; (5) approving contract forms; (6) regulating unfair trade and claims practices; (7) establishing reserve requirements and solvency standards; (8) fixing maximum interest rates on life insurance contract loans and minimum accumulation or surrender values; (9) regulating the type, amounts and valuations of investments permitted; (10) regulating reinsurance transactions, including the role of captive reinsurers; and (11) other matters.
State insurance laws and regulations, including the NAIC's Insurance Holding Company Act Model #440, require the Company to file financial statements with the domestic regulators for each insurer, in accordance with accounting practices and procedures prescribed or permitted by the department. The Company’s operations and accounts are subject to financial examination by the domiciliary department at any time. In accordance with Model #440, other states typically defer to the primary domestic supervisor on financial statements and oversight, so long as that domestic supervisor’s state is accredited.
Financial Regulation
Dividend Payment Limitations — The Arizona insurance law regulates the amount of dividends that may be paid by the Company.
Risk-Based Capital — We are subject to RBC requirements that are designed to enhance regulation of insurers’ solvency. The RBC calculation, which regulators use to assess the sufficiency of an insurer’s statutory capital, measures the risk characteristics of a company’s assets, liabilities and certain off-balance sheet items. In general, RBC is calculated by applying factors to various asset, premium, claim, expense and reserve items. Within a given risk category, these factors are higher for those items with greater underlying risk and lower for items with lower underlying risk. Insurers that have less statutory capital than required are considered to have inadequate capital and are subject to varying degrees of regulatory action depending upon the level of capital inadequacy.
The RBC framework is subject to periodic reexamination or revision. On February 20, 2025, the NAIC launched an RBC Model Governance Task Force to develop guiding principles to be used in updating RBC formulas, and on September 23, 2025 the task force published a set of proposed preliminary principles for public comment. Due to the ongoing nature of the NAIC's activities regarding RBC, we cannot determine the ultimate timing of proposed changes or their impact to the Company.
Insurance Reserves — State insurance laws require us to analyze the adequacy of our reserves annually. Our appointed actuary must submit an opinion that our reserves, when considered in light of the assets we hold with respect to those reserves, make adequate provision for our contractual obligations and related expenses.
33
Principle-Based Reserving for Life Insurance Products — In 2016, the NAIC adopted a principle-based reserving ("PBR") approach for life insurance products. Principle-based reserving replaces the reserving methods for life insurance products for which the former formulaic basis for reserves may not accurately reflect the risks or costs of the liability or obligations of the insurer. PBR does not affect reserves for contracts in force prior to January 1, 2017. We use captive reinsurance subsidiaries to finance the portion of statutory reserves for term and universal life contracts that we consider to be non-economic for contracts written prior to the implementation of PBR.
New York Life Insurance Product Reserves — As a result of an agreement with the NY DFS regarding PLNJ's reserving methodologies for certain life insurance products, PLNJ holds additional statutory reserves on a New York basis, which reduces PLNJ's New York statutory surplus. PLNJ is not domiciled in New York, and these changes do not impact statutory reserves reported in New Jersey, its state of domicile, and therefore do not impact PLNJ's RBC ratio; however, the agreed reserve methodology may require PLNJ to hold additional New York statutory reserves in the future. New York’s version of PBR, which became effective in January 2020, allows for modifications to the NAIC valuation model and New York’s modifications might require us to increase our New York statutory reserves.
Reinsurance — The NAIC is working on several initiatives related to the use of reinsurance. In August 2025, the NAIC voted to adopt Actuarial Guideline LV (“AG 55”), which requires asset adequacy testing for certain life and health annuity reinsurance transactions using a cash flow testing methodology. Due to the ongoing nature of this work, we cannot predict what, if any, impact these initiatives will have on our businesses.
Interest Maintenance Reserve — In August 2023, the NAIC adopted a temporary change in the statutory accounting treatment of net negative interest maintenance reserves (“IMR”) that permits an insurer to admit net negative IMR up to 10% of their adjusted statutory surplus, provided such insurer’s RBC ratio remains above 300% of its Authorized Control Level RBC. This temporary guidance, which was set to expire on December 31, 2025, has been extended through December 31, 2026, while the NAIC develops a long-term solution regarding the accounting treatment of negative IMR.
Market Conduct Regulation
State insurance laws and regulations include numerous provisions governing the marketplace activities of insurers, including provisions governing the form and content of disclosure to consumers, illustrations, advertising, sales practices and complaint handling, as well as underwriting and claims activity. State regulatory authorities generally enforce these provisions through periodic market conduct examinations. We have been subject to market conduct examinations relating to our marketplace activities, including with respect to the policies and procedures we use to locate guaranteed group annuity customers and establish related reserves. Market conduct examinations by state regulatory authorities have resulted and may in the future result in us increasing statutory reserves, changing operational processes and procedures, and being subject to fines or other discipline.
Insurance Guaranty Association Assessments
Each state has insurance guaranty association laws under which insurers doing business in the state are members and may be assessed by state insurance guaranty associations for certain obligations of insolvent insurance companies to contract owners and claimants. Typically, states assess each member insurer in an amount related to the member insurer’s proportionate share of the line of business written by all member insurers in the state. The majority of state guaranty association laws provide a tax offset for a percentage of the assessment against future years' premium taxes. For the year ended December 31, 2025, we paid $4 million in assessments pursuant to state insurance guaranty association laws. While we cannot predict the amount and timing of future assessments on the Company under these laws, we have established estimated reserves totaling approximately $1 million as of December 31, 2025, for future assessments relating to insurance companies that are currently subject to insolvency proceedings.
U.S. Federal And State Securities Regulation Affecting Insurance Operations
Our variable life insurance and variable annuity products generally are “securities” within the meaning of federal securities laws and may be required to be registered under the federal securities laws and subject to regulation by the SEC and the Financial Industry Regulatory Authority (“FINRA”). Federal securities regulation affects investment advice, sales and related activities with respect to these products.
In certain states, our variable life insurance and variable annuity products are considered “securities” within the meaning of state securities laws. As securities, these products may be subject to filing and certain other requirements. Also, sales activities with respect to these products generally are subject to state securities regulation. Such regulation may affect investment advice, sales and related activities for these products.
SECURE Act
The Setting Every Community up for Retirement Enhancement (“SECURE”), enacted in 2020, together with SECURE 2.0, which was enacted in 2022 as part of the 2023 Consolidated Appropriations Act (collectively, the "SECURE Act"), is intended to help promote retirement plan coverage and increase retirement plan savings, as well as facilitate access to guaranteed lifetime income solutions. The SECURE Act addresses coverage issues by making it easier for small businesses to participate in pooled employer plans and requires coverage of certain long-term, part-time workers. The SECURE Act addresses savings issues by raising the cap on amounts contributed through auto-enrollment, increasing the maximum age for required minimum withdrawals and removing the age cap for making Individual Retirement Account ("IRA") contributions. The SECURE Act also made it easier for employers to include guaranteed lifetime income as part of their plan by providing an annuity provider selection safe harbor, as well as providing for the portability of participant investments in annuity products.
34
Derivatives Regulation
Prudential Financial and its subsidiaries use derivatives for various purposes, including hedging interest rate, foreign currency, equity market and other exposures. Dodd-Frank established a framework for regulation of the over-the-counter derivatives markets. This framework sets out requirements regarding the clearing and reporting of derivatives transactions, as well as collateral posting requirements. Affiliated swaps entered into between Prudential Financial subsidiaries are generally exempt from most of these requirements.
We continue to monitor regulatory developments and the potential hedging cost impacts of margin requirements, and increased capital requirements for derivatives transactions. Additionally, the need to post cash and certain collateral may also require the liquidation of higher yielding assets for cash, resulting in a negative impact on investment income.
Privacy, Data Protection and Cybersecurity Regulation
We are subject to U.S. federal laws, regulations and directives that require financial institutions and other businesses to protect the security and confidentiality of personal, proprietary, or other non-public information, including intellectual property, health-related and customer information, which they may handle and process, and to notify their customers and other appropriate individuals of their policies and practices relating to the collection, use and disclosure of such information. In addition, we are subject to international data protection and privacy laws, regulations, and directives concerning the safeguarding and protection of personal information, including as such laws relate to the cross border transfer or use of personal information. These laws, regulations and directives also:
•require protections regarding or limiting the use and disclosure of certain sensitive personal information such as national identifier numbers (e.g., social security numbers) or racial or ethnic origin;
•require periodic disclosure of privacy policies and practices to customers and consumers;
•require notice to affected individuals, regulators and others if there is a breach of the confidentiality, integrity, or availability of certain personal or confidential information;
•require financial institutions and creditors to implement effective programs to detect, prevent, and mitigate identity theft;
•require the proper disposal of customer and consumer information;
•regulate the process by which financial institutions make telemarketing calls and send e-mail, text, or fax messages to consumers and customers;
•require oversight of third-parties that have access to, and handle, personal or confidential information;
•provide individuals with certain rights over their personal information, such as the right to know (and in some cases, choose) what personal information is being collected and whether the information is being sold or shared, and the right to obtain portable copies of or request the deletion or correction of their personal information; and
•prescribe the permissible uses of certain personal information, including customer information and consumer report information.
Regulatory and legislative activity in the areas of privacy, data protection and information and cybersecurity continues to increase worldwide. Financial regulators in the U.S. and international jurisdictions in which Prudential Financial operates continue to focus on data privacy and cybersecurity, including in rulemaking and examinations of regulated entities, and have communicated heightened expectations. For example, the E.U.’s General Data Protection Regulation (“GDPR”), which became effective in May 2018, and the U.K,'s Data Protection Act 2018, confer additional privacy rights on individuals in the E.U. and U.K. and establish significant penalties for violations. Prudential business units (regardless of whether they are located in the E.U.) may be subject to the GDPR when personal data is processed in relation to the offer of goods and services to individuals within the E.U. or if we were to monitor the activities of individuals within the E.U. The E.U.’s Digital Operational Resilience Act came in force in January 2023 became be effective from January 2025. Internationally, a number of countries such as Brazil, India, and Japan have enacted GDPR-like regulations, while others, such as Argentina, are considering such regulations or, in the case of China, have enacted other privacy and data security regulations.
In addition, in the U.S., certain lawmakers in Congress have proposed a number of sweeping privacy laws, and amendments to the Gramm-Leach-Bliley Act of 1999 (“GLBA”) took effect in June 2023. On May 16, 2024, the SEC adopted amendments to Regulation S-P, a set of privacy rules adopted pursuant to the GLBA, that broaden the scope of information that we are required to safeguard and impose significant new obligations related to incident response and prevention, the notification of affected individuals, and the oversight of third party vendors. Compliance with the Regulation S-P amendments is mandated as of December 3, 2025, and is expected to increase our compliance costs.
In California, the California Consumer Privacy Act (the “CCPA”) confers numerous privacy rights on individuals, including expanded privacy protections and control over the collection, use and sharing of their personal information, and corresponding obligations on businesses, including requirements to make certain disclosures to California consumers regarding personal information, among other privacy protective measures. Failure to comply with the CCPA risks regulatory fines, and the CCPA grants a private right of action and statutory damages for any unauthorized access and exfiltration, theft, or disclosure of certain types of personal information resulting from a violation of the duty to maintain reasonable security procedures and practices. The California Privacy Rights Act (the “CPRA”) imposes additional rights and obligations including expanding consumers rights with respect to certain sensitive personal information. The CPRA also created the California Privacy Protection Agency (“CPPA”) with authority to implement and enforce the CCPA, the CPRA and their regulations. In 2025, the CPPA significantly revised the regulations under the CCPA. The revised regulations, which go into effect on January 1, 2026, are broad in scope and apply to us with regard to personal information that is not subject to the California Insurance Code and its regulations and is not within the bounds of certain data-level exemptions such as the GLBA, the Fair Credit Reporting Act, and the California Financial Information Privacy Act.
35
Additionally, privacy laws in the United States continue to evolve, with states such as Indiana, Kentucky, and Rhode Island recently enacting comprehensive privacy and information security laws and regulations effective as of January 1, 2026 and which, to the extent they apply, impose compliance obligations applicable to our business. Additional U.S. states are considering similar legislation, and there are ongoing discussions regarding a National Privacy Law. New laws similar to the GDPR and the CCPA are expected to be enacted in coming years in various countries and jurisdictions in which we operate.
In October 2017, the NAIC adopted the Insurance Data Security Model Law. The model law requires that, among other things, insurance companies establish a cybersecurity program and includes specific technical safeguards as well as requirements regarding governance, incident planning, data management, system testing, vendor oversight and regulator notification. The NY DFS adopted a regulation similar to the NAIC effective March 2017, and in November 2023, finalized amendments taking effect from December 2023 through November 2025 to expand their cybersecurity regulation, and include additional and new requirements regarding certification, governance, audit requirements, technology and business continuity, security control and training requirements, and notification obligations. More than 27 U.S. states have either enacted the NAIC Insurance Data Security Model Law or are anticipated to enact it or similar laws in the near future and we expect more states to follow. Such enactments, especially if inconsistent between states or with existing laws and regulations, could raise compliance costs or increase the risk of noncompliance, with the attendant risk of being subject to regulatory enforcement actions and penalties, as well as reputational harm. In February 2023, the NAIC released a draft updated model privacy law intended to replace the NAIC Insurance Information and Privacy Protection Model Act #670 and the Privacy of Consumer Financial and Health Information Regulation #672. However, after significant objections from stakeholders, the NAIC opted to abandon the draft new model law and instead turn its efforts to developing significant updates to existing Model Regulation #672.
The Company is monitoring regulatory guidance and rulemaking in these areas, and may be subject to increased compliance costs and regulatory requirements.
Artificial Intelligence
Regulatory standards relating to the use of artificial intelligence (“AI”) are evolving in the countries where we do business, and may increase risks associated with bias, unfair discrimination, transparency, and information security. For example, the E.U. is in the process of introducing new regulations applicable to certain AI technologies and to the data used to train, test and deploy them. U.S. state regulators have also shown increasing concern about the use of AI and the potential for discrimination and bias in insurance practices. In December 2023, the NAIC adopted the Use of Artificial Intelligence Systems by Insurers Model Bulletin with guidelines on how insurers can use AI and manage the risk of third-party vendors. The model bulletin has since been adopted in 23 states and the District of Columbia, and the NAIC has been considering drafting a new model law governing the use of AI. Other states have adopted their own guidance and regulations for the use of AI applicable to our business. For example, in July 2024, the New York Department of Financial Services adopted Insurance Circular Letter No. 7 Re: Use of Artificial Intelligence Systems and External Consumer Data and Information Sources in Insurance Underwriting and Pricing, which imposes obligations on insurers using AI or external consumer data and information sources. In May 2024, Colorado passed Senate Bill 24-205 (“the Colorado AI Law”), which became effective on February 1, 2026, regulates certain AI systems, and imposes obligations on AI system deployers and developers doing business in Colorado. The application of existing law and introduction of new or revised laws and regulations may require changes in our operations, increased compliance costs and reduce benefits from our adoption of artificial intelligence technologies.
Anti-Money Laundering And Anti-Bribery Laws
Our business is subject to various anti-money laundering and financial transparency laws and regulations that seek to promote cooperation among financial institutions, regulators and law enforcement entities in identifying parties that may be involved in terrorism or money laundering. In addition, under current U.S. law and regulations we may be prohibited from dealing with certain individuals or entities in certain circumstances and we may be required to monitor customer activities, which may affect our ability to attract and retain customers. We are also subject to various laws and regulations relating to corrupt and illegal payments to government officials and others, including the U.S. Foreign Corrupt Practices Act and the U.K.’s Anti-Bribery Law. The obligation of financial institutions, including the Company, to identify their clients, to monitor for and report suspicious transactions, to monitor dealings with government officials, to respond to requests for information by regulatory authorities and law enforcement agencies, and to share information with other financial institutions, has required the implementation and maintenance of internal practices, procedures and controls.
Unclaimed Property Laws
We are subject to the laws and regulations of states and other jurisdictions concerning the identification, reporting and escheatment of unclaimed or abandoned funds, and we are subject to audit and examination for compliance with these requirements.
Taxation
U.S. Taxation
Prudential Financial and certain domestic subsidiaries, including the Company, file a consolidated federal income tax return that includes both life insurance companies and non-life insurance companies. The principal differences between the Company’s actual income tax expense and the applicable statutory federal income tax rate are generally deductions for non-taxable investment income, including the Dividends Received Deduction (“DRD”) and certain tax credits. The applicable statutory federal income tax rate is 21%. A future increase in the applicable statutory federal income tax rate above 21% would adversely impact the Company's tax position. In addition, as discussed further below, the tax attributes of our products may impact both the Company’s and our customers’ tax positions. Also as discussed further below, new tax legislation and other potential changes to the tax law may impact the Company’s tax position and the attractiveness of our products.
36
The United States Tax Cuts and Jobs Act of 2017 ("Tax Act of 2017") changed the taxation of businesses and individuals by lowering tax rates and broadening the tax base through the acceleration of taxable income and the deferral or elimination of certain deductions, as well as changing the system of taxation of earnings of foreign subsidiaries. The most significant changes for the Company were: (1) the reduction of the corporate tax rate from 35% to 21%; (2) revised methodologies for determining deductions for tax reserves and the DRD; and (3) an increased capitalization and amortization period for acquisition costs related to certain products.
The Inflation Reduction Act of 2022 (the “Inflation Reduction Act”), among other provisions, imposes a 15% alternative minimum tax on corporations (“CAMT”) with average applicable financial statement income over $1 billion for any three-year period ending with 2022 or later. This provision is effective in taxable years beginning after December 31, 2022. On September 12, 2024, the U.S. Department of the Treasury and the Internal Revenue Service (IRS) issued proposed regulations providing guidance on the implementation of the CAMT. The proposed regulations address various aspects of the tax, including definitions, adjustments to financial statement income, and applicable reporting requirements. In June 2025, the IRS released further guidance for determining whether a corporation is subject to the CAMT. The Company will continue to monitor regulatory updates and assess their potential effects on our tax obligations. The impact of the alternative minimum tax, if any, will vary from year to year based on the relationship of our GAAP income to our taxable income. Prudential Financial and the controlled group of corporations of which the Company is a member has determined that it is an "applicable corporation" to determine if CAMT exceeds the regular federal income tax payable. Prudential Financial has amended its Tax Allocation Agreement, which covers all insurance companies within the US consolidated tax group, to allocate all impacts of the CAMT solely to Prudential Financial. Accordingly, none of the insurance companies in the Prudential Group will be subject to any CAMT impact for reporting purposes.
U.S. federal tax law generally permits tax deferral on the inside build-up of investment value of certain retirement savings, annuities and life insurance products until there is a contract distribution and, in general, excludes from taxation the death benefit paid under a life insurance contract. The Tax Act of 2017 did not change these rules, though it is possible that some individuals with overall lower effective tax rates could be less attracted to the tax deferral aspect of the Company’s products. The general reduction in individual tax rates and elimination of certain individual deductions may also impact the Company, depending on whether current and potential customers have more or less after-tax income to save for retirement and manage their mortality and longevity risk through the purchase of the Company’s products. Congress from time to time may enact other changes to the tax law that could make our products less attractive to consumers, including legislation that would modify the tax favored treatment of retirement savings, life insurance and annuities products. Such legislation could be in the form of a direct change to the tax favored aspects of life insurance, retirement savings or annuities, or an indirect change, such as a wealth tax or mark to market tax structure, which could make holding our products less attractive.
The products we sell have different tax characteristics and, in some cases, generate tax deductions and credits for the Company. Changes in either the U.S. or foreign tax laws may negatively impact the deductions and credits available to the Company, including the ability of the Company to claim foreign tax credits with respect to taxes withheld on our investments supporting separate account products. These changes would increase the Company’s actual tax expense and reduce its consolidated net income.
The profitability of any particular product is significantly dependent on the unique characteristics of the product and our ability to continue to generate taxable income, which is taken into consideration when pricing a product and is a component of our capital management strategies. Accordingly, changes in tax law, our ability to generate taxable income, or other factors impacting the availability or value of the tax characteristics generated by our products, could impact product pricing, increase our tax expense or require us to reduce our sales of these products or implement other actions that could be disruptive to our businesses.
International And Global Regulatory Initiatives
The Group of Twenty nations ("G20"), the Financial Stability Board ("FSB") and related bodies have developed proposals to address issues such as financial group supervision, capital and solvency standards, systemic risk, corporate governance including executive compensation, climate-related financial risks, and a host of related issues. The International Association of Insurance Supervisors ("IAIS"), the global standard setting body for the insurance sector contributes to the work of G20 and FSB through the development of standards that are intended to promote effective and globally consistent supervision and maintain fair, safe and stable insurance markets. As a standard setting body, the IAIS does not have direct authority to require insurance companies to comply with the standards it develops. However, the Company and its businesses could become subject to them if they were adopted by their respective regulators, which could impact the manner in which Prudential Financial deploys its capital, structures and manages its businesses, and otherwise operates both within the U.S. and abroad.
Risk Factors Related to Our Business
Our financial position and operating results are subject to certain risk factors discussed below. Many of these risks are interrelated and could occur under similar business and economic conditions, and the occurrence of certain of them may in turn cause the emergence or exacerbate the effect of others. Such a combination could materially increase the severity of the impact of these risks on our businesses, results of operations, financial condition and liquidity. You should take these risks into consideration when reviewing our financial statements and “Management’s Discussion and Analysis of Financial Condition and Results of Operations” later in this prospectus.
Overview
The Company uses an integrated risk management framework to manage and oversee its risks. The Company’s risks include investment, insurance, market, liquidity, operational, and model risk as well as strategic risks that may cause the Company’s core business model to change, either through a shift in the businesses in which it is engaged or a change in execution. The Company’s strategic risks include regulatory and technological changes and other external factors. The Company's risks are further discussed below.
37
Investment Risk
Our investment portfolios are subject to the risk of loss due to default or deterioration in credit quality or value.
We are exposed to investment risk through our investments, which primarily consist of public and private fixed maturity securities, commercial mortgage and other loans, equity securities and alternative assets including private equity, hedge funds and real estate. We are also exposed to investment risk through a potential counterparty default.
Investment risk may result from: (1) economic conditions; (2) adverse capital market conditions, including disruptions in individual market sectors or a lack of buyers in the marketplace; (3) volatility; (4) credit spread changes; (5) benchmark interest rate changes; and (6) declines in value of underlying collateral. These factors may impact the credit quality, liquidity and value of our investments and derivatives, potentially resulting in higher capital charges and unrealized or realized losses. Also, certain investments we hold, regardless of market conditions, are relatively illiquid and our ability to promptly sell these assets for their full value may be limited. Additionally, our valuation of investments may include methodologies, inputs and assumptions which could result in changes to investment valuations that may materially impact our results of operations or financial condition.
Our investment portfolio is subject to credit risk, which is the risk that an obligor (or guarantor) is unable or unwilling to meet its contractual payment obligations on its fixed maturity security, loan or other obligations. Credit risk may manifest in an idiosyncratic manner (i.e., specific to an individual borrower or industry) or through market-wide credit cycles. Financial deterioration of the obligor increases the risk of default and may increase the capital charges required under such regimes as the NAIC RBC, or other constructs to hold the investment and in turn, potentially limit our overall capital flexibility. Credit defaults (as well as credit impairments, realized losses on credit-related sales, and increases in credit related reserves) may result in losses which adversely impact earnings, capital and our ability to appropriately match our liabilities and meet future obligations.
Our Company is subject to counterparty risk, which is the risk that the counterparty to a transaction could default or deteriorate in creditworthiness before or at the final settlement of a transaction. In the normal course of business, we enter into financial contracts to manage risks (such as derivatives to manage market risk and reinsurance treaties to manage insurance risk), improve the return on investments (such as securities lending and repurchase transactions) and provide sources of liquidity or financing (such as credit agreements, securities lending agreements and repurchase agreements). Reinsurance treaties may also be used to further strategic goals of the Company by facilitating the acquisition or divestiture of a block of business if an entity purchase or sale is not practical. These transactions expose the Company to counterparty risk. Counterparties include commercial banks, investment banks, broker-dealers and insurance and reinsurance companies. In the event of a counterparty deterioration or default, the magnitude of the losses (e.g., replacement costs) will depend on current market conditions and the feasibility (dependent on the complexity) and time requirement of entering a replacement transaction with a new counterparty. Highly bespoke transactions (e.g., strategic reinsurance) may not be replicable with any degree of certainty, possibly causing us to recapture liabilities and reestablish or strengthen reserves and capital, which could reduce capital flexibility. Losses are likely to be higher under stressed conditions.
Our investment portfolio is subject to equity risk, which is the risk of loss due to deterioration in market value of public equity or alternative assets. We include public equity and alternative assets (including private equity, hedge funds and real estate) in our portfolio constructions, as these asset classes can provide returns over longer periods of time, aligning with the long-term nature of certain of our liabilities. Public equity and alternative assets have varying degrees of price transparency. Equities traded on stock exchanges (public equities) have significant price transparency, as transactions are often required to be disclosed publicly. Assets with less price transparency include private equity (joint ventures/limited partnerships) and direct real estate. As these investments typically do not trade on public markets and indications of realizable market value may not be readily available, valuations can be infrequent and/or more volatile. A sustained decline in public equity and alternative markets may reduce the returns earned by our investment portfolio through lower-than-expected dividend income, property operating income, and capital gains, thereby adversely impacting earnings, capital, and product pricing assumptions. These assets may also produce volatility in earnings as a result of uneven distributions on the underlying investments.
Insurance Risk
We have significant liabilities for contract owners' benefits which are subject to insurance risk. Insurance risk is the risk that actual experience deviates adversely from our insurance assumptions, including mortality, morbidity, and contract owner behavior assumptions. We provide a variety of insurance products, on both an individual and group basis, that are designed to help customers protect against a variety of financial uncertainties. Our insurance products protect customers against their potential risk of loss by transferring those risks to the Company, where those risks can be managed more efficiently through pooling and diversification over a larger number of independent exposures. During this transfer process, we assume the risk that actual losses experienced in our insurance products deviates significantly from what we expect. More specifically, insurance risk is concerned with the deviations that impact our future liabilities. Our profitability may decline if mortality experience, morbidity experience or contract owner behavior experience differ significantly from our expectations when we price our products. In addition, if we experience higher-than-expected surrenders, withdrawals or claims, our liquidity position may be adversely impacted, and we may incur losses on investments if we are required to sell assets in order to fund surrenders, withdrawals or claims. If it is necessary to sell assets at a loss, our results of operations and financial condition could be adversely impacted.
Certain of our insurance products are subject to mortality risk, which is the risk that actual deaths experienced deviate adversely from our expectations. Mortality risk is a biometric risk that can manifest in the following ways:
•Mortality calamity is the risk that mortality rates in a single year deviate adversely from what is expected as the result of pandemics, natural or man-made disasters, military actions or terrorism. A mortality calamity event will reduce our earnings and capital and we may be forced to liquidate assets before maturity in order to pay the excess claims. Mortality calamity risk is more pronounced in respect of specific geographic areas (including major metropolitan centers, where we have concentrations of customers, including under group and individual life insurance, concentrations of employees or significant
38
operations,) and in respect of countries and regions in which we operate that are subject to a greater potential threat of military action or conflict. Ultimate losses would depend on several factors, including the rates of mortality and morbidity among various segments of the insured population, the collectability of reinsurance, the possible macroeconomic effects on our investment portfolio, the effect on lapses and surrenders of existing contracts, as well as sales of new contracts and other variables.
•Mortality trend is the risk that mortality improvements in the future deviate adversely from what is expected. Mortality trend is a long-term risk that could emerge gradually over time. Longevity products, such as annuities, experience adverse impacts due to higher-than-expected mortality improvement. Mortality products, such as life insurance, experience adverse impacts due to lower-than-expected mortality improvement. If this risk were to emerge, the Company would update assumptions used to calculate reserves for in-force business, which may result in additional assets needed to meet the higher expected annuity claims or earlier expected life claims. An increase in reserves due to revised assumptions has an immediate impact on our results of operations and financial condition; however, economically the impact is generally long-term as the excess outflow is paid over time.
•Mortality base is the risk that actual base mortality deviates adversely from what is expected in pricing and valuing our products. Base mortality risk can arise from a lack of credible data on which to base the assumptions.
Certain of our insurance products are subject to contract owner behavior risk, which is the risk that actual contract owner behavior deviates adversely from what is expected.
•Lapse calamity is the risk that lapse rates over the short-term deviate adversely from what is expected, for example, surrenders of certain insurance products may increase following a downgrade of our financial strength ratings or adverse publicity. Only certain products are exposed to this risk. Products that offer a cash surrender value that resides in the general account, such as non-participating whole life products, could pose a potential short-term lapse calamity risk. Surrender of these products can impact liquidity, and it may be necessary in certain market conditions to sell assets to meet surrender demands. Lapse calamity can also impact our earnings and capital through its impact on estimated future profits.
•Contract owner behavior risk is the risk that the behavior of our customers or contract owners deviates adversely from what is expected. Contract owner behavior risk arises through product features which provide some degree of choice or flexibility for the contract owner, which can impact the amount and/or timing of claims. Such choices include surrender, lapse, partial withdrawal, contract loan, utilization, and premium payment rates for contracts with flexible premiums. While some behavior is driven by macro factors such as market movements, contract owner behavior at a fundamental level is driven primarily by contract owners’ individual needs, which may differ significantly from product to product depending on many factors including the features offered, the approach taken to market each product, and competitor pricing. For example, persistency (the probability that a contract will remain in force) within our annuities business may be significantly impacted by the value of guaranteed minimum benefits contained in many of our variable annuity products being higher than current account values in light of poor market performance as well as other factors. Many of our products also provide our customers with wide flexibility with respect to the amount and timing of premium deposits and the amount and timing of withdrawals from the contract’s value. Results may vary based on differences between actual and expected premium deposits and withdrawals for these products, especially if these product features are relatively new to the marketplace. The pricing of certain of our variable annuity products that contain certain living benefit guarantees is also based on assumptions about utilization rates, or the percentage of contracts that will utilize the benefit during the contract duration, including the timing of the first withdrawal. Results may vary based on differences between actual and expected benefit utilization. We may also be impacted by customers seeking to sell their benefits. In particular, the development of a secondary market for life insurance, including life settlements or “viaticals” and investor owned life insurance, and third-party investor strategies in our annuities business, could adversely affect the profitability of existing business and our pricing assumptions for new business. Contract owner behavior risk is generally a long-term risk that emerges over time. An increase in reserves due to revised assumptions has an immediate impact on our results of operations and financial condition; however, from an economic or cash flow perspective, the impact is generally long-term as the excess outflow is paid over time.
Our ability to reprice products is limited, and may not compensate for deviations from our expected insurance assumptions. Although some of our products permit us to increase premiums or adjust other charges and credits during the life of the contract, the adjustments permitted under the terms of the contracts may not be sufficient to maintain profitability or may cause the contract or contracts to lapse. Many of our products do not permit us to increase premiums or adjust other charges and credits or limit those adjustments during the life of the contract. Even if permitted under the contract, other factors may impact our decision whether to raise premiums or adjust other charges sufficiently, or at all. Accordingly, significant deviations in actual experience from our pricing assumptions could have an adverse effect on the profitability of our products.
We rely on data, technology, and intellectual property from third parties to administer our products, the unavailability or inaccuracy of which could disrupt our business. We use data, technology and intellectual property licensed from unaffiliated third parties in certain of our products and we may license additional third-party data, technology and intellectual property in the future. Any errors, delays or defects in this third-party data, technology and intellectual property could result in errors that could harm our brand and business. In addition, licensed data, technology and intellectual property may not continue to be available on commercially reasonable terms, or at all. If data providers were to terminate their relationship with us or experience operational disruptions, our ability to administer our products could be impacted. If a third party were to refuse to license its proprietary information to us on the same terms that it offers to our competitors or enter into exclusive contracts with our competitors, we could be at a competitive disadvantage. Disputes may arise between us and our licensors regarding the data, technology and intellectual property licensed to us under any license agreement, such as the scope of rights granted under the license, our compliance with our obligations under the license agreement, whether and the extent to which there has been infringement on intellectual property rights. Any of these could result in reputational and operational harm to our business.
39
Market Risk
The profitability of many of our insurance and annuity products are subject to market risk. Market risk is the risk of loss from changes in interest rates and equity prices.
The profitability of many of our insurance and annuity products depends in part on the value of the separate accounts supporting these products, which can fluctuate substantially depending on market conditions.
Derivative instruments that we use to hedge and manage interest rate and equity market risks associated with our products and businesses, and other risks might not perform as intended or expected resulting in higher-than-expected realized losses and stresses on liquidity and/or regulatory capital. Market conditions can limit availability of hedging instruments, require us to post additional collateral, and further increase the cost of executing product related hedges and such costs may not be recovered in the pricing of the underlying products being hedged.
Market risk may limit opportunities for investment of available funds at desired returns, including due to the prevailing interest rate environment, or other factors, with possible negative impacts on our overall results. Limited opportunities for attractive investments may lead to holding cash for long periods of time and an increased use of derivatives for duration management and other portfolio management purposes. The increased use of derivatives or portfolio rebalancing may increase the volatility of our U.S. GAAP results and our statutory capital.
Our investments, results of operations and financial condition may also be adversely affected by developments in the global economy, and in the U.S. economy (including as a result of an extended government shutdown, actions by the Federal Reserve with respect to interest rate and monetary policy, and adverse political developments). Global or U.S. economic activity and financial markets may in turn be negatively affected by adverse developments or conditions in specific geographical regions. In recent years, the financial markets have experienced periods of significant volatility and negative returns, contributing to an uncertain and evolving economic environment.
For a discussion of the impact of changes in market conditions on our financial condition see “Quantitative and Qualitative Disclosures About Market Risk" below.
Our insurance and annuity products, and our investment returns, are subject to interest rate risk, which is the risk of loss arising from asset/liability duration mismatches within our general account investments. The risk of mismatch in asset/liability duration is mainly driven by the specific dynamics of product liabilities. Some product liabilities are expected to have only modest risk related to interest rates because cash flows can be matched by available assets; however, other product liabilities generate long-term cash flows (i.e., 30 years or more), resulting in significant interest rate risk, since these cash flows cannot be matched by assets for sale in the marketplace, exposing the Company to future reinvestment risk. In addition, certain of our products provide for recurring premiums which may be invested at interest rates lower than the rates included in our pricing assumptions. Market-sensitive cash flows exist with other product liabilities including products whose cash flows can be linked to market performance through secondary guarantees, minimum crediting rates, and/or changes in insurance assumptions.
Our exposure to interest rates can manifest over years as in the case of earnings compression or in the short term by creating volatility in both earnings and capital. For example, some of our products expose us to the risk that changes in interest rates will reduce the spread between the amounts that we are required to pay under contracts and the rate of return we are able to earn on our general account investments supporting these contracts. When interest rates decline or remain low, we must invest in lower-yielding instruments, potentially reducing net investment income and constraining our ability to offer certain products. This risk is increased as more contract owners may retain their contracts in a low rate environment. Since many of our contracts have guaranteed minimum crediting rates or limit the resetting of crediting rates, the spreads could decrease or go negative.
Alternatively, when interest rates rise, we may not be able to replace the assets in our general account with the higher-yielding assets as quickly as needed to fund the higher crediting rates necessary to keep these products and contracts competitive. It is possible that fewer contract owners may retain their life and annuity contracts as they pursue higher crediting rates, which could expose the Company to losses and liquidity stress.
Our mitigation efforts with respect to interest rate risk are primarily focused on maintaining an investment portfolio with diversified maturities that has a key rate duration profile that is approximately equal to the key rate duration profile of our liability and surplus benchmarks; however, these benchmarks are based on estimates of the liability cash flow profiles which are complex and could be inaccurate, especially when markets are volatile. In addition, there are practical and capital market limitations on our ability to accomplish this matching. Due to these and other factors we may need to liquidate investments prior to maturity at a loss in order to satisfy liabilities or be forced to reinvest funds in a lower rate environment.
Guarantees within certain of our products, in particular our variable annuities and to a lesser extent certain individual life products, are market sensitive and may decrease our earnings or increase the volatility of our results of operations or financial position. Certain of our products, particularly our variable annuity products, include guarantees of minimum surrender values or income streams for stated periods or for life, which may be in excess of account values. Certain of our products, particularly our variable annuity and variable life products, include minimum death benefits or “no-lapse guarantees” that guarantee a death benefit as long as the “no-lapse guarantee” premium is paid. Certain of our products, particularly certain index-linked annuity and individual life products, include interest crediting guarantees based on the performance of an index. Downturns in equity markets, increased equity volatility, increased credit spreads, or (as discussed above) reduced interest rates could result in an increase in the valuation of liabilities associated with such guarantees, resulting in increases in reserves and reductions in net income. We use a variety of hedging and risk management strategies, including product features, to mitigate these risks in part and we may periodically change our strategies over time. These strategies may, however, not be fully effective. In addition, we may be unable or may choose not to fully hedge these risks. Hedging instruments may not effectively offset the costs of guarantees or may otherwise be insufficient in relation to our obligations. Hedging instruments also may not change in value correspondingly with associated liabilities due to equity market
40
or interest rate conditions, non-performance risk or other reasons. We may choose to hedge these risks on a basis that does not correspond to their anticipated or actual impact upon our results of operations or financial position under U.S. GAAP. Changes from period to period in the valuation of these contract benefits, and in the amount of our obligations effectively hedged, will result in volatility in our results of operations and financial position under U.S. GAAP and our statutory capital levels. Estimates and assumptions we make in connection with hedging activities may fail to reflect or correspond to our actual long-term exposure from our guarantees. Further, the risk of increases in the costs of our guarantees not covered by our hedging and other capital and risk management strategies may become more significant due to changes in contract owner behavior driven by market conditions or other factors. The above factors, individually or collectively, may have a material adverse effect on our results of operations, financial condition or liquidity.
Our valuation of the liabilities for the minimum benefits contained in many of our variable annuity products requires us to consider the market perception of our risk of non-performance, and a decrease in our own credit spreads resulting from ratings upgrades or other events or market conditions could cause the recorded value of these liabilities to increase, which in turn could adversely affect our results of operations and financial position.
We are subject to counterparty risk associated with reinsurance transactions. To mitigate this risk, we may use coinsurance with funds withheld or modified coinsurance. With these reinsurance arrangements, we retain assets on our balance sheet whose related investment performance accrues to third-party reinsurers. The composition of these assets is subject to investment guidelines specific to the reinsurance treaties and may differ from those in which we would normally invest. Under GAAP, funds withheld and modified coinsurance reinsurance most often create embedded derivatives for the ceding company and the reinsurer, which are measured at fair value. The valuation of these embedded derivatives is sensitive to market factors, including credit spreads of the assets held by the ceding insurer, and can generate significant volatility in net income depending on market conditions. Changes in the fair value of embedded derivatives are included in “Realized investment gains (losses), net” on the Consolidated Statements of Operations, whereas changes in the fair value of assets are recorded primarily in “Accumulated other comprehensive income.”
Liquidity Risk
As a financial services company, we are exposed to liquidity risk, which is the risk that the Company is unable to meet near-term obligations as they come due.
Liquidity risk is a manifestation of events that are driven by other risk types (market, insurance, investment, operational). A liquidity shortfall may arise in the event of insufficient funding sources or an immediate and significant need for cash or collateral. In addition, it is possible that expected liquidity sources may be unavailable or inadequate to satisfy the liquidity demands described below.
The Company has four primary sources of liquidity exposure and associated drivers that trigger material liquidity demand. Those sources are:
•Derivative collateral market exposure: Abrupt changes to interest rate, equity, and/or currency markets may increase collateral requirements to counterparties and create liquidity risk for the Company.
•Asset liability mismatch: There are liquidity risks associated with liabilities coming due prior to the matching asset cash flows. Structural maturities mismatch can occur in activities such as securities lending, where the liabilities are effectively overnight open transactions used to fund longer term assets.
•Wholesale funding: We depend upon the financial markets for funding. These sources might not be available during times of stress, or may only be available on unfavorable terms, which can result in a decrease in our profitability and a significant reduction in our financial flexibility.
•Insurance cash flows: We face potential liquidity risks from unexpected cash demands due to severe mortality calamity, customer withdrawals or lapse events. If such events were to occur, the Company may face unexpectedly high levels of claim payments to contract owners.
Operational Risk
Our operations are exposed to the risk of loss resulting from inadequate or failed processes or systems, human error or misconduct, and as a result of external events.
An operational risk failure may result in one or more actual or potential impacts to the Company. Operational risk may be elevated as a result of significant changes to how the Company operates, including organizational changes and transformation efforts underway that increase execution risk.
Operational Risk Types
•People – Internal fraud, breaches of employment law, unauthorized activities; loss or lack of key personnel, inadequate training; inadequate supervision.
•Processes – Processing failure; failure to safeguard or retain documents/records; errors in valuation/pricing models and processes; project management or execution failures; improper sales practices; improper administration of our products.
•Technology – Failures during the development and implementation of new systems; systems failures.
•External Events – External crime; cyber-attack; outsourcing risk; vendor risk; natural and other disasters; changes in laws/regulations.
•Legal and Regulatory – Legal and regulatory compliance failures.
Potential Impacts
•Financial losses – The Company experiences a financial loss. This loss may originate from various causes including, but not limited to, transaction processing errors and fraud.
41
•Client service impacts – The Company may not be able to service customers. This may result if the Company is unable to continue operations during a business continuation event or if systems are compromised due to malware or virus.
•Regulatory fines or sanctions – When the Company fails to comply with applicable laws or regulations, regulatory fines or sanctions may be imposed. In addition, possible restrictions on business activities may result.
•Legal actions – Failure to comply with laws and regulations also exposes the Company to litigation risk. This may also result in financial losses.
•Reputational harm – Failure to meet regulator, customer, investor and other stakeholder expectations may cause reputational harm.
Key Enterprise Operational Risks — Key enterprise operational risks include, among others, the following:
We are subject to business continuation risk, which is the risk that our operations, systems or data, or those of third- parties on whom we rely, may be disrupted. We may experience a disruption in business continuity as a result of, among other things, the following:
•Severe pandemic, epidemic, or other public health crises, either naturally occurring or resulting from intentionally manipulated pathogens;
•Geo-political risks, including armed conflict and civil unrest;
•Terrorist events;
•Significant natural or accidental disasters;
•Cyber-attacks, both systemic (e.g., affecting the internet, cloud services, and/or other financial services industry infrastructure) and targeted (e.g., failures in or breach of our systems or that of third-parties on whom we rely);
•Insider threats;
•Physical infrastructure outages; and
•Workforce unavailability resulting from any of the above events, among others.
We depend heavily on our telecommunication, information technology and other operational systems and on the integrity and continuing availability of data we use to run our businesses and service our customers. These systems, and any available backups, may fail to operate properly or become disabled as a result of events or circumstances wholly or partly beyond our control.
Further, we face the risk of operational and technology failures experienced by others, including clearing agents, exchanges and other financial intermediaries and vendors and other third-parties to which we outsource the provision of services or business operations.
We, or third-parties on whom we rely, may not adequately maintain information security. There continues to be significant and increased cyber-attack activity against businesses, including but not limited to Prudential and others in the financial services sector and no organization, regardless of measures implemented to safeguard the systems and detect threats, is fully immune to cyber-attacks. Our cybersecurity risk remains heightened because of, among other things, the rapidly evolving nature and pervasiveness of cyber threats, our brand and reputation, our size and scale, our geographic presence and our role in the financial services industry and the broader economy. Risks related to cyber-attack arise in various areas, including:
•Protecting sensitive information is a constant need; however, some risks cannot be fully mitigated using administrative, technological, or physical controls, or otherwise.
•Employees, customers, third-party service providers on whom we rely, or other users of our systems continue to be a key avenue for malicious external parties to gain access to our network, systems, data, or that of our customers. Many attacks leverage social engineering schemes (such as phishing, vishing, or smishing) to coax an internal user to click on a malicious attachment or link to introduce malware into companies’ systems or steal the user’s username and password. Such social engineering schemes are becoming increasingly sophisticated and may involve emerging technologies such as deepfakes. Senior-level executives are increasingly becoming the targets of such attacks. Fraudulent schemes to solicit information via call centers, remote help desks and interactive voice response systems continue to increase in both volume and sophistication.
•Cyber-attacks involving the encryption and/or threat to disclose personal or confidential information (i.e., ransomware) or disruptions of communications (i.e., denial of service) for the purposes of, among other things, extortion or other motives persist and are on the rise.
•Financial services companies and their third-party service providers (including their downstream service providers) are increasingly being targeted by hackers and fraudulent actors seeking to monetize personal or confidential information to extort money, or for other malicious purposes. Such campaigns have targeted online applications and services.
•Rapidly-evolving artificial intelligence technologies have been leveraged by threat actors to make cyber-attacks more effective and efficient.
•Nation-state sponsored or affiliated organizations, or politically motivated actors, are engaged in cyber-attacks, not only for monetization purposes, but also to gain information about foreign citizens, businesses and governments, or to influence or cause disruptions in commerce or political affairs. In light of recent geopolitical events, including conflicts in Europe and the Middle East, state-sponsored or affiliated parties and/or their supporters may launch retaliatory cyber-attacks, and may attempt to cause supply chain and other third-party service provider disruptions, or take other geopolitically motivated retaliatory actions that may disrupt our business operations, and/or result in the compromise of our systems or data.
•Increasingly, malicious actors can be in companies’ systems for an extended period of time before being detected. Even if the malicious actors are discovered quickly, it could take considerable additional time for us to determine the scope of
42
compromise, and the extent, amount, and type of information compromised, if any, and to fully contain the malicious actors, remediate and recover.
•Employees, third-party service providers or other individuals purportedly acting on behalf of the Company may fail (as a result of human error or misconduct) to comply with applicable policies and procedures, and/or circumvent controls or safeguards for unauthorized purposes. Our increased adoption of remote working increases these risks, as our interaction with employees and external service providers occur on information systems, networks and environments over which we have less control and which may be more difficult to monitor.
•We rely on third-parties to provide services, as described further below. While we maintain certain standards for all vendors that provide us services, our vendors, and in turn, their own service providers, have become subject to security breaches, including as a result of their failure to perform in accordance with their contractual obligations.
•Hardware, software or applications developed by, obtained from, or implemented in accordance with specifications provided by third-parties may contain vulnerabilities in design, maintenance or manufacturing that could be exploited to compromise the Company’s information security.
•Continuing use of remote or flexible work arrangements, including remote access tools and mobile technology (including use of personal devices), have expanded potential attack surfaces.
•The proliferation of third-party financial data aggregators and emerging technologies, including the development and use of artificial intelligence, increase our information security risks and exposure.
The development and adoption of artificial intelligence ("AI"), including generative artificial intelligence (“Generative AI”), and its use and anticipated use by us or by third-parties on whom we rely, may increase the operational risks discussed above or create new operational risks that we are not currently anticipating. AI technologies offer potential benefits in areas such as customer service personalization and process automation, and we expect to use AI and Generative AI to help deliver products and services and support critical functions. We also expect third-parties on whom we rely to do the same. There are significant risks involved in developing and deploying AI and there can be no assurance that the usage of AI will enhance our products or services or be beneficial to our business, including our efficiency or profitability. AI and Generative AI may be misused by us or by such third-parties, and that risk is increased by the relative newness of the technology, the speed at which it is being adopted, and the lack of laws, regulations or standards governing its use. Such misuse could expose the Company to legal or regulatory risk, damage customer relationships or cause reputational harm. Further, our ability to continue to develop and efficiently deploy AI technologies depends on access to specific third-party equipment and other physical infrastructure, such as processing hardware and network capacity, as to which we cannot control the availability or pricing, especially in a highly competitive environment. Our competitors may also adopt AI or Generative AI more quickly or more effectively than we do, which could cause competitive harm. Because the Generative AI technology is so new, some of the potential risks of Generative AI are currently unknowable, however, specific risks relating to AI and Generative AI could include, among others:
•Reputational Damage: Malicious actors could use AI to create deepfakes of the Company's executives or manipulate financial documents, leading to loss of customer trust and significant reputational damage. Moreover, the use of AI trained on inaccurate data sets could result in inaccurate or biased decisions. In addition, public and regulatory focus on ethical use and data privacy concerns regarding AI could result in reputational damage if we fail, or are perceived to fail, to align with societal expectations or regulatory standards relating to the use of AI.
•Fraudulent Activity: AI could be used to create forged documents or impersonate individuals to commit financial fraud, leading to financial losses and regulatory scrutiny.
•Misinformation and Disinformation: The ability to generate realistic and convincing synthetic media could be used to spread misinformation and disinformation, impacting public opinion and undermining trust in the financial system.
•Privacy Concerns: AI could be used to create synthetic identities or manipulate personal data, raising privacy concerns related to data breaches and other potential violations of consumer rights and data protection regulations.
•Cybersecurity Threats: AI could be used to create sophisticated phishing attacks or bypass security measures, increasing the risk of cyberattacks and data breaches.
We, or third-parties on whom we rely, may not adequately ensure the integrity, confidentiality, or availability of personal and confidential information. In the course of our ordinary business, we collect, store and disclose to various third-parties (e.g., service providers, reinsurers, etc.) substantial amounts of personal and confidential information, including in some instances sensitive personal information, including health-related information. We are subject to the risk that the integrity, confidentiality, or availability of this information may be compromised, including as a result of an information security breach described above, or that such events occurring at third-parties may not be disclosed to us in a timely manner. And we may have insufficient recourse against such third-parties from which such breaches originate. We have experienced cybersecurity events resulting in, among other things the compromise of personal and confidential information, including sensitive health information, of our customers and other stakeholders.
We may incur significant costs and other negative consequences resulting from cyber-attacks or other information security breaches. Any compromise or perceived compromise of the security of our systems or data or that of one of our vendors could damage our reputation, cause the deterioration or termination of relationships with among others, customers, distributors, government-run health insurance exchanges, marketing partners and insurance carriers, reduce demand for our services, result in the loss of business opportunities, and subject us to significant liability and expense as well as regulatory action, penalties and lawsuits, which would harm our business, operating results and financial condition. We may also incur significant costs in connection with our response, recovery, remediation, modification of protective measures, and compliance efforts, including costs associated with mitigating the impact of any errors, interruptions, delays or cessations of service. Additionally, our failure to timely or accurately
43
communicate cyber incidents to relevant parties could result in regulatory, operational and reputational risk. To the extent we maintain cyber insurance, liabilities or losses arising from certain cyber incidents may not be covered or fully covered under such policies, including if our insurer denies coverage as to any particular claim in the future, and may not take into account reputational damage, the costs of which are impossible to quantify, and the amount of insurance may not be adequate. In addition, our insurance coverage with respect to cyber incidents may increase in cost or cease to be available on commercially reasonable terms, or at all, in the future.
Third-parties (outsourcing providers, vendors and suppliers and joint venture partners) present added operational risk to our enterprise. The Company's business model relies heavily on the use of third-parties to deliver contracted services in a broad range of areas. This presents the risk that the Company is unable to meet legal, regulatory, financial or customer obligations because third-parties fail to deliver contracted services, or that the Company is exposed to reputational damage because third-parties operate in a poorly controlled manner. We use affiliates and third-party vendors located outside the U.S. to provide certain services and functions, which also exposes us to business disruptions and political risks as a result of risks inherent in conducting business outside of the United States. In our investments in which we hold a minority interest, or that are managed by third-parties, we lack management and operational control over operations, which may subject us to additional operational, compliance and legal risks and prevent us from taking or causing to be taken actions to protect or increase the value of those investments. In those jurisdictions where we are constrained by law from owning a majority interest in jointly owned operations, our remedies in the event of a breach by a joint venture partner may be limited (e.g., we may have no ability to exercise a “call” option).
Affiliate and third-party distributors of our products present added regulatory, competitive and other risks to our enterprise. Our products are sold primarily through captive/affiliated distributors and third-party distributing firms. Our captive/affiliated distributors are made up of sales personnel who are generally compensated based on commissions. The third-party distributing firms are rarely dedicated to us exclusively and may frequently recommend and/or market products of our competitors. Accordingly, we must compete for their services. Our sales could be adversely affected if we are unable to attract, retain or motivate third-party distributing firms or if we do not adequately provide support, training, compensation, and education to this sales network regarding our products, or if our products are not competitive and not appropriately aligned with consumer needs. While third-party distributing firms have an independent regulatory accountability, regulators have been clear with expectations that product manufacturers retain significant sales practices accountability.
The Company and our distributors are subject to rules regarding the standard of care applicable to sales of our products and the provision of advice to our customers, and in recent years many of these rules have been revised or re-examined. In addition, there have been a number of investigations regarding the marketing practices of brokers and agents selling annuity and insurance products and the payments they receive. Furthermore, sales practices and investor protection have increasingly become areas of focus in regulatory examinations. These investigations and examinations have resulted in enforcement actions against us and companies in our industry and brokers and agents marketing and selling those companies’ products. Enforcement actions could result in penalties and the imposition of corrective action plans and/or changes to industry practices, which could adversely affect our ability to market our products. If our products are distributed in an inappropriate manner, or to customers for whom they are unsuitable, or distributors of our products otherwise engage in misconduct, we may suffer reputational and other harm to our business and be subject to regulatory action, penalties or damages. Our business may also be harmed if captive/affiliate distributors engage in inappropriate conduct in connection with the sale of third-party products.
Many of our distribution personnel are independent contractors or franchisees. From time to time, their status has been challenged in courts and by government agencies, and various legislative or regulatory proposals have been introduced addressing the criteria for determining the status of independent contractors’ classification as employees for, among other things, employment tax purposes or other employment benefits. The costs associated with potential changes with respect to these independent contractor and franchisee classifications have impacted our results previously and could have a material adverse effect on our business in the future.
Although we distribute our products through a wide variety of distribution channels, we do maintain relationships with certain key distributors. We periodically negotiate the terms of these relationships, and there can be no assurance that such terms will remain acceptable to us or such third-parties. An interruption in certain key relationships could materially affect our ability to market our products and could have a material adverse effect on our business, operating results and financial condition. Distributors may elect to reduce or terminate their distribution relationships with us, including for such reasons as adverse developments in our business, competitiveness of product offerings, adverse rating agency actions or concerns about market-related risks. We are also at risk that key distribution partners may merge, change their business models in ways that affect how our products are sold, or terminate their distribution contracts with us, or that new distribution channels could emerge and adversely impact the effectiveness of our distribution efforts. An increase in bank and broker-dealer consolidation activity could increase competition for access to distributors, result in greater distribution expenses and impair our ability to market products through these channels. Consolidation of distributors and/or other industry changes may also increase the likelihood that distributors will try to renegotiate the terms of any existing selling agreements to terms less favorable to us. Finally, we also may be challenged by new technologies and marketplace entrants that could interfere with our existing relationships.
Model Risk
As a financial services company, we are exposed to model risk, which is the risk of financial loss or reputational damage or adverse regulatory impacts caused by model errors or limitations, incorrect implementation of models, or misuse of or overreliance upon models. Models are utilized by our businesses and corporate areas primarily to project future cash flows associated with pricing products, calculating reserves and valuing assets, as well as in evaluating risk and determining capital requirements, among other uses. Because models are used across the Company, model risk impacts all risk types. As our businesses continue to grow and evolve, the number and complexity of models we utilize expands, increasing our exposure to error in the design, implementation or use of models, including the associated input data and assumptions. Furthermore, model risk will be elevated during periods of transformation or due to new or changing laws or regulations.
44
Strategic Risk
We are subject to the risk of events that can cause our fundamental business model to change, either through a shift in the businesses in which we are engaged or a change in our execution. In addition, other risks may become strategic risks. For example, we have considered and must continue to consider the impact of the interest rate environment on new product development and continued sales of interest sensitive products.
Changes in the regulatory landscape may be unsettling to our business model. New laws and regulations are being considered in the U.S. and our other countries of operation at an increasing pace, as there has been greater scrutiny on financial regulation over the past several years. In addition, changes in policies under presidential executive orders have raised significant legal, regulatory and tax uncertainties. Proposed or unforeseen changes in law or regulation, or changes in the way existing laws or regulations are interpreted or enforced, may adversely impact our business. See “Regulation” for a discussion of certain recently enacted and pending proposals by international, federal and state regulatory authorities and their potential impact on our business, including in the following areas:
•Financial sector regulatory reform.
•U.S. federal, state and local tax laws, including CAMT.
•U.S. federal securities laws.
•Fiduciary rules and other standards of care.
•Our regulation under U.S. state insurance laws and developments regarding group-wide supervision and capital standards, accounting rules, RBC factors for invested assets and reserves for life insurance, variable annuities and other products.
•Privacy, data, artificial intelligence and cybersecurity regulation.
Changes in accounting rules applicable to our business may also have an adverse impact on our results of operations or financial condition. For a discussion of accounting pronouncements and their potential impact on our business, see “Management’s Discussion and Analysis of Financial Condition and Results of Operations.”
Changes in technology and other external factors may be unsettling to our business model. We believe the following aspects of technological and other changes would significantly impact our business model. There may be other unforeseen changes in technology and the external environment, including the regulatory response to technological change, which may have a significant impact on our business model.
•Interaction with customers. Technology is moving rapidly and as it does, it puts pressure on existing business models. Some of the changes we can anticipate are increased choices about how customers want to interact with the Company or how they want the Company to interact with them. Evolving customer preferences and changing privacy regulations may drive a need to redesign products and change the way we interact with customers. Our distribution channels may change to become more automated, at the place and time of the customer’s choosing. Such changes clearly have the potential to disrupt our business model.
•Investment Portfolio. Technology may have a significant impact on the companies in which the Company invests. For example, environmental concerns spur scientific inquiry which may reposition the relative attractiveness of wind or sun power over oil and gas. The transportation industry may favor alternative modes of conveyance of goods which may shift trucking or air transport out of favor. Consumers may change their purchasing behavior to favor online activity which would change the role of malls and retail properties.
•Medical Advances. The Company is exposed to the impact of medical advances. The unequal availability of detailed information (e.g., genetic testing) to consumers and insurers can create asymmetrical information and create anti-selection risks. Also, technologies that extend lives will challenge our actuarial assumptions particularly related to mortality and longevity risk.
The following items are examples of other factors which could have a meaningful impact on our business.
•A downgrade in our financial strength or credit ratings could potentially, among other things, adversely impact our business prospects, results of operations, financial condition and liquidity. We cannot predict what additional actions rating agencies may take, or what actions we may take in response to the actions of rating agencies, which could adversely affect our business. Our ratings could be downgraded at any time and without notice by any rating agency. Credit rating agencies continually review their methodologies, including capital and earnings assessment models, as well as their ratings for the companies that they follow, including us. The credit rating agencies also evaluate the industry as a whole and may change our credit rating based on their overall view of our industry. In addition, a sovereign downgrade could result in a downgrade of Pruco Life.
•The changing competitive landscape may adversely affect the Company. In our business we face intense competition from insurance companies and diversified financial institutions, both for the ultimate customers for our products and, in many businesses, for distribution through non-affiliated distribution channels. Technological advances, changing customer expectations, including related to digital offerings, access to customer data or other changes in the marketplace may present opportunities for new or smaller companies without established products or distribution channels to meet consumers’ increased expectations more efficiently than us. Fintech and insurtech companies and companies in other industries with greater access to customers and data have the potential to disrupt industries globally, and many participants have been partially funded by industry players.
•Climate change may increase the severity and frequency of calamities, or adversely affect our investment portfolio or investor sentiment. Climate change may increase the frequency and severity of weather-related disasters and pandemics. In addition, climate change regulation may affect the prospects of companies and other entities whose securities we hold, or our
45
willingness to continue to hold their securities. It may also impact other counterparties, including reinsurers, and affect the value of investments. We cannot predict the long-term impacts on us from climate change or related regulation. Climate change may also influence investor sentiment with respect to the Company and investments in our portfolio.
•We may fail to meet expectations relating to environmental, social, and governance standards and practices. Certain existing or potential investors, customers and regulators evaluate our business or other practices according to a variety of environmental, social and governance (“ESG”) standards and expectations. Certain of our regulators have proposed or adopted, or may propose or adopt, ESG rules or standards that would apply to our business. Our practices may be judged by ESG standards that are continually evolving and not always clear. Prevailing ESG standards and expectations may also reflect contrasting or conflicting values or agendas. We may fail to meet our commitments or targets, and our policies and processes to evaluate and manage ESG standards in coordination with other business priorities may not be completely effective or satisfy investors, customers, regulators, or others. We may face adverse regulatory, investor, customer, media, or public scrutiny leading to business, reputational, or legal challenges.
•Market conditions and other factors may adversely impact product sales or increase expenses. Examples include:
◦A change in market conditions, such as higher inflation and higher interest rates, could cause a change in consumer sentiment and behavior adversely affecting sales and persistency of our savings and protection products. Conversely, low inflation and low interest rates could cause persistency of these products to vary from that anticipated and adversely affect profitability. Similarly, changing economic conditions and unfavorable public perception of financial institutions can influence customer behavior, including increasing claims or surrenders in certain products.
◦Lapses and surrenders of certain insurance products may increase if a market downturn, increased market volatility or other market conditions result in customers becoming dissatisfied with their investments or products.
•Our reputation may be adversely impacted if any of the risks described in this section are realized. Reputational risk could manifest from any of the risks as identified in the Company’s risk identification process. Failure to effectively manage risks across a broad range of risk issues exposes the Company to reputational harm. If the Company were to suffer a significant loss in reputation, both contract owners and counterparties could seek to exit existing relationships. Additionally, large changes in credit worthiness, especially credit ratings, could impact access to funding markets while creating additional collateral requirements for existing relationships. The mismanagement of any such risks may potentially damage our reputational asset. Our business is anchored in the strength of our brand, our alignment to our values, and our proven commitment to keep our promises to our customers. Any negative public perception, founded or otherwise, can be widely and rapidly shared over social media or other means, and could cause damage to our reputation.
•Prudential Financial may be unable to attract and retain key personnel. Prudential Financial provides us with personnel pursuant to an expense charge and allocation agreement. Strong competition exists for qualified personnel with demonstrated abilities. If Prudential Financial is unable to attract and retain key personnel, our financial results and ability to compete could be adversely affected.
Directors and Executive Officers
The directors and executive officers of Pruco Life are as follows:
| Name | Age (as of 5/1/2026) | Position | ||||||
| Reshma V. Abraham | 47 | Director and Vice President | ||||||
| Markus Coombs | 50 | Director, Vice President, Chief Financial Officer, and Chief Accounting Officer | ||||||
| Alan M. Finkelstein | 55 | Director and Treasurer | ||||||
| Scott E. Gaul | 50 | Director, President, and Chief Executive Officer | ||||||
| Bradley O. Harris | 56 | Director | ||||||
| Salene Hitchcock-Gear | 62 | Director | ||||||
| Karen M. Sills | 44 | Vice President, Chief Legal Officer, and Secretary | ||||||
| Matthew Silver | 42 | Senior Vice President, Chief Actuary and Appointed Actuary | ||||||
Reshma V. Abraham has served as Director since April 1, 2025, and Vice President since March 19, 2025. She has been employed by Prudential Financial since November 2014 and currently holds the title of Vice President, Finance. Previously, she served as Vice President, Actuary of New York Life from May 2009 to November 2014, and Associate Actuary of AXA Equitable from August 2000 to May 2009. She received her B.S. degree from Tufts University. She brings to the board vast finance and actuarial experience, qualifications and skills that led to selection for the board.
Markus Coombs has served as Director since February 19, 2020, Vice President since March 4, 2020, and Chief Accounting Officer and Chief Financial Officer since April 1, 2025. He has been employed by Prudential Financial since January 2016 and currently holds the title of Vice President, Finance. Previously, he served as Senior Vice President of AIG from February 2013 to January 2016, Actuary of AXA Equitable from June 2007 to February 2013, and Actuary of Axa Life UK from June 2001 to June 2007. He received his B.S.C. degree from University of Southampton, U.K. He brings to the board vast finance and actuarial experience, qualifications and skills that led to selection for the board.
46
Alan M. Finkelstein has served as Director and Treasurer since June 19, 2023. He has been employed by Prudential Financial since June 2014 and currently holds the title of Senior Vice President, Corporate Treasurer and Head of Stakeholder Relations. Previously, he served as Managing Director of Evercore Partners from September 2011 to May 2014 and Managing Director at Macquarie Group from April 2003 to June 2011. He received his B.B.A. degree from University of Wisconsin. He brings to the board vast treasury and accounting experience, qualifications and skills that led to selection for the board.
Scott E. Gaul has served as Director since June 1, 2023, and President and Chief Executive Officer since February 2, 2026. He has been employed by Prudential Financial since April 1997 and currently holds the title of Vice President, Investment and Pension Solutions. He received his B.S. degree from Penn State. He brings to the board vast finance and actuarial experience, qualifications and skills that led to selection for the board.
Bradley O. Harris has served as Director since September 29, 2023. He has been employed by Prudential Financial since May 2023 and currently holds the title of Senior Vice President and Chief Actuary. Previously, he served as Executive Vice President and Chief Risk Officer of Jackson Financial from December 2015 to May 2023, held various positions, including Chief Actuary, of Prudential Corporation Asia from February 2007 to November 2015, and held various positions, including Vice President, A&H Profit Center Manager, of AIG American General from December 2001 to January 2007. He received his B.S. degree from University of Kentucky. He brings to the board vast actuarial experience, qualifications and skills that led to selection for the board.
Salene Hitchcock-Gear has served as Director since July 25, 2018. She has been employed by Prudential Financial since June 2017 and currently holds the title of Senior Vice President, Individual Life Insurance. Previously, she served as President and CEO of Ameritas Investment Corp. from February 2003 to May 2017, President and CEO of Acacia Insurance Company from April 2008 to June 2013, and President and CEO of The Advisors Group from March 2000 to February 2003. She received her B.A. degree from University of Michigan, and her J.D. degree from New York University School of Law. She brings to the board vast finance and business leadership experience, qualifications and skills that led to selection for the board.
Karen M. Sills has served as Chief Legal Officer, Vice President and Secretary since April 13, 2026. She has been employed by Prudential Financial since August 2011 and currently holds the title of Vice President, Corporate Counsel. Previously, she served as Director/AVP, Corporate Counsel of Massachusetts Mutual Life Ins. Co. from June 2006 to July 2011. She received her A.B. degree from Princeton University and her J.D. degree from University of CT School of Law.
Matthew Silver has served as Appointed Actuary since December 5, 2022, and Chief Actuary and Senior Vice President since December 11, 2023. He has been employed by Prudential Financial since May 2006 and currently holds the title of Vice President, Actuary. He received his B.S. degree from Virginia Tech.
Compensation Of Directors And Executive Officers
We do not have any employees. Our parent company, Prudential Financial, provides us with personnel, including our executive officers, pursuant to an expense charge and allocation agreement. Accordingly, we do not determine or pay any compensation to our executive officers. Prudential Financial determines and pays the salaries, bonuses, and other compensation earned by our executive officers, including any employee benefit plans, retirement benefits, or perquisites.
Our directors are also employees of Prudential Financial. They do not receive any separate compensation for their services as directors. None of our directors qualify as an independent director under the independence standards of the NYSE.
Security Ownership of Certain Beneficial Owners and Management
We are a wholly owned subsidiary of Prudential Insurance, which in turn is a direct wholly owned subsidiary of Prudential Financial. None of our directors or executive officers beneficially owns shares of the Company’s voting securities.
Related Person Transactions
Our transactions with related parties are governed by the written Related Person Transaction Policy adopted by the Company. Related person transactions include any transaction, arrangement or relationship or series of similar transactions, arrangements or relationships in which (1) the amount involved exceeds $120,000, (2) Pruco Life (including any of its subsidiaries) is, was or will be a participant and (3) any Related Person had, has or will have a direct or indirect material interest. A Related Person is any (a) person who is or was in the prior year a director, or nominee for election as a director, or executive officer of Pruco Life or any of its affiliates, (b) greater than 5% beneficial owner of Pruco Life or any of its affiliates, (c) immediate family member of any of the foregoing, or (d) any firm, corporation or other entity in which any of the foregoing persons is employed or is a general partner or principal or in a similar position or in which such person has a 10% or greater beneficial ownership interest. In the ordinary course of our business, we enter into various transactions with related parties and expect to continue doing so in the future.
Related Person Transactions – Policies
Pruco Life’s Related Person Transaction Policy sets forth policies and procedures for the review, approval, ratification and disclosure of Related Person Transactions. Prior to entering into any Related Person Transaction, (a) the Related Person, (b) the director, executive officer, nominee or beneficial owner who is an immediate family member of the Related Person, or (c) other officer responsible for the potential Related Person Transaction shall provide notice to the Audit Committee of the facts and circumstances of the proposed Related Person Transaction.
Such notice shall include (i) the Related Person’s relationship to the Company and interest in the transaction; (ii) the material facts of the proposed Related Person Transaction, including the proposed aggregate value of such transaction or, in the case of indebtedness, the amount of principal and interest that would be involved and other principal terms of such indebtedness; (iii) the expected benefits to the Company of the proposed Related Person Transaction; (iv) if applicable, the availability of other sources of comparable
47
products or services; and (v) an assessment of whether the proposed Related Person Transaction is on terms that are comparable to the terms available to an unrelated third party or to employees generally.
The Audit Committee shall approve only those Related Person Transactions that are in, or are not inconsistent with, the best interests of the Company, as the Audit Committee determines in good faith. The Audit Committee may seek bids, quotes or independent valuations from third parties in connection with assessing any Related Person Transaction. No member of the Audit Committee shall participate in any review, consideration, approval or ratification of any Related Person Transaction with respect to which such member or any of his or her immediate family members is the Related Person.
From time to time, the Audit Committee shall review any previously approved or ratified Related Person Transactions that remain ongoing and have a remaining term of more than six months or remaining amounts payable to or receivable from the Company. Based on all relevant facts and circumstances, taking into consideration the Company’s contractual obligations, the Audit Committee shall determine if it is in the best interests of the Company and its stockholders to continue, modify or terminate the Related Person Transaction.
Current Related Party Transactions
As a wholly owned subsidiary of Prudential Insurance, Pruco Life enters into various transactions with Prudential Insurance and other affiliates in the normal course of business, including among others, service agreements, reinsurance transactions, and financing arrangements. See Note 16 to the Consolidated Financial Statements included in this prospectus for additional information.
FINANCIAL INFORMATION
FORWARD-LOOKING STATEMENTS
Certain of the statements included in this prospectus constitute forward-looking statements within the meaning of the U.S. Private Securities Litigation Reform Act of 1995. Words such as “expects,” “believes,” “anticipates,” “includes,” “plans,” “assumes,” “estimates,” “projects,” “intends,” “should,” “will,” “shall” or variations of such words are generally part of forward-looking statements. Forward-looking statements are made based on management’s current expectations and beliefs concerning future developments and their potential effects upon Pruco Life Insurance Company and its subsidiaries. There can be no assurance that future developments affecting Pruco Life Insurance Company and its subsidiaries will be those anticipated by management. These forward-looking statements are not a guarantee of future performance and involve risks and uncertainties, and there are certain important factors that could cause actual results to differ, possibly materially, from expectations or estimates reflected in such forward-looking statements, including, among others: (1) losses on investments or financial contracts due to deterioration in credit quality or value, or counterparty default; (2) losses on insurance products due to mortality experience or policyholder behavior experience that differs significantly from our expectations when we price our products; (3) changes in interest rates and equity prices that may (a) adversely impact the profitability of our products, the value of separate accounts supporting these products or the value of assets we manage, (b) result in losses on derivatives we use to hedge risk or increase collateral posting requirements and (c) limit opportunities to invest at appropriate returns; (4) guarantees within certain of our products which are market sensitive and may decrease our earnings or increase the volatility of our results of operations or financial position; (5) liquidity needs resulting from (a) derivative collateral market exposure, (b) asset/liability mismatches, (c) the lack of available funding in the financial markets or (d) unexpected cash demands due to severe mortality calamity or lapse events; (6) financial or customer losses, or regulatory and legal actions, due to inadequate or failed processes or systems, external events, and human error or misconduct such as (a) disruption of our systems and data, (b) an information security breach, (c) a failure to protect the privacy of sensitive data, (d) reliance on third-parties or (e) labor and employment matters; (7) changes in the regulatory landscape, including related to (a) financial sector regulatory reform, (b) changes in tax laws, (c) fiduciary rules and other standards of care, (d) state insurance laws and developments regarding group-wide supervision, capital and reserves, and (e) privacy and cybersecurity regulation; (8) technological changes which may adversely impact companies in our investment portfolio or cause insurance experience to deviate from our assumptions; (9) ratings downgrades; (10) market conditions that may adversely affect the sales or persistency of our products; (11) competition and (12) reputational damage. Pruco Life Insurance Company does not intend, and is under no obligation, to update any particular forward-looking statement included in this document. See “Risk Factors Related to Our Business” included in this prospectus for discussion of certain risks relating to our business and investment in our securities.
48
MANAGEMENT'S DISCUSSION AND ANALYSIS OF FINANCIAL CONDITION AND RESULTS OF OPERATIONS
You should read the following analysis of our consolidated financial condition and results of operations in conjunction with the "Forward-Looking Statements" above, the "Regulation" and “Risk Factors Related to Our Business” sections, and the Consolidated Financial Statements included in this prospectus.
Overview
The Company sells variable annuities, indexed variable annuities, fixed annuities, universal life insurance, variable life insurance and term life insurance primarily through affiliated and unaffiliated distributors in the United States.
In August 2024, the Company entered into an agreement with Wilton Reassurance Company and Wilton Reinsurance Bermuda Limited (collectively, "Wilton Re") to coinsure a closed block of guaranteed universal life ("GUL") policies. The Company recaptured all risks associated with the subject GUL policies from Prudential Arizona Reinsurance Universal Company ("PAR U") and subsequently established yearly renewable term ("YRT") reinsurance for the subject GUL business with The Prudential Insurance Company of America ("Prudential Insurance"). The transaction was completed in December 2024 with an effective date of October 1, 2024. Effective October 1, 2025, the Company recaptured YRT treaties with Prudential Insurance and subsequently established YRT reinsurance for the business with third-party reinsurers. See Note 12 to the Consolidated Financial Statements included in this prospectus for additional information.
Effective January 2024, the Company entered into an agreement with Somerset Reinsurance Ltd. ("Somerset Re") to coinsure a closed block of GUL policies to Prudential Universal Reinsurance Entity Company ("PURE"), a wholly-owned subsidiary of Prudential Insurance, with retrocession by PURE of such liabilities on a modified coinsurance basis, to Somerset Re. This transaction is effective as of January 1, 2024, whereby, the Company recaptured all risks associated with the subject GUL policies from PAR U, Prudential Universal Reinsurance Company ("PURC") and Gibraltar Universal Life Reinsurance Company ("GUL Re") and subsequently established YRT reinsurance for the subject GUL business with Prudential Insurance. Effective October 1, 2025, the Company recaptured certain YRT treaties with Prudential Insurance and subsequently established YRT reinsurance for the business with third-party reinsurers. See Note 12 to the Consolidated Financial Statements included in this prospectus for additional information.
In May 2023, the Company entered into an agreement with AuguStar Life Insurance Company (formerly known as The Ohio National Life Insurance Company), an affiliate of Constellation Insurance Holdings, Inc., to reinsure approximately $10 billion of account values of Prudential Defined Income ("PDI") traditional variable annuity contracts with guaranteed living benefits. The transaction was completed on June 30, 2023 with an effective date of April 1, 2023. See Note 12 to the Consolidated Financial Statements included in this prospectus for additional information.
Revenues and Expenses
The Company earns revenues principally from insurance premiums, mortality and expense fees, asset administration fees from insurance and investment products, and from net investment income on the investment of general account and other funds. The Company receives premiums primarily from the sale of individual life insurance and annuity products. The Company earns mortality and expense fees, and asset administration fees, primarily from the sale and servicing of universal life insurance and separate account products including variable life insurance and variable annuities. The Company’s operating expenses principally consist of insurance benefits provided and reserves established for anticipated future insurance benefits, general business expenses, reinsurance premiums, commissions and other costs of selling and servicing the various products sold and interest credited on general account liabilities.
Industry Trends
Our business is impacted by financial markets, economic conditions, regulatory oversight, and a variety of trends that affect the industries where we compete.
Financial and Economic Environment. Through 2021, interest rates in the U.S. had experienced a prolonged period of historically low levels. This was followed by significant increases in 2022 through 2023. While there have been modest declines in 2024 and 2025, rates have sustained higher levels relative to historical periods. We expect that a continued level of relative higher interest rates will benefit our results over time. We continue to monitor current market conditions and the potential impact to our business in the event of slowing or negative economic growth. In addition, we are subject to financial impacts associated with movements in equity markets and the evolution of the credit cycle.
Demographics. Individual customer demographics continue to evolve and new opportunities present themselves in different consumer segments such as the millennial and multicultural markets. Consumer expectations and preferences are changing. We believe existing and potential customers are increasingly looking for cost-effective solutions that they can easily understand and access through technology-enabled devices. At the same time, income protection, wealth accumulation and the needs of retiring baby boomers are continuing to shape the insurance industry. A persistent retirement security gap exists in terms of both savings and protection.
Regulatory Environment. See “Regulation” for a discussion of regulatory developments that may impact the Company and the associated risks.
Competitive Environment. See “Our Business” for a discussion of the competitive environment and the basis on which we compete.
Impact of Changes in the Interest Rate Environment
Market interest rates are a key driver of our liquidity and capital positions, cash flows, results of operations and financial position. Changes in interest rates can affect these in several ways, including favorable or adverse impacts to:
•investment-related activity, including: investment income returns, net investment spread results,
new money rates, mortgage loan prepayments and bond redemptions;
49
•the valuation of fixed income investments and derivative instruments;
•collateral posting requirements, hedging costs and other risk mitigation activities;
•customer account values and assets under management, including their impacts on fee-related income;
•insurance reserve levels, including market risk benefits ("MRBs"), and market experience true-ups;
•policyholder behavior, including surrender or withdrawal activity; and
•product offerings, design features, crediting rates and sales mix.
In order to manage the impacts that changes in interest rates have on our net investment spread, we employ a proactive asset/liability management program, which includes strategic asset allocation and hedging strategies within a disciplined risk management framework. These strategies seek to match the liability characteristics of our products and to closely approximate the interest rate sensitivity of assets with that of product liabilities. We also manage duration gaps, currency and other risks between assets and liabilities through the use of derivatives, and adjust these strategies as products, customer behavior, and market conditions evolve. Our interest rate exposure is also mitigated by our business mix, which includes lines of business where fee-based and insurance underwriting earnings play a more prominent role in product profitability. We also regularly examine our product offerings and may reprice or discontinue sales of certain products that do not meet our profit expectations.
For additional information regarding interest rate risks, see "Risk Factors Related to Our Business" and “Quantitative and Qualitative Disclosures About Market Risk”.
Accounting Policies & Pronouncements
Application of Critical Accounting Estimates
The preparation of financial statements in conformity with generally accepted accounting principles in the United States of America (“U.S. GAAP”) requires the application of accounting policies that often involve a significant degree of judgment. Management, on an ongoing basis, reviews the estimates and assumptions used in the preparation of the Company's financial statements. If management determines that modifications to assumptions and estimates are appropriate given current facts and circumstances, the Company’s results of operations and financial position as reported in the Consolidated Financial Statements could change significantly.
The following sections discuss the accounting policies applied in preparing our financial statements that management believes are most dependent on the application of estimates and assumptions and require management’s most difficult, subjective or complex judgments.
Insurance Liabilities
Future Policy Benefits
Future Policy Benefit Reserves, including Unpaid Claims and Claim Adjustment Expenses
We establish reserves for future policy benefits to, or on behalf of, policyholders, using methodologies prescribed by U.S. GAAP. See Note 2 to the Consolidated Financial Statements included in this prospectus for additional information regarding the reserving methodologies used.
The assumptions used in establishing reserves are generally based on the Company’s experience, industry experience and/or other factors, as applicable. We update our actuarial assumptions, such as mortality, morbidity, retirement and policyholder behavior assumptions, annually unless a material change in our own experience or in industry experience made available to us is observed in an interim period that we feel is indicative of a long-term trend. Generally, we do not expect trends to change significantly in the short-term and, to the extent these trends may change, we expect such changes to be gradual over the long-term.
We perform an annual comprehensive review of the assumptions used for estimating future premiums, benefits, and other cash flows, including reviews related to mortality, morbidity, lapse, surrender, and other contractholder behavior assumptions, and economic assumptions, including expected future rates of returns on investments. The Company generally looks to relevant Company experience as the primary basis for these assumptions. If relevant Company experience is not available or does not have sufficient credibility, the Company may look to experience of similar blocks of business, either elsewhere within the Company or within the industry. As part of this review, we may update these assumptions and make refinements to our models based upon emerging experience, future expectations and other data, including any observable market data we feel is indicative of a long-term trend. The impact on our results from operations of changes in these assumptions can be offsetting and we are unable to predict their movement or impact over time.
Mortality rate assumptions are generally based on Company experience, sometimes blending Company experience with an industry table when Company experience alone is not sufficiently credible. The Company sets mortality and morbidity assumptions that vary by major type of business. Within types of business, rates vary by age and gender. The Company applies an adjustment for future mortality improvement, consistent with observed long-term trends of population mortality over time. Lapse and surrender assumptions are based on Company and industry experience, where available. The Company sets rates that vary by product type, taking into account features specific to the product.
50
The quarterly adjustments for market performance referred to above reflect the impact of changes to our estimate of future rates of returns on investments to reflect actual fund performance and market conditions. A portion of returns on investments for our variable life contracts are dependent upon the total rate of return on assets held in separate account investment options. This rate of return influences the fees we earn and expected claims to be paid on variable life contracts, as well as other sources of profit. Returns that are higher than our expectations for a given period produce higher-than-expected account balances, which increase the future fees we expect to earn on variable life contracts and decrease expected claims to be paid on variable life contracts. The opposite occurs when returns are lower than our expectations.
The weighted average rate of return assumptions used in developing estimated market returns consider many factors specific to each product type, including asset durations, asset allocations and other factors. With regard to equity market assumptions, the near-term future rate of return assumption used in evaluating liabilities for future policy benefits for certain of our products, primarily our domestic variable life insurance products, is generally updated each quarter and is derived using a reversion to the mean approach, a common industry practice. Under this approach, we consider historical equity returns and adjust projected equity returns over an initial future period of five years (the “near-term”) so that equity returns converge to the long-term expected rate of return. If the near-term projected future rate of return is greater than our near-term maximum future rate of return of 15.0%, we use our maximum future rate of return. If the near-term projected future rate of return is lower than our near-term minimum future rate of return of 0%, we use our minimum future rate of return. As of December 31, 2025, our domestic variable life insurance businesses assume an 8.0% long-term equity expected rate of return and a 2.3% near-term mean reversion equity expected rate of return, and our international variable life insurance business assumes a 5.5% long-term equity expected rate of return and a 0% near-term mean reversion equity expected rate of return.
With regard to interest rate assumptions used in evaluating liabilities for future policy benefits for certain of our products, we update the long-term and near-term future rates used to project fixed income returns annually and quarterly, respectively. As a result of our 2025 annual reviews and update of assumptions and other refinements, we kept our long-term expectation of the 10-year U.S. Treasury rate unchanged and continue to grade to a rate of 3.5% over ten years, and increased our long term expectation of the 10-year Japanese Government Bond yield by 25 basis points, and now grade to a rate of 1.5% over ten years. As part of our quarterly market experience updates, we update our near-term projections of interest rates to reflect changes in current rates. For additional information regarding discount rates used to establish the liability for future policy benefits, see Note 2 to the Consolidated Financial Statements included in this prospectus.
The following paragraph provides additional details about the material reserves we have established:
The reserves for future policy benefits as of December 31, 2025, primarily relate to term life and universal life products. For term life contracts, the future policy benefit reserves are generally calculated using the net premium valuation methodology. The primary assumptions used in determining these expected future benefits and expenses include mortality, lapse, and interest rate assumptions. For universal life products, which include universal life contracts that contain no-lapse guarantees, reserves for future policy benefits are established using current best estimate assumptions and are based on the benefit ratio. The primary assumptions used in establishing these reserves generally include mortality, lapse, and premium pattern, as well as interest rate and equity market return assumptions. Reserves also include claims reported but not yet paid, and claims incurred but not yet reported.
Policyholders’ Account Balances
Policyholders’ account balances liability represents the contract value that has accrued to the benefit of the policyholder as of the balance sheet date. This liability includes provisions for benefits under non-life contingent payout annuities. Policyholders’ account balances also include amounts representing the fair value of embedded derivative instruments associated with the index-linked features of certain universal life and annuity products. For additional information regarding the valuation of these embedded derivatives, see Note 6 to the Consolidated Financial Statements included in this prospectus.
Market Risk Benefits ("MRBs")
Market risk benefit liabilities (or assets) represent contracts or contract features that provide protection to the contractholder and exposes the Company to other than nominal capital market risk. The liability (or asset) for MRBs is estimated using a fair value measurement methodology. The fair value of these MRBs is based on assumptions a market participant would use in valuing market risk benefits. For additional information regarding the valuation of these MRB features, see Note 6 to the Consolidated Financial Statements included in this prospectus.
Inclusive of Policyholders' Account Balances and Market risk benefits, the Company estimates that a hypothetical change to its own credit risk of plus 50 and minus 50 basis points ("bps") would result in an increase and a decrease to Other Comprehensive Income (loss) (“OCI”) of $470 million and $500 million, respectively, and an increase and a decrease to net income of $335 million and $410 million, respectively.
Sensitivities for Insurance Assets and Liabilities
The following table summarizes the impact that could result on each of the listed financial statement balances from changes in certain key assumptions. The information below is for illustrative purposes and includes only the hypothetical direct impact on December 31, 2025 balances of changes in a single assumption and not changes in any combination of assumptions. Additionally, the illustration of the insurance assumption impacts below reflects a parallel shift in the insurance assumptions; however, these may be non-parallel in practice. Changes in current assumptions could result in impacts to financial statement balances that are in excess of the amounts illustrated. A description of the estimates and assumptions used in the preparation of each of these financial statement balances is provided above. Changes to the insurance cash flow assumptions are reflected in net income through the retrospective unlocking method for traditional long duration, limited-payment and universal life type products.
51
The impacts presented within this table exclude the impacts of our asset liability management strategy, which seeks to offset the changes in the balances presented within this table and is primarily composed of investments and derivatives. See further below for a discussion of the estimates and assumptions involved with the application of U.S. GAAP accounting policies for these instruments and “Quantitative and Qualitative Disclosures about Market Risk” for hypothetical impacts on related balances as a result of changes in certain significant assumptions. The impacts presented within this table are also net of reinsurance. See Note 12 to the Consolidated Financial Statements included in this prospectus for additional information regarding our material reinsurance agreements.
| Increase (Decrease) in Net Income due to changes in Future Policy Benefits, Market Risk Benefits(1), and Policyholders' Account Balances, Net of Reinsurance | |||||
| (in millions) | |||||
| Hypothetical change in current assumptions: | |||||
| Long-term interest rate: | |||||
| Increase by 25 basis points | $ | (5) | |||
| Decrease by 25 basis points | $ | 0 | |||
| Long-term equity expected rate of return: | |||||
| Increase by 50 basis points | $ | (10) | |||
| Decrease by 50 basis points | $ | 5 | |||
| Mortality: | |||||
| Increase by 1% | $ | 50 | |||
| Decrease by 1% | $ | (50) | |||
| Lapse(2): | |||||
| Increase by 10% | $ | 30 | |||
| Decrease by 10% | $ | (10) | |||
(1) "Market risk benefits" impact reflects the net impact of market risk benefit assets and liabilities prior to hedging.
(2) Assumes the same shock across all products; however, we would not expect lapse rates of different products to move uniformly.
Other Accounting Policies
Valuation of Investments, Including Derivatives, Measurement of Allowance for Credit Losses, and the Recognition of Other-than-Temporary Impairments
Our investment portfolio consists of public and private fixed maturity securities, commercial mortgage and other loans, equity securities, other invested assets and derivative financial instruments. Management believes the following accounting policies related to investments, including derivatives, are most dependent on the application of estimates and assumptions. Each of these policies is discussed further within other relevant disclosures related to investments and derivatives, as referenced below:
•Valuation of investments, including derivatives;
•Measurement of the allowance for credit losses on fixed maturity securities classified as available-for-sale, commercial mortgage loans, and other loans; and
•Recognition of other-than-temporary impairments ("OTTI") for equity method investments.
We present at fair value in the statements of financial position our debt security investments classified as available-for-sale, investments classified as trading, and certain fixed maturities, equity securities and certain investments within “Other invested assets,” such as derivatives. For additional information regarding the key estimates and assumptions surrounding the determination of fair value of fixed maturity and equity securities, as well as derivative instruments, embedded derivatives and other investments, see Note 6 to the Consolidated Financial Statements included in this prospectus.
For our investments classified as available-for-sale, the impact of changes in fair value is recorded as an unrealized gain or loss in AOCI, a separate component of equity. For our investments classified as trading and equity securities, the impact of changes in fair value is recorded within “Other income (loss)”. Our commercial mortgage and other loans are carried primarily at unpaid principal balances, net of unamortized deferred loan origination fees and expenses and unamortized premiums or discounts and a valuation allowance for losses.
In addition, an allowance for credit losses is measured each quarter for available-for-sale fixed maturity securities, and for commercial mortgage and other loans. For additional information regarding our policies in respect to the measurement of credit losses, see Note 2 to the Consolidated Financial Statements included in this prospectus.
For equity method investments, the carrying value of these investments is written down or impaired to fair value when a decline in value is considered to be other-than-temporary. See Note 2 of the Consolidated Financial Statements included in this prospectus for additional information regarding our OTTI policies.
52
Taxes on Income
Our effective tax rate is based on income, non-taxable and non-deductible items, tax credits, statutory tax rates and tax planning opportunities available in the various jurisdictions in which we operate. Inherent in determining our annual tax rate are judgments regarding business plans, planning opportunities and expectations about future outcomes. The Dividend Received Deduction (“DRD”) is a major reason for the difference between the Company’s effective tax rate and the U.S. federal statutory rate. The DRD is an estimate that incorporates the prior and current year information, as well as the current year’s equity market performance. Both the current estimate of the DRD and the DRD in future periods can vary based on factors such as, but not limited to, changes in the amount of dividends received that are eligible for the DRD, changes in the amount of distributions received from underlying fund investments, changes in the account balances of variable life and annuity contracts, and the Company’s taxable income before the DRD.
An increase or decrease in our effective tax rate by one percentage point would have resulted in a decrease or increase in our 2025 "Income tax expense (benefit)" of $23 million.
Contingencies
A contingency is an existing condition that involves a degree of uncertainty that will ultimately be resolved upon the occurrence of future events. Accruals for contingencies are required to be established when the future event is probable and its impact can be reasonably estimated, such as in connection with an unresolved legal matter. The initial reserve reflects management’s best estimate of the probable cost of ultimate resolution of the matter and is revised accordingly as facts and circumstances change and, ultimately, when the matter is brought to closure.
Reinsurance
The Company participates in reinsurance arrangements as either the ceding entity or the assuming entity primarily to manage capital, reduce exposure to loss and risk volatility, and provide additional capacity for future growth and diversification. Reinsurance related assets and liabilities include, in part, embedded derivatives and the cost of reinsurance, which require a significant amount of management judgment. See Note 2 to the Consolidated Financial Statements included in this prospectus for additional information regarding reinsurance.
Adoption of New Accounting Pronouncements
There were no new critical accounting estimates resulting from new accounting pronouncements adopted during 2025. See Note 2 to the Consolidated Financial Statements included in this prospectus for accounting pronouncements issued but not yet adopted and newly adopted accounting pronouncements.
53
Changes in Financial Position
2025 to 2024 Annual Comparison
Total assets increased $23.9 billion from $238.5 billion at December 31, 2024 to $262.4 billion at December 31, 2025. Significant components were:
•Total investments increased $16.9 billion primarily driven by new sales of general account annuity products; and
•Reinsurance recoverables and deposit receivables increased $6.1 billion primarily driven by the reinsurance of fixed annuities, higher GUL reserves reinsured with affiliated and external counterparties, as well as the impact related to the novation of certain YRT treaties from Prudential Insurance to the Company.
Total liabilities increased $20.5 billion from $233.8 billion at December 31, 2024 to $254.3 billion at December 31, 2025. Significant components were:
•Policyholder account balances increased $17.0 billion primarily driven by new sales of general account annuity products;
•Reinsurance and funds withheld payables increased $2.8 billion primarily driven by increased reinsurance activity, as well as the impact related to the novation of certain YRT treaties from Prudential Insurance to the Company; and
•Other liabilities decreased $1.7 billion primarily driven by the recognition of previously deferred reinsurance gains resulting from the novation of certain YRT treaties from Prudential Insurance to the Company.
Total equity increased $3.3 billion primarily driven by net income during the year, as well as unrealized gains from declining interest rates and changes to direct NPR spreads.
2024 to 2023 Annual Comparison
Total assets increased $25.2 billion from $213.3 billion at December 31, 2023 to $238.5 billion at December 31, 2024. Significant components were:
•Total investments increased $13.9 billion primarily driven by new sales of general account annuity products;
•Reinsurance recoverables and deposit receivables increased $8.0 billion primarily driven by the reinsurance of the Company's GUL block to PURE and Wilton Re; and
•Other assets increased $1.4 billion primarily driven by deferred losses associated with the reinsurance of the Company's GUL block to Wilton Re and additional term quota share reinsurance to Prudential Arizona Reinsurance Captive Company.
Partially offset by:
•Separate account assets decreased $1.0 billion primarily driven by net outflows, partially offset by favorable equity market performance.
Total liabilities increased $25.0 billion from $208.8 billion at December 31, 2023 to $233.8 billion at December 31, 2024. Significant components were:
•Policyholder account balances increased $16.6 billion primarily driven by new sales of general account annuity products;
•Reinsurance and funds withheld payables increased $5.9 billion primarily driven by the YRT reinsurance agreements with Prudential Insurance to reinsure the mortality risk for the totality of GUL policies reinsured to PURE and Wilton Re; and
•Other liabilities increased $1.8 billion primarily driven by deferred gains associated with the reinsurance of the Company's GUL block to PURE and GUL mortality risk ceded to Prudential Insurance.
Partially offset by:
•Separate account liabilities decreased $1.0 billion, corresponding to the decrease in Separate account assets, as discussed above.
Total equity increased $0.2 billion primarily driven by net income during the year, partially offset by unrealized losses from rising interest rates and changes to direct NPR spreads.
Results of Operations
Income (loss) from Operations before Income Taxes
2025 to 2024 Annual Comparison
Income (loss) from operations before income taxes increased $1,294 million from $973 million in 2024 to $2,267 million in 2025. The impact from our annual reviews and update of assumptions and other refinements was a net loss of $982 million. Excluding the comparative impact of our annual reviews and update of assumptions and other refinements, income (loss) from operations increased $2,276 million primarily driven by:
•Increased net investment income due to net business growth driven by incremental indexed product sales;
•Higher Other income (loss) primarily due to the recognition of previously deferred reinsurance gains resulting from the novation of certain YRT treaties from Prudential Insurance to the Company; and
54
•Lower Policyholders' benefits driven by the absence of the 2024 reinsurance recapture of the Company's GUL insurance policies.
Partially offset by:
•Lower Policy charges and fee income driven by the absence of the 2024 reinsurance recapture of the Company's GUL insurance policies;
•Lower Realized investment gains (losses), net driven by ceded net investment income related to reinsurance transactions, as well as changes in interest rates; and
•Higher amortization of deferred policy acquisition costs driven by the absence of the 2024 reinsurance recapture of the Company's GUL insurance policies.
2024 to 2023 Annual Comparison
Income (loss) from operations before income taxes increased $495 million from $478 million in 2023 to $973 million in 2024. This includes a favorable comparative gain of $1,060 million from our annual reviews and update of assumptions and other refinements. Excluding the impact of our annual reviews and update of assumptions and other refinements, income decreased $565 million primarily driven by:
•Higher Policyholders' benefits driven by the reinsurance recapture of the Company's guaranteed universal life insurance policies.
Partially offset by:
•Higher Policy charges and fee income driven by the reinsurance recapture of the Company's guaranteed universal life insurance policies.
•Lower amortization of deferred policy acquisition costs driven by the reinsurance recapture of the Company's guaranteed universal life insurance policies.
Revenues, Benefits and Expenses
2025 to 2024 Annual Comparison
Revenues decreased $5,204 million from $11,199 million in 2024 to $5,995 million in 2025. This includes an unfavorable comparative decrease of $1,252 million from our annual reviews and update of assumptions and other refinements. Excluding the comparative impact of our annual reviews and update of assumptions and other refinements, revenues decreased $3,952 million primarily driven by the items mentioned above in Income (loss) from operations before income taxes.
Benefits and expenses decreased $6,498 million from $10,226 million in 2024 to $3,728 million in 2025. This includes a favorable comparative decrease of $270 million from our annual reviews and update of assumptions and other refinements. Excluding the comparative impact of our annual reviews and update of assumptions and other refinements, benefits and expenses decreased $6,228 million primarily driven by the items mentioned above in Income (loss) from operations before income taxes.
2024 to 2023 Annual Comparison
Revenues increased $7,927 million from $3,272 million in 2023 to $11,199 million in 2024. This includes a favorable comparative net increase of $1,023 million from our annual reviews and update of assumptions and other refinements, as mentioned above. Excluding the impact of our annual reviews and update of assumptions and other refinements, the increase was $6,904 million primarily driven by the items mentioned above in Income (loss) from operations before income taxes.
Benefits and expenses increased $7,432 million from $2,794 million in 2023 to $10,226 million in 2024. This includes a favorable comparative net decrease of $37 million from our annual reviews of assumptions and other refinements, as mentioned above. Excluding the impact of our annual reviews and update to our assumptions and other refinements, the increase was $7,469 million primarily driven by the items mentioned above in Income (loss) from operations before income taxes.
Risks and Risk Mitigants
Fixed Annuity Risks and Risk Mitigants. The primary risk exposure of these fixed annuity products relates to investment risks we bear for providing customers a minimum guaranteed interest rate or an index-linked interest rate required to be credited to the customer’s account value, which include interest rate fluctuations and/or sustained periods of low interest rates, and credit risk related to the underlying investments. We manage these risk exposures primarily through our investment strategies and product design features, which include credit rate resetting subject to the minimum guaranteed interest rate, as well as surrender charges applied during the early years of the contract that help to provide protection for premature withdrawals. In addition, a portion of our fixed annuity products has a market value adjustment provision that affords protection of lapse in the case of rising interest rates. We also manage these risk exposures through external reinsurance for certain of our fixed annuity products.
Indexed Variable Annuity Risks and Risk Mitigants. The primary risk exposure of these indexed variable annuity products relates to the investment risks we bear in order to credit to the customer’s account balance the required crediting rate based on the performance of the elected indices at the end of each term. We manage this risk primarily through our investment strategies including derivatives and product design features, which include credit rate resetting subject to contractual minimums as well as surrender charges applied during the early years of the contract that help to provide protection for premature withdrawals. In addition, our indexed variable annuity strategies have an interim value provision that provides protection from lapse in the case of rising interest rates.
55
Variable Annuity Risks and Risk Mitigants. The primary risk exposures of our variable annuity contracts relate to actual deviations from, or changes to, the assumptions used in the original pricing of these products, including capital markets assumptions such as equity market returns, interest rates and market volatility, along with actuarial assumptions such as contractholder mortality, the timing and amount of annuitization and withdrawals, and contract lapses. For these risk exposures, achievement of our expected returns is subject to the risk that actual experience will differ from the assumptions used in the original pricing of these products. Prudential Financial, Inc. (“Prudential Financial”) manages our exposure to certain risks driven by fluctuations in capital markets primarily through a combination of i) Product Design Features, and ii) our Asset Liability Management Strategy ("ALM"), as discussed below. The Company also manages these risk exposures through external reinsurance for certain of our variable annuity products. Sales of traditional variable annuities with guaranteed living benefit riders were discontinued as of December 31, 2020, and, in April 2022, the sale of a portion of our in force traditional variable annuity block was completed.
Product Design Features:
A portion of the variable annuity contracts that we offer include an asset transfer feature. This feature is implemented at the contract level, and transfers assets between certain variable investment sub-accounts selected by the annuity contractholder and, depending on the benefit feature, a fixed-rate account in the general account or a bond fund sub-account within the separate account. The objective of the asset transfer feature is to reduce our exposure to equity market risk and market volatility. The asset transfer feature associated with our highest daily living benefit products uses a designated bond fund sub-account within the separate account. The transfers are based on a static mathematical formula used with the particular benefit which considers a number of factors, including, but not limited to, the impact of investment performance on the contractholder’s total account value. Other product design features we utilize include, among others, asset allocation restrictions, minimum issuance age requirements and certain limitations on the amount of contractholder purchase payments, as well as a required minimum allocation to our general account for certain of our products. We continue to introduce products that diversify our risk profile and have incorporated provisions in product design allowing frequent revisions of key pricing elements for certain of our products. In addition, there is diversity in our fee arrangements, as certain fees are primarily based on the benefit guarantee amount, the contractholder account value and/or premiums, which helps preserve certain revenue streams when market fluctuations cause account values to decline.
Asset Liability Management Strategy (including fixed income instruments and derivatives):
We employ an ALM strategy that utilizes a combination of both traditional fixed income instruments and derivatives to meet expected liabilities associated with our annuity guarantees. The MRB liability that we hedge consists of expected living and death benefit claims under various market conditions, which are managed using fixed income instruments, derivatives, or a combination thereof. For our Prudential Defined Income variable annuity, we utilize fixed income instruments to meet expected liabilities. For the portion of our ALM strategy executed with derivatives, we enter into a range of exchange-traded and over-the-counter (“OTC”) equity, interest rate and credit derivatives, including, but not limited to: equity and treasury futures; total return, credit default and interest rate swaps; and options including equity options, swaptions, and floors and caps. The intent of this strategy is to more efficiently manage the capital and liquidity associated with these products while continuing to mitigate fluctuations in net income due to movements in capital markets. To achieve this, we periodically review and recalibrate the ALM strategy by optimizing the mix of derivatives and fixed income instruments to achieve expected outcomes.
Under our ALM strategy, we expect differences in the U.S. GAAP net income impact between the changes in value of the fixed income instruments (either designated as available-for-sale or designated as trading) and derivatives as compared to the changes in the MRB liability these assets support. These differences can be primarily attributed to two distinct areas:
•Different accounting treatment between liabilities and assets supporting those liabilities. Under U.S. GAAP, changes in the fair value of the derivative instruments and fixed income instruments designated as trading, and MRB, excluding the changes in the Company’s NPR spreads, are immediately reflected in net income, while changes in the fair value of fixed income instruments that are designated as available-for-sale are recorded as unrealized gains (losses) in other comprehensive income.
•General hedge results. For the derivative portion of the ALM strategy, the net hedging impact (the extent to which the changes in value of the hedging instruments offset the change in value of the portion of the MRBs we are hedging) may be impacted by a number of factors, including: cash flow timing differences between our hedging instruments and the corresponding portion of the MRBs we are hedging, basis differences attributable to actual underlying contractholder funds to be hedged versus hedgeable indices, rebalancing costs related to dynamic rebalancing of hedging instruments as markets move, certain elements of the MRBs that may not be hedged (including certain actuarial assumptions), and implied and realized market volatility on the hedge positions relative to the portion of the MRBs we seek to hedge.
Income Taxes
The effective tax rate is the ratio of “Income tax expense (benefit)” divided by “Income (loss) from operations before income taxes and equity in earnings of operating joint ventures". Our effective tax rate for fiscal years 2025, 2024, and 2023 was 18.6%, 13.9% and 5.5%, respectively. For a detailed description of the nature of each significant reconciling item, see Note 13 to the Consolidated Financial Statements included in this prospectus.
Unrecognized Tax Benefits
The Company’s liability for income taxes includes the liability for unrecognized tax benefits and interest that relate to tax years still subject to review by the Internal Revenue Service or other taxing authorities. The completion of review or the expiration of the U.S. Federal statute of limitations for a given audit period could result in an adjustment to the liability for income taxes. The Company had no unrecognized benefit as of December 31, 2025, 2024, and 2023.
56
Income Tax Expense vs. Income Tax Paid in Cash
Income tax expense recorded under U.S. GAAP routinely differs from the income taxes paid in cash in any given year. Income tax expense recorded under U.S. GAAP is based on income reported in our Consolidated Statements of Operations for the current period and it includes both current and deferred taxes. Income taxes paid during the year include tax installments made for the current year as well as tax payments and refunds related to prior periods.
For additional information regarding income tax related items, see “Regulation” and Note 13 to the Consolidated Financial Statements included in this prospectus.
Investment Portfolio
We maintain diversified investment portfolios to support our liabilities to customers as well as our other general liabilities.
The investment portfolios are managed pursuant to the distinct objectives and investment policy statements of Pruco Life. The primary investment objectives of Pruco Life include:
•hedging and otherwise managing the market risk characteristics of the major product liabilities and other obligations of the Company;
•optimizing investment income yield within risk constraints over time; and
•for certain portfolios, optimizing total return, including both investment income yield and capital appreciation, within risk constraints over time, while managing the market risk exposures associated with the corresponding product liabilities.
We pursue our objective to optimize investment income yield for Pruco Life over time through:
•the investment of net operating cash flows, including new product premium inflows, and proceeds from investment sales, repayments and prepayments into investments with attractive risk-adjusted yields; and
•the sale of investments, where appropriate, either to meet various cash flow needs or to manage the portfolio's risk exposure profile with respect to duration, credit, currency and other risk factors, while considering the impact on taxes and capital.
Our portfolio management approach, while emphasizing our investment income yield and asset/liability risk management objectives, also takes into account the capital and tax implications of portfolio activity and our assertions regarding our ability and intent to hold debt securities to recovery.
Management of Investments
Our Board of Directors (“Board”) oversees our proprietary investments, including our portfolios and regularly reviews performance and risk positions. Our Chief Investment Officer Organization (“CIO Organization”) develops investment policies subject to risk limits proposed by our Risk Management group for the portfolios and directs and oversees management of the portfolios within risk limits approved annually by the Board.
The CIO Organization, works closely with product actuaries and Risk Management to understand the characteristics of our products and their associated market risk exposures. This information is incorporated into the development of target asset portfolios that manage market risk exposures associated with the liability characteristics and establish investment risk exposures, within tolerances prescribed by the Company’s investment risk limits, on which we expect to earn an attractive risk-adjusted return. We develop asset strategies for specific classes of product liabilities and attributed or accumulated surplus, each with distinct risk characteristics. Market risk exposures associated with the liabilities include interest rate risk, which is addressed through the duration characteristics of the target asset mix, and currency risk, which is addressed by the currency profile of the target asset mix. The portfolios typically include allocations to credit and other investment risks as a means to enhance investment yields and returns over time.
Most of our products can be categorized into the following three classes:
•interest-crediting products for which the rates credited to customers are periodically adjusted to reflect market and competitive forces and actual investment experience, such as fixed annuities and universal life insurance;
•participating individual and experience-rated group products in which customers participate in actual investment and business results through annual dividends, interest or return of premium; and
•products with fixed or guaranteed terms, such as traditional whole life products and payout annuities.
Our total investment portfolio is composed of a number of operating portfolios. Each operating portfolio backs a specific set of liabilities, and the portfolios have a target asset mix that supports the liability characteristics, including duration, cash flow, liquidity needs and other criteria. As of December 31, 2025, the average duration of our investment portfolios, including the impact of derivatives, was between 4 and 5 years. Our asset/liability management process has enabled us to manage our portfolios through several market cycles.
We implement our portfolio strategies primarily through investment in a broad range of fixed income assets, including government and agency securities, public and private corporate bonds and structured securities and mortgage loans. In addition, we hold allocations of non-coupon investments, which include equity securities and other invested assets such as limited partnerships and limited liability companies (“LPs/LLCs”), derivative instruments, and other miscellaneous investments.
We manage our public fixed maturity portfolio to a risk profile directed or overseen by the CIO Organization and Risk Management groups and to a profile that also reflects the market environments impacting our domestic insurance portfolios. The return that we earn on the portfolio will be reflected in investment income and in realized gains or losses on investments.
57
We use privately-placed corporate debt securities and commercial mortgage loans, which consist of mortgages on diversified properties in terms of geography, property type and borrowers, to enhance the yield on our portfolios and to improve the overall diversification of the portfolios. Private placements typically offer enhanced yields due to an illiquidity premium and generally offer enhanced credit protection in the form of covenants. Our origination capability offers the opportunity to lead transactions and gives us the opportunity for better terms, including covenants and call protection, and to take advantage of innovative deal structures.
Derivative strategies are employed in the context of our risk management framework to enhance our ability to manage interest rate and currency risk exposures of the asset portfolio relative to the liabilities and to manage credit and equity positions in the investment portfolios. For a discussion of our risk management process, see “Quantitative and Qualitative Disclosures About Market Risk” below.
Our portfolio asset allocation reflects our emphasis on diversification across asset classes, sectors and issuers. The CIO Organization, directly and through related functions within the insurance subsidiaries, implements portfolio strategies primarily through Prudential’s PGIM segment. Activities of the PGIM segment on behalf of Pruco Life's portfolios are directed and overseen by the CIO Organization and monitored by Risk Management for compliance with investment risk limits.
Portfolio Composition
Our investment portfolio consists of public and private fixed maturity securities, commercial mortgage and other loans, policy loans and non-coupon investments, which include equity securities and other invested assets such as LPs/LLCs, derivative instruments and other miscellaneous investments. The composition of our investment portfolio reflects, within the discipline provided by our risk management approach, our need for competitive results and the selection of diverse investment alternatives available primarily through our PGIM segment. The size of our portfolio enables us to invest in asset classes that may be unavailable to the typical investor.
The following table sets forth the composition of our investment portfolio as of the dates indicated:
| December 31, | ||||||||||||||||||||||||||
| 2025 | 2024 | |||||||||||||||||||||||||
| ($ in millions) | ||||||||||||||||||||||||||
| Fixed maturities: | ||||||||||||||||||||||||||
| Public, available-for-sale, at fair value | $ | 32,200 | 46.2 | % | $ | 23,089 | 43.7 | % | ||||||||||||||||||
| Private, available-for-sale, at fair value | 15,424 | 22.1 | 11,897 | 22.5 | ||||||||||||||||||||||
| Fixed maturities, trading, at fair value | 4,892 | 7.0 | 3,845 | 7.3 | ||||||||||||||||||||||
| Equity securities, at fair value | 2,870 | 4.1 | 2,624 | 4.9 | ||||||||||||||||||||||
| Commercial mortgage and other loans, net of allowance | 10,083 | 14.4 | 7,759 | 14.7 | ||||||||||||||||||||||
| Policy loans, at outstanding balance | 1,667 | 2.4 | 1,542 | 2.9 | ||||||||||||||||||||||
| Other invested assets(1) | 2,297 | 3.3 | 1,582 | 3.0 | ||||||||||||||||||||||
| Short-term investments, net of allowance | 321 | 0.5 | 517 | 1.0 | ||||||||||||||||||||||
| Total investments | $ | 69,754 | 100.0 | % | $ | 52,855 | 100.0 | % | ||||||||||||||||||
(1) Other invested assets consist of investments in LPs/LLCs, derivative instruments and other miscellaneous investments.
The increase in investments in 2025 was primarily due to net business inflows and a net decrease in U.S. interest rates.
58
Investment Results
The following table sets forth the investment results for the periods indicated. The yields are based on net investment income as reported under U.S. GAAP and as such do not include certain interest-related items, such as settlements of duration management swaps which are included in “Realized investment gains (losses), net”.
| Years Ended December 31, | |||||||||||||||||||||||||||||||||||
| 2025 | 2024 | 2023 | |||||||||||||||||||||||||||||||||
| Yield(1) | Amount | Yield(1) | Amount | Yield(1) | Amount | ||||||||||||||||||||||||||||||
| ($ in millions) | |||||||||||||||||||||||||||||||||||
| Fixed maturities(2) | 5.35 | % | $ | 2,239 | 5.30 | % | $ | 1,671 | 4.71 | % | $ | 1,183 | |||||||||||||||||||||||
| Equity securities | 3.18 | 63 | 3.02 | 30 | 3.00 | 15 | |||||||||||||||||||||||||||||
| Commercial mortgage and other loans | 5.15 | 445 | 4.86 | 329 | 4.07 | 232 | |||||||||||||||||||||||||||||
| Policy loans | 4.84 | 67 | 5.06 | 66 | 5.71 | 48 | |||||||||||||||||||||||||||||
| Short-term investments and cash equivalents | 4.35 | 121 | 5.88 | 172 | 5.58 | 122 | |||||||||||||||||||||||||||||
| Gross investment income | 5.16 | 2,935 | 5.20 | 2,268 | 4.68 | 1,600 | |||||||||||||||||||||||||||||
| Investment expenses | (0.23) | (129) | (0.25) | (105) | (0.23) | (77) | |||||||||||||||||||||||||||||
| Investment income after investment expenses | 4.93 | % | 2,806 | 4.95 | % | 2,163 | 4.45 | % | 1,523 | ||||||||||||||||||||||||||
| Other invested assets(3) | 405 | 259 | 153 | ||||||||||||||||||||||||||||||||
| Total net investment income | $ | 3,211 | $ | 2,422 | $ | 1,676 | |||||||||||||||||||||||||||||
(1)The denominator in the yield percentage is based on quarterly average carrying values for all asset types except for fixed maturities which are based on amortized cost, net of allowance. Amounts for fixed maturities, short-term investments and cash equivalents are also netted for securities lending activity (i.e., income netted for rebate expenses and asset values netted for securities lending liabilities). A yield is not presented for other invested assets as it is not considered a meaningful measure of investment performance.
(2)Includes fixed maturity securities classified as available-for-sale and derivative instruments. Excludes fixed maturity securities classified as trading, which are included in other invested assets.
(3)Other invested assets consist of investments in LPs/LLCs, fixed maturities classified as trading and other miscellaneous investments.
The investment income after investment expenses yield for 2025 compared to 2024 remained relatively flat.
The increase in investment income after investment expenses yield for 2024 compared to 2023 was primarily the result of higher fixed income reinvestment rates.
59
Fixed Maturity Securities
In the following sections, we provide details about our fixed maturity securities portfolio, which excludes fixed maturity securities classified as trading.
Fixed Maturity Securities by Contractual Maturity Date
The following table sets forth the breakdown of the amortized cost of our fixed maturity securities portfolio by contractual maturity, as of the date indicated:
| December 31, 2025 | ||||||||||||||
| Amortized Cost | % of Total | |||||||||||||
| ($ in millions) | ||||||||||||||
| Corporate & government securities | ||||||||||||||
| Maturing in 2026 | $ | 1,745 | 3.6 | % | ||||||||||
| Maturing in 2027 | 2,756 | 5.7 | ||||||||||||
| Maturing in 2028 | 3,572 | 7.4 | ||||||||||||
| Maturing in 2029 | 4,061 | 8.4 | ||||||||||||
| Maturing in 2030 | 5,349 | 11.1 | ||||||||||||
| Maturing in 2031 | 4,001 | 8.3 | ||||||||||||
| Maturing in 2032 | 2,632 | 5.5 | ||||||||||||
| Maturing in 2033 | 1,795 | 3.7 | ||||||||||||
| Maturing in 2034 | 1,907 | 4.0 | ||||||||||||
| Maturing in 2035 | 2,109 | 4.4 | ||||||||||||
| Maturing in 2036 | 495 | 1.0 | ||||||||||||
| Maturing in 2037 and beyond | 10,448 | 21.7 | ||||||||||||
| Total corporate & government securities | 40,870 | 84.8 | ||||||||||||
| Asset-backed | 5,052 | 10.5 | ||||||||||||
| Commercial mortgage-backed | 1,371 | 2.8 | ||||||||||||
| Residential mortgage-backed | 937 | 1.9 | ||||||||||||
| Total fixed maturities, available-for-sale | $ | 48,230 | 100.0 | % | ||||||||||
60
Fixed Maturity Securities by Industry
The following table sets forth the composition of our fixed maturity, available-for-sale portfolio by industry category and the associated gross unrealized gains and losses, as well as the allowance for credit losses (“ACL”), as of the dates indicated:
| December 31, 2025 | December 31, 2024 | ||||||||||||||||||||||||||||||||||||||||||||||||||||||||||
| Industry(1) | Amortized Cost | Gross Unrealized Gains | Gross Unrealized Losses | ACL | Fair Value | Amortized Cost | Gross Unrealized Gains | Gross Unrealized Losses | ACL | Fair Value | |||||||||||||||||||||||||||||||||||||||||||||||||
| (in millions) | |||||||||||||||||||||||||||||||||||||||||||||||||||||||||||
| Corporate securities: | |||||||||||||||||||||||||||||||||||||||||||||||||||||||||||
| Finance | $ | 11,416 | $ | 223 | $ | 322 | $ | 0 | $ | 11,317 | $ | 8,447 | $ | 48 | $ | 473 | $ | 0 | $ | 8,022 | |||||||||||||||||||||||||||||||||||||||
| Consumer non-cyclical | 5,518 | 89 | 267 | 0 | 5,340 | 4,334 | 20 | 369 | 10 | 3,975 | |||||||||||||||||||||||||||||||||||||||||||||||||
| Utility | 3,553 | 65 | 217 | 0 | 3,401 | 2,869 | 12 | 267 | 0 | 2,614 | |||||||||||||||||||||||||||||||||||||||||||||||||
| Capital goods | 4,776 | 125 | 118 | 0 | 4,783 | 3,666 | 20 | 199 | 6 | 3,481 | |||||||||||||||||||||||||||||||||||||||||||||||||
| Consumer cyclical | 2,497 | 61 | 32 | 0 | 2,526 | 2,217 | 14 | 64 | 15 | 2,152 | |||||||||||||||||||||||||||||||||||||||||||||||||
| Foreign agencies | 366 | 5 | 22 | 0 | 349 | 284 | 1 | 32 | 0 | 253 | |||||||||||||||||||||||||||||||||||||||||||||||||
| Energy | 2,832 | 63 | 69 | 0 | 2,826 | 1,985 | 8 | 110 | 8 | 1,875 | |||||||||||||||||||||||||||||||||||||||||||||||||
| Communications | 802 | 12 | 40 | 8 | 766 | 714 | 5 | 44 | 0 | 675 | |||||||||||||||||||||||||||||||||||||||||||||||||
| Basic industry | 1,484 | 39 | 48 | 1 | 1,474 | 1,369 | 4 | 84 | 0 | 1,289 | |||||||||||||||||||||||||||||||||||||||||||||||||
| Transportation | 2,232 | 89 | 64 | 2 | 2,255 | 1,754 | 19 | 115 | 0 | 1,658 | |||||||||||||||||||||||||||||||||||||||||||||||||
| Technology | 2,516 | 53 | 49 | 2 | 2,518 | 1,643 | 9 | 74 | 1 | 1,577 | |||||||||||||||||||||||||||||||||||||||||||||||||
| Industrial other | 765 | 11 | 56 | 0 | 720 | 527 | 1 | 66 | 0 | 462 | |||||||||||||||||||||||||||||||||||||||||||||||||
| Total corporate securities | 38,757 | 835 | 1,304 | 13 | 38,275 | 29,809 | 161 | 1,897 | 40 | 28,033 | |||||||||||||||||||||||||||||||||||||||||||||||||
| Foreign government | 456 | 7 | 38 | 0 | 425 | 362 | 1 | 53 | 0 | 310 | |||||||||||||||||||||||||||||||||||||||||||||||||
| Residential mortgage-backed(2) | 937 | 10 | 5 | 0 | 942 | 367 | 1 | 12 | 0 | 356 | |||||||||||||||||||||||||||||||||||||||||||||||||
| Asset-backed | 5,052 | 31 | 5 | 1 | 5,077 | 3,728 | 31 | 9 | 0 | 3,750 | |||||||||||||||||||||||||||||||||||||||||||||||||
| Commercial mortgage-backed | 1,371 | 17 | 34 | 0 | 1,354 | 945 | 5 | 53 | 0 | 897 | |||||||||||||||||||||||||||||||||||||||||||||||||
| U.S. Government | 1,197 | 24 | 104 | 0 | 1,117 | 1,200 | 8 | 109 | 0 | 1,099 | |||||||||||||||||||||||||||||||||||||||||||||||||
| State & Municipal | 460 | 1 | 27 | 0 | 434 | 570 | 1 | 30 | 0 | 541 | |||||||||||||||||||||||||||||||||||||||||||||||||
| Total fixed maturities, available-for-sale | $ | 48,230 | $ | 925 | $ | 1,517 | $ | 14 | $ | 47,624 | $ | 36,981 | $ | 208 | $ | 2,163 | $ | 40 | $ | 34,986 | |||||||||||||||||||||||||||||||||||||||
(1)Investment data has been classified based on standard industry categorizations for domestic public holdings and similar classifications by industry for all other holdings.
(2)As of both December 31, 2025 and 2024, based on amortized cost, more than 99% were rated A or higher.
Fixed Maturity Securities Credit Quality
The Securities Valuation Office (“SVO”) of the National Association of Insurance Commissioners (“NAIC”) evaluates the investments of insurers for statutory reporting purposes and assigns fixed maturity securities to one of six categories called “NAIC Designations.” In general, NAIC Designations of “1” highest quality, or “2” high quality, include fixed maturities considered investment grade, which include securities rated Baa3 or higher by Moody’s Investor Service, Inc. (“Moody’s”) or BBB- or higher by Standard & Poor’s Rating Services (“S&P”). NAIC Designations of “3” through “6” generally include fixed maturities referred to as below investment grade, which include securities rated Ba1 or lower by Moody’s and BB+ or lower by S&P. The NAIC Designations for commercial mortgage-backed securities and non-agency residential mortgage-backed securities, including our asset-backed securities collateralized by sub-prime mortgages, are based on security level expected losses as modeled by an independent third party (engaged by the NAIC) and the statutory carrying value of the security, including any purchase discounts or impairment charges previously recognized.
As a result of time lags between the funding of investments, the finalization of legal documents, and the completion of the SVO filing process, the fixed maturity portfolio includes certain securities that have not yet been designated by the SVO as of each balance sheet date. Pending receipt of SVO designations, the categorization of these securities by NAIC Designation is based on the expected ratings indicated by internal analysis.
Ratings assigned by nationally recognized rating agencies include S&P, Moody’s, Fitch Ratings, Inc. (“Fitch”) and Morningstar, Inc. (“Morningstar”). Low issue composite rating uses ratings from the major credit rating agencies or, if these are not available, an equivalent internal rating. For securities where the ratings assigned are not equivalent, the second lowest rating is utilized.
61
The following table sets forth our fixed maturity, available-for-sale portfolio by NAIC Designation or equivalent rating, as of the dates indicated:
| December 31, 2025 | December 31, 2024 | |||||||||||||||||||||||||||||||||||||||||||||||||||||||||||||
| NAIC Designation(1) | Amortized Cost | Gross Unrealized Gains | Gross Unrealized Losses(2) | ACL | Fair Value | Amortized Cost | Gross Unrealized Gains | Gross Unrealized Losses(2) | ACL | Fair Value | ||||||||||||||||||||||||||||||||||||||||||||||||||||
| (in millions) | ||||||||||||||||||||||||||||||||||||||||||||||||||||||||||||||
| 1 | $ | 24,947 | $ | 325 | $ | 870 | $ | 0 | $ | 24,402 | $ | 19,247 | $ | 109 | $ | 1,093 | $ | 0 | $ | 18,263 | ||||||||||||||||||||||||||||||||||||||||||
| 2 | 20,448 | 496 | 599 | 0 | 20,345 | 15,232 | 81 | 966 | 0 | 14,347 | ||||||||||||||||||||||||||||||||||||||||||||||||||||
| Subtotal High or Highest Quality Securities(3) | 45,395 | 821 | 1,469 | 0 | 44,747 | 34,479 | 190 | 2,059 | 0 | 32,610 | ||||||||||||||||||||||||||||||||||||||||||||||||||||
| 3 | 1,592 | 71 | 29 | 2 | 1,632 | 1,209 | 8 | 67 | 0 | 1,150 | ||||||||||||||||||||||||||||||||||||||||||||||||||||
| 4 | 1,068 | 29 | 15 | 9 | 1,073 | 952 | 8 | 28 | 4 | 928 | ||||||||||||||||||||||||||||||||||||||||||||||||||||
| 5 | 129 | 3 | 3 | 0 | 129 | 225 | 1 | 7 | 0 | 219 | ||||||||||||||||||||||||||||||||||||||||||||||||||||
| 6 | 46 | 1 | 1 | 3 | 43 | 116 | 1 | 2 | 36 | 79 | ||||||||||||||||||||||||||||||||||||||||||||||||||||
| Subtotal Other Securities(4)(5) | 2,835 | 104 | 48 | 14 | 2,877 | 2,502 | 18 | 104 | 40 | 2,376 | ||||||||||||||||||||||||||||||||||||||||||||||||||||
| Total fixed maturities, available-for-sale | $ | 48,230 | $ | 925 | $ | 1,517 | $ | 14 | $ | 47,624 | $ | 36,981 | $ | 208 | $ | 2,163 | $ | 40 | $ | 34,986 | ||||||||||||||||||||||||||||||||||||||||||
(1)As of December 31, 2025 and 2024, includes 307 securities with amortized cost of $2,155 million (fair value, $2,176 million) and 163 securities with amortized cost of $1,126 million (fair value, $1,062 million), respectively, that have been categorized based on expected NAIC Designations pending receipt of SVO ratings.
(2)As of December 31, 2025, includes gross unrealized losses of $8 million on public fixed maturities and $40 million on private fixed maturities considered to be other than high or highest quality and, as of December 31, 2024, includes gross unrealized losses of $10 million on public fixed maturities and $94 million on private fixed maturities considered to be other than high or highest quality.
(3)On an amortized cost basis, as of December 31, 2025, includes $32,573 million of public fixed maturities and $12,822 million of private fixed maturities and, as of December 31, 2024, includes $24,005 million of public fixed maturities and $10,474 million of private fixed maturities.
(4)On an amortized cost basis, as of December 31, 2025, includes $242 million of public fixed maturities and $2,593 million of private fixed maturities and, as of December 31, 2024, includes $304 million of public fixed maturities and $2,198 million of private fixed maturities.
(5)On an amortized cost basis, as of December 31, 2025, securities considered below investment grade based on low issue composite ratings total $2,408 million, or 5% of the total fixed maturities, and include securities considered high or highest quality by the NAIC based on the rules described above.
Liquidity and Capital Resources
Overview
Liquidity refers to the ability to generate sufficient cash resources to meet the payment obligations of the Company. Capital refers to the long-term financial resources available to support the operations of our business, fund business growth, and provide a cushion to withstand adverse circumstances. Our ability to generate and maintain sufficient liquidity and capital depends on the profitability of our business, general economic conditions, our ability to borrow from affiliates and our access to the capital markets through affiliates as described herein.
Effective and prudent liquidity and capital management is a priority across the organization. Management monitors the liquidity of the Company on a daily basis and projects borrowing and capital needs over a multi-year time horizon. We use a Risk Appetite Framework ("RAF") to ensure that all risks taken by the Company align with our capacity and willingness to take those risks. The RAF provides a dynamic assessment of capital and liquidity stress impacts, including scenarios similar to, and more severe than, those occurring due to COVID-19, and is intended to ensure that sufficient resources are available to absorb those impacts. We believe that our capital and liquidity resources are sufficient to satisfy the capital and liquidity requirements of the Company.
Our businesses are subject to comprehensive regulation and supervision by domestic and international regulators. These regulations currently include requirements (many of which are the subject of ongoing rule-making) relating to capital and liquidity management. For information on these regulatory initiatives and their potential impact on us, see “Regulation" and “Risk Factors Related to Our Business".
62
Capital
We manage the Company to regulatory capital levels consistent with our "AA" ratings targets. We utilize the risk-based capital (“RBC”) ratio as a primary measure of capital adequacy. RBC is calculated based on statutory financial statements and risk formulas consistent with the practices of the National Association of Insurance Commissioners ("NAIC"). RBC considers, among other things, risks related to the type and quality of the invested assets, insurance-related risks associated with an insurer’s products and liabilities, interest rate risks, and general business risks. RBC ratio calculations are intended to assist insurance regulators in measuring an insurer’s solvency and ability to pay future claims. The reporting of RBC measures is not intended for the purpose of ranking any insurance company or for use in connection with any marketing, advertising or promotional activities, but is available to the public. The Company’s capital levels substantially exceed the minimum level required by applicable insurance regulations. Our regulatory capital levels may be affected in the future by changes to the applicable regulations, proposals for which are currently under consideration by both domestic and international insurance regulators.
The regulatory capital level of the Company can be materially impacted by interest rate and equity market fluctuations, changes in the values of derivatives, the level of impairments recorded, and credit quality migration of the investment portfolio, among other items. In addition, the reinsurance of business or the recapture of business subject to reinsurance arrangements due to defaults by, or credit quality migration affecting, the reinsurers or for other reasons could negatively impact regulatory capital levels. The Company’s regulatory capital level is also affected by statutory accounting rules, which are subject to change by each applicable insurance regulator.
Captive Reinsurance Companies
Prudential Financial and the Company use captive reinsurance companies for our individual life business to more effectively manage our reserves and capital on an economic basis and to enable the aggregation and transfer of risks. The captive reinsurance companies assume business from affiliates only. To support the risks they assume, our captives are capitalized to a level we believe is consistent with the “AA” financial strength rating targets of Prudential Financial’s insurance subsidiaries. All of the captive reinsurance companies are wholly-owned subsidiaries of Prudential Financial and are located domestically, typically in the state of domicile of the direct writing insurance subsidiary that cedes the majority of business to the captive. In addition to state insurance regulation, the captives are subject to internal policies governing their activities. In the normal course of business, Prudential Financial contributes capital to the captives to support business growth and other needs. Prudential Financial has also entered into support agreements with several of the captives in connection with financing arrangements.
Prudential Financial's life insurance subsidiaries are subject to a regulation entitled “Valuation of Life Insurance Policies Model Regulation,” commonly known as “Regulation XXX,” and a supporting guideline entitled “The Application of the Valuation of Life Insurance Policies Model Regulation,” commonly known as “Guideline AXXX.” The regulation and supporting guideline require insurers to establish statutory reserves for term and universal life insurance policies with long-term premium guarantees at a level that exceeds what our actuarial assumptions for this business would otherwise require. Prudential Financial uses captive reinsurance companies to finance the portion of the reserves for this business that we consider to be non-economic as described below under “—Financing Activities—Term and Universal Life Reserve Financing.”
Liquidity
Our liquidity is managed to ensure stable, reliable and cost-effective sources of cash flows to meet all of our obligations. Liquidity is provided by a variety of sources, as described more fully below, including portfolios of liquid assets. Our investment portfolios are integral to the overall liquidity of the Company. We use a projection process for cash flows from operations to ensure sufficient liquidity to meet projected cash outflows, including claims. The impact of Prudential Funding, LLC’s ("Prudential Funding"), a wholly-owned subsidiary of Prudential Insurance, financing capacity on liquidity (as described below) is considered in the internal liquidity measures of the Company.
Liquidity is measured against internally-developed benchmarks that take into account the characteristics of both the asset portfolio and the liabilities that they support. We consider attributes of the various categories of liquid assets (for example, type of asset and credit quality) in calculating internal liquidity measures to evaluate our liquidity under various stress scenarios, including company-specific and market-wide events. We continue to believe that cash generated by ongoing operations and the liquidity profile of our assets provide sufficient liquidity under reasonably foreseeable stress scenarios.
Cash Flow
The principal sources of the Company’s liquidity are premiums and certain annuity considerations, investment and fee income, investment maturities, sales of investments and internal borrowings. The principal uses of that liquidity include benefits, claims, and payments to policyholders and contractholders in connection with surrenders, withdrawals and net policy loan activity. Other uses of liquidity include commissions, general and administrative expenses, purchases of investments, the payment of dividends and returns of capital to the parent company, hedging and reinsurance activity and payments in connection with financing activities.
We believe that cash flows from our operations are adequate to satisfy current liquidity requirements. The continued adequacy of our liquidity will depend upon factors such as future securities market conditions, changes in interest rate levels, policyholder perceptions of our financial strength, policyholder behavior, catastrophic events and the relative safety and attractiveness of competing products, each of which could lead to reduced cash inflows or increased cash outflows. Cash flows from investment activities results from repayments of principal, proceeds from maturities and sales of invested assets and investment income, net of amounts reinvested.
In managing liquidity, we consider the risk of policyholder and contractholder withdrawals of funds earlier than our assumptions when selecting assets to support these contractual obligations. We use surrender charges and other contract provisions to mitigate the extent, timing and profitability impact of withdrawals of funds by customers.
63
| Years Ended December 31, | |||||||||||||||||
| 2025 | 2024 | 2023 | |||||||||||||||
| (in millions) | |||||||||||||||||
| Cash and cash equivalents, beginning of year | $ | 3,326 | $ | 2,140 | $ | 2,398 | |||||||||||
| Cash flows from (used in) operating activities | 4,161 | 3,481 | 2,459 | ||||||||||||||
| Cash flows from (used in) investing activities | (15,499) | (14,368) | (9,639) | ||||||||||||||
| Cash flows from (used in) financing activities | 10,889 | 12,073 | 6,922 | ||||||||||||||
| Net increase (decrease) in cash and cash equivalents | (449) | 1,186 | (258) | ||||||||||||||
| Cash and cash equivalents, end of year | $ | 2,877 | $ | 3,326 | $ | 2,140 | |||||||||||
Year Ended December 31, 2025 Compared to the Year Ended December 31, 2024
Net cash from operating activities was $4.1 billion in 2025 compared to $3.5 billion in 2024.
Net cash used in investing activities was $15.5 billion in 2025 compared to $14.4 billion in 2024. The increase in net cash used in investing activities of $1.1 billion was primarily due to higher payments for the purchase of fixed maturities, available-for-sale, partially offset by higher proceeds from the sale/maturity/prepayment of such securities.
Net cash from financing activities was $10.9 billion in 2025 compared to $12.1 billion in 2024. The decrease in net cash from financing activities of $1.2 billion was primarily due higher affiliated ceded policyholders' account deposits and policyholders' account withdrawals.
Year Ended December 31, 2024 Compared to the Year Ended December 31, 2023
Net cash from operating activities was $3.5 billion in 2024 compared to $2.5 billion in 2023. The increase in net cash from operating activities of $1.0 billion was primarily due to cash inflows from changes in derivative positions and a larger increase in future policy benefits and other insurance liabilities. These inflows were partially offset by cash outflows driven by larger increases in reinsurance related-balances and deferred acquisition costs.
Net cash used in investing activities was $14.4 billion in 2024 compared to $9.6 billion in 2023. The increase in net cash used in investing activities of $4.8 billion was primarily due to higher payments for the purchase of fixed maturities, available-for-sale, and equity securities, partially offset by higher proceeds from the sale/maturity/prepayment of such securities.
Net cash from financing activities was $12.1 billion in 2024 compared to $6.9 billion in 2023. The increase in net cash from financing activities of $5.2 billion was primarily due to higher policyholders’ account deposits.
Liquid Assets
Liquid assets include cash and cash equivalents, short-term investments, U.S. Treasury fixed maturities, fixed maturities that are not designated as held-to-maturity, and public equity securities. As of December 31, 2025 and 2024, the Company had liquid assets of $58.6 billion and $45.3 billion, respectively. The portion of liquid assets comprised of cash and cash equivalents and short-term investments was $3.2 billion and $3.8 billion as of December 31, 2025 and 2024, respectively. As of December 31, 2025, $44.7 billion, or 94%, of the fixed maturity investments in the Company's general account portfolios were rated high or highest quality based on NAIC or equivalent rating.
Prudential Funding, LLC
Prudential Financial and Prudential Funding borrow funds in the capital markets primarily through the direct issuance of commercial paper. The borrowings serve as an additional source of financing to meet our working capital needs. Prudential Funding operates under a support agreement with Prudential Insurance whereby Prudential Insurance has agreed to maintain Prudential Funding’s positive tangible net worth at all times.
Hedging activities associated with Annuities
For the portion of the risk management strategy executed through hedging, we enter into a range of exchange-traded, cleared and other OTC equity and interest rate derivatives in order to hedge certain capital market risks related to more severe market conditions. This portion of our ALM strategy requires access to liquidity to meet payment obligations relating to these derivatives, such as payments for periodic settlements, purchases, maturities and terminations. These liquidity needs can vary materially due to, among other items, changes in interest rates, equity markets, mortality and policyholder behavior.
The hedging portion of our ALM strategy may also result in derivative-related collateral postings to (when we are in a net pay position) or from (when we are in a net receive position) counterparties. The net collateral position depends on changes in interest rates and equity markets related to the amount of the exposures hedged. Depending on market conditions, the collateral posting requirements can result in material liquidity needs when we are in a net post position.
64
Financing Activities
Term and Universal Life Reserve Financing
For business written prior to the implementation of principle-based reserving, Regulation XXX and Guideline AXXX require domestic life insurers to establish statutory reserves for term and universal life insurance policies with long-term premium guarantees that are consistent with the statutory reserves required for other individual life policies with similar guarantees. Many market participants believe that these levels of reserves are excessive relative to the levels reasonably required to maintain solvency for moderately adverse experience. The difference between the statutory reserve and the amount necessary to maintain solvency for moderately adverse experience is considered to be the non-economic portion of the statutory reserve.
The Company uses affiliated captive reinsurance companies to finance the portion of the statutory reserves required to be held under Regulation XXX and Guideline AXXX that is considered to be non-economic. The financing arrangements involve the reinsurance of term and universal life business to our affiliated captive reinsurers and the issuance of surplus notes by those affiliated captives that are treated as capital for statutory purposes. These surplus notes are subordinated to policyholder obligations, and the payment of principal and interest on the surplus notes can only be made with prior insurance regulatory approval.
Under the agreements, the affiliated captive receives in exchange for the surplus notes one or more credit-linked notes issued by a special-purpose affiliate of the Company with an aggregate principal amount equal to the surplus notes outstanding. The affiliated captive holds the credit-linked notes as assets supporting Regulation XXX or Guideline AXXX non-economic reserves, as applicable. The captive can redeem the principal amount of the outstanding credit-linked notes for cash upon the occurrence of, and in an amount necessary to remedy, a specified liquidity stress event affecting the captive. Under the agreements, the external counterparties have agreed to fund any such payments under the credit-linked notes in return for the receipt of fees. To date, no such payments under the credit-linked notes have been required. Under these transactions, because valid rights of set-off exist, interest and principal payments on the surplus notes and on the credit-linked notes are settled on a net basis, and the surplus notes are reflected in the Company’s total consolidated borrowings on a net basis. As a result of reinsurance transactions executed with Somerset Re and Wilton Re, we have eliminated Credit-Linked Note Structures supporting Guideline AXXX for our remaining business. In November 2024, we restructured a series of internal captive reinsurance arrangements resulting in the consolidation of Credit-Linked Note Structures supporting Regulation XXX.
As of December 31, 2025, the affiliated captive reinsurance companies have entered into agreements with external counterparties providing for the issuance of up to an aggregate of $8,000 million of surplus notes by our affiliated captive reinsurers in return for the receipt of credit-linked notes (“Credit-Linked Note Structures”), of which $7,660 million of surplus notes was outstanding, as compared to an aggregate issuance capacity of $8,000 million, of which $7,560 million was outstanding as of December 31, 2024. These amounts exclude credit-linked note structures used to finance Guideline AXXX reserves for business reinsured to Somerset Re in March 2024.
As of December 31, 2025, the affiliated captive reinsurance companies had outstanding an aggregate of $100 million of debt issued for the purpose of financing Regulation XXX non-economic reserves. In addition, as of December 31, 2025, for purposes of financing Guideline AXXX reserves, one of the affiliated captives had approximately $3,982 million of surplus notes outstanding that were issued to affiliates.
The Company has introduced updated versions of its individual life products in conjunction with the requirement to adopt principle-based reserving by January 1, 2020. These updated products are currently priced to support the principle-based statutory reserve level without the need for reserve financing.
QUANTITATIVE AND QUALITATIVE DISCLOSURES ABOUT MARKET RISK
Market Risk
Market risk is defined as the risk of loss from changes in interest rates, equity prices and foreign currency exchange rates resulting from asset/liability mismatches where the change in the value of our liabilities is not offset by the change in value of our assets.
For additional information regarding the potential impacts of interest rate and other market fluctuations, as well as general economic and market conditions on our businesses and profitability, see “Risk Factors Related to Our Business” above. For additional information regarding our liquidity and capital resources, which may be impacted by changing market risks, see “Management’s Discussion and Analysis of Financial Condition and Results of Operations” above.
Market Risk Management
Management of market risk, which we consider to be a combination of both investment risk and market risk exposures, includes the identification and measurement of various forms of risk, the establishment of risk thresholds and the creation of processes intended to maintain risks within these thresholds while optimizing returns on the underlying assets or liabilities. As an indirect wholly-owned subsidiary of Prudential Financial, the Company benefits from the risk management strategies implemented by Prudential Financial.
Our risk management process utilizes a variety of tools and techniques, including:
•Measures of price sensitivity to market changes (e.g., interest rates, equity index prices, foreign exchange);
•Asset/liability management;
•Stress scenario testing;
•Hedging programs and affiliated reinsurance; and
•Risk management governance, including policies, limits, and a committee that oversees investment and market risk.
65
Market Risk Mitigation
Risk mitigation takes three primary forms:
•Asset/Liability Management: Managing assets to liability-based measures. For example, investment policies identify target durations for assets based on liability characteristics and asset portfolios are managed within ranges around them. This mitigates potential unanticipated economic losses from interest rate movements.
•Hedging: Using derivatives to offset risk exposures. For example, for our variable annuities business, potential living benefit claims resulting from more severe market conditions are hedged using derivative instruments.
•Management of portfolio concentration risk. For example, ongoing monitoring and management of key rate, currency and other concentration risks support diversification efforts to mitigate exposure to individual markets and sources of risk.
Market Risk Related to Interest Rates
We perform liability-driven investing and engage in careful asset/liability management. Asset/liability mismatches create the risk that changes in liability values will differ from the changes in the value of the related assets. Additionally, changes in interest rates may impact other items including, but not limited to, the following:
•Net investment spread between the amounts that we are required to pay and the rate of return we are able to earn on investments for certain products supported by general account investments;
•Asset-based fees earned on assets under management or contractholder account values;
•Net exposure to the guarantees provided under certain products; and
•Our capital levels.
In order to mitigate the impact that an unfavorable interest rate environment has on our net interest margins, we employ a proactive asset/liability management program, which includes strategic asset allocation and derivative strategies within a disciplined risk management framework. These strategies seek to match the characteristics of our products, and to approximate the interest rate sensitivity of the assets with the estimated interest rate sensitivity of the product liabilities. Our asset/liability management program also helps manage duration gaps, currency and other risks between assets and liabilities through the use of derivatives. We adjust this dynamic process as products change, as customer behavior changes and as changes in the market environment occur. As a result, our asset/liability management process has permitted us to manage interest rate risk successfully through several market cycles.
We use duration and convexity analyses to measure price sensitivity to interest rate changes. Duration measures the relative sensitivity of the fair value of a financial instrument to changes in interest rates. Convexity measures the rate of change in duration with respect to changes in interest rates. We use asset/liability management and derivative strategies to manage our interest rate exposure by matching the relative sensitivity of asset and liability values to interest rate changes, or by controlling the “duration mismatch” of assets and liability duration targets. In certain markets, capital market limitations that hinder our ability to acquire assets that approximate the duration of some of our liabilities are considered in setting duration targets. We consider risk-based capital and tax implications as well as current market conditions in our asset/liability management strategies.
The Company also mitigates interest rate risk through a market value adjusted (“MVA”) provision on certain of the Company’s annuity products' fixed investment options. This MVA provision limits interest rate risk by subjecting the contractholder to an MVA when funds are withdrawn or transferred to variable investment options before the end of the guarantee period. In the event of rising interest rates, which generally make the fixed maturity securities underlying the guarantee less valuable, the MVA could be negative. In the event of declining interest rates, which generally make the fixed maturity securities underlying the guarantee more valuable, the MVA could be positive. The resulting increase or decrease in the value of the fixed option, from calculation of the MVA, is designed to offset the decrease or increase in the market value of the securities underlying the guarantee.
We assess the impact of interest rate movements on the value of our financial assets, financial liabilities and derivatives using hypothetical test scenarios that assume either upward or downward 100 basis point parallel shifts in the yield curve from prevailing interest rates, reflecting changes in either credit spreads or the risk-free rate. The following table sets forth the net estimated potential loss in fair value on these financial instruments from a hypothetical 100 basis point upward shift as of December 31, 2025 and 2024. This table is presented on a gross basis and excludes offsetting impacts to certain insurance liabilities that are not considered financial liabilities under U.S. GAAP. This scenario results in the greatest net exposure to interest rate risk of the hypothetical scenarios tested at those dates. While the test scenario is for illustrative purposes only and does not reflect our expectations regarding future interest rates or the performance of fixed income markets, it is a near-term, reasonably possible hypothetical change that illustrates the potential impact of such events. These test scenarios do not measure the changes in value that could result from non-parallel shifts in the yield curve which we would expect to produce different changes in discount rates for different maturities. As a result, the actual loss in fair value from a 100 basis point change in interest rates could be different from that indicated by these calculations. The estimated changes in fair values do not include separate account assets.
66
| December 31, 2025 | December 31, 2024 | |||||||||||||||||||||||||||||||||||||
| Notional | Fair Value | Hypothetical Change in Fair Value | Notional | Fair Value | Hypothetical Change in Fair Value | |||||||||||||||||||||||||||||||||
| (in millions) | ||||||||||||||||||||||||||||||||||||||
| Financial assets with interest rate risk: | ||||||||||||||||||||||||||||||||||||||
| Fixed maturities(1) | $ | 48,981 | $ | (2,402) | $ | 36,320 | $ | (1,848) | ||||||||||||||||||||||||||||||
| Policy loans | 1,667 | 0 | 1,541 | 0 | ||||||||||||||||||||||||||||||||||
| Commercial mortgage and other loans | 10,114 | (334) | 7,535 | (274) | ||||||||||||||||||||||||||||||||||
| Derivatives: | ||||||||||||||||||||||||||||||||||||||
| Futures | $ | 2,913 | (2) | 28 | $ | 3,321 | (6) | 31 | ||||||||||||||||||||||||||||||
| Swaps | 231,245 | (11,677) | (1,188) | 203,928 | (11,543) | (1,182) | ||||||||||||||||||||||||||||||||
| Options | 226,292 | 29 | 260 | 146,242 | (391) | 12 | ||||||||||||||||||||||||||||||||
| Forwards | 2,388 | (11) | 0 | 1,147 | 30 | 0 | ||||||||||||||||||||||||||||||||
| Synthetic GICs | 4,186 | 0 | 0 | 3,959 | 0 | 3 | ||||||||||||||||||||||||||||||||
| Indexed universal life contracts | (2,102) | 363 | (1,313) | 179 | ||||||||||||||||||||||||||||||||||
| Indexed annuity contracts | (16,504) | 183 | (11,312) | 159 | ||||||||||||||||||||||||||||||||||
| Total embedded derivatives(2) | (18,606) | 546 | (12,625) | 338 | ||||||||||||||||||||||||||||||||||
| Financial liabilities with interest rate risk(3): | ||||||||||||||||||||||||||||||||||||||
| Policyholders' account balances-investment contracts | 15,630 | 6 | 10,811 | 6 | ||||||||||||||||||||||||||||||||||
| Insurance liabilities with interest rate risk: | ||||||||||||||||||||||||||||||||||||||
| Benefit reserves (traditional and limited-payment contracts)(4) | 8,227 | 655 | 7,514 | 570 | ||||||||||||||||||||||||||||||||||
| Market risk benefits(5) | 2,839 | 1,243 | 2,488 | 1,506 | ||||||||||||||||||||||||||||||||||
| Net estimated potential loss | $ | (1,186) | $ | (838) | ||||||||||||||||||||||||||||||||||
(1)Includes assets classified as “Fixed maturities, available-for-sale, at fair value” and “Fixed maturities, trading, at fair value”. Changes in fair value of fixed maturities classified as available-for-sale are included in AOCI. Excludes financial assets that are considered Funds Withheld, where the economic benefits and investment risk associated with the Funds Withheld assets ultimately inure to the reinsurer. Prior period amounts have been updated to conform to current period presentation.
(2)Excludes any offsetting impact of derivative instruments purchased to hedge changes in the embedded derivatives. Amounts reported gross of reinsurance.
(3)Excludes approximately $91 billion and $76 billion as of December 31, 2025 and 2024, respectively, of certain insurance reserve and deposit liabilities that are not considered financial liabilities. We believe that the interest rate sensitivities of these insurance liabilities would serve as an offset to the net interest rate risk of the financial assets and liabilities, including investment contracts.
(4)Changes in fair value of benefit reserves (traditional and limited-payment contracts) are included in AOCI.
(5)Amounts reported gross of reinsurance.
Under U.S. GAAP, the fair value of the MRBs and embedded derivatives for certain features associated with indexed universal life, and indexed annuity contracts, reflected in the table above, includes the impact of the market’s perception of our NPR. For additional information regarding the key estimates and assumptions used in our determination of fair value, including NPR, see “Management’s Discussion and Analysis of Financial Condition and Results of Operations—Accounting Policies & Pronouncements—Application of Critical Accounting Estimates—Market Risk Benefits” above.
Market Risk Related to Equity Prices
We have exposure to equity price risk through our investments in equity securities, equity-based derivatives, MRBs and embedded derivatives associated with index-linked crediting features of universal life and annuity contracts. Changes in equity prices may impact other items including, but not limited to, the following:
•Asset-based fees earned on assets under management or contractholder account value; and
•Net exposure to the guarantees provided under certain products.
We manage equity price risk against benchmarks in respective markets. We benchmark our return on equity holdings against a blend of market indices, mainly the S&P 500 and Russell 2000 for U.S. equities. We benchmark foreign equities against the Tokyo Price Index, and the MSCI EAFE, a market index which captures large and mid cap representation across developed markets around the world, excluding the U.S. and Canada. We target price sensitivities that approximate those of the benchmark indices. For equity investments within the separate accounts, the investment risk is borne by the separate account contractholder rather than by the Company.
67
We estimate our equity risk from a hypothetical 10% decline in equity benchmark market levels. The following table sets forth the net estimated potential loss in fair value from such a decline as of December 31, 2025 and 2024. While these scenarios are for illustrative purposes only and do not reflect our expectations regarding future performance of equity markets or of our equity portfolio, they represent near-term reasonably possible hypothetical changes that illustrate the potential impact of such events. These scenarios consider only the direct impact on fair value of declines in equity benchmark market levels and not changes in asset-based fees recognized as revenue, or changes in assumptions such as market volatility or mortality, utilization or persistency rates in our variable annuity contracts that could also impact the fair value of our living benefit features. In addition, these scenarios do not reflect the impact of basis risk, such as potential differences in the performance of the investment funds underlying the variable annuity products relative to the market indices we use as a basis for developing our hedging strategy. The impact of basis risk could result in larger differences between the change in fair value of the equity-based derivatives and the related living benefit features in comparison to these scenarios. In calculating these amounts, we exclude separate account equity securities.
| December 31, 2025 | December 31, 2024 | |||||||||||||||||||||||||||||||||||||
| Notional | Fair Value | Hypothetical Change in Fair Value | Notional | Fair Value | Hypothetical Change in Fair Value | |||||||||||||||||||||||||||||||||
| (in millions) | ||||||||||||||||||||||||||||||||||||||
| Equity securities | $ | 2,870 | $ | (287) | $ | 2,624 | $ | (262) | ||||||||||||||||||||||||||||||
| Equity-based derivatives(1) | $ | 231,391 | 1,449 | (2,698) | $ | 141,934 | 707 | (1,582) | ||||||||||||||||||||||||||||||
| Indexed universal life contracts | (2,102) | 55 | (1,313) | 23 | ||||||||||||||||||||||||||||||||||
| Indexed annuity contracts | (16,504) | 3,158 | (11,312) | 2,345 | ||||||||||||||||||||||||||||||||||
| Total embedded derivatives(1)(2) | (18,606) | 3,213 | (12,625) | 2,368 | ||||||||||||||||||||||||||||||||||
| Market risk benefits(3) | 2,839 | (709) | 2,488 | (836) | ||||||||||||||||||||||||||||||||||
| Net estimated potential loss | $ | (481) | $ | (312) | ||||||||||||||||||||||||||||||||||
(1)The notional and fair value of equity-based derivatives and the fair value of embedded derivatives are also reflected in amounts under “Market Risk Related to Interest Rates” above and are not cumulative.
(2)Excludes any offsetting impact of derivative instruments purchased to hedge changes in the embedded derivatives. Amounts reported gross of reinsurance.
(3)Amounts reported gross of reinsurance.
Market Risk Related to Foreign Currency Exchange Rates
The Company is exposed to foreign currency exchange rate risk in its domestic general account investment portfolios. This risk arises primarily from investments that are denominated in foreign currencies. We manage this risk by hedging substantially all domestic foreign currency-denominated fixed-income investments into U.S. dollars. We generally do not hedge all of the foreign currency risk of our investments in equity securities of unaffiliated foreign entities.
Derivatives
We use derivative financial instruments primarily to reduce market risk from changes in interest rates, equity prices and foreign currency exchange rates, including their use to alter interest rate or foreign currency exposures arising from mismatches between assets and liabilities. Our derivatives primarily include swaps, futures, options and forward contracts that are exchange-traded or contracted in the OTC market.
Our derivatives also include interest rate guarantees we provide on our synthetic GIC products. Synthetic GICs simulate the performance of traditional insurance-related GICs but are accounted for as derivatives under U.S. GAAP due to the fact that the policyholders own the underlying assets, and we only provide a book value “wrap” on the customers’ funds, which are held in a client-owned trust. Additionally, our derivatives include embedded derivative instruments associated with the index-linked features of certain universal life and annuity products. For additional information regarding our derivative activities, see Note 5 to the Consolidated Financial Statements included in this prospectus.
Market Risk Related to Variable Annuity Products
The primary risk exposures of our variable annuity contracts relate to actual deviations from, or changes to, the assumptions used in the original pricing of these products, including capital markets assumptions such as equity market returns, interest rates, market volatility and actuarial assumptions. We manage our exposure to certain risks driven by fluctuations in capital markets primarily through a combination of product design features, such as an automatic rebalancing feature and/or inclusion in our ALM strategy. In addition, we may also utilize external reinsurance as a form of additional risk mitigation. Our guaranteed living and death benefit features on variable annuities are accounted for as MRBs and recorded at fair value. The market risk sensitivities associated with U.S. GAAP values of both the MRBs and the related derivatives used to hedge the changes in fair value of these MRBs are provided under “Market Risk Related to Interest Rates” and “Market Risk Related to Equity Prices” above.
For additional information regarding our risk management strategies, including our ALM strategy and product design features, see “Management’s Discussion and Analysis of Financial Condition and Results of Operations” above.
68
GLOSSARY: DEFINITIONS OF SPECIAL TERMS USED IN THIS PROSPECTUS
Capitalized terms used in this prospectus are defined herein or in the prospectus for your Contract.
Buffer – The level of protection from negative Index Return applied to amounts allocated to a Segment on the maturity date. Any negative Index Return in excess of the Buffer reduces the value of the Contract Fund.
Designated Transfers – Reoccurring monthly transfers to the Index Strategies.
Fixed Holding Account(s) – Account(s) that holds amounts designated for investment in Index Strategies prior to transfer on the next Segment start date(s). Each Index Strategy will have its own Fixed Holding Account.
Index (Indices) – The reference Index for each Index Strategy.
Index Growth Cap (“Cap” or “Cap Rate”) – Used in determining the maximum rate of return that may be credited to a Segment on the maturity date.
Index Growth Floor (“Floor”) – Used in determining the minimum rate of return that will be credited to a Segment on the maturity date.
Index Interest – The amount you receive on a Segment maturity date based on the performance of the Index, the terms of the Index Strategy and the amount in the Index Strategy Segment Base. Index Interest can be positive or negative, meaning you can lose principal and prior earnings.
Index Return – The percentage change in the Index Value from the Segment start date to the Segment maturity date, which is used to determine the Index Interest for an Index Strategy Segment. An Index Return is calculated by taking the Index Value on the Segment maturity date, minus the Index Value on the Segment start date, and then dividing the result by the Index Value on the Segment start date.
Index Strategy(ies) – Any index-linked investment option we make available that applies Index Interest, subject to any limitations on participation in Index performance.
Index Strategy Segment(s) (“Segment(s)”) – The investment period(s) of an Index Strategy. A new Segment is created on each Segment start date you allocate a portion of your total Contract Fund into an Index Strategy. A Segment ends on the Segment maturity date, which is the day any applicable Index Interest is calculated.
Index Strategy Segment Base – The amount of Contract Fund value allocated to an Index Strategy Segment on a Segment start date. The Index Strategy Segment Base is used in determining the value of an Index Strategy Segment prior to the Segment maturity date and the Index Interest applied on the Segment maturity date. During the Segment, the Index Strategy Segment Base can be reduced by any transfers, withdrawals, loans, and Contract charges.
Index Value – The value of the Index that is published by the Index provider, excluding any dividends that may be paid by the firms that comprise the Index, as of the close of business each day that Index is calculated. If there is no published value for an Index on a particular Valuation Day, the closing value of that Index on the most recent Valuation Day will be used.
Interim Value – For Index Strategies with a Buffer, the value of an Index Strategy Segment Base on any Valuation Day during an Index Strategy Segment other than the Segment start date and maturity date. It is a calculated value (as described in the Interim Value section). During a Segment, the Interim Value is included in the Contract Fund value and Cash Surrender Value.
Monthly Transfer Date – Each month the current value of the Fixed Holding Accounts (including any interest earned) is transferred into new Segments for the Index Strategies you selected.
Participation Rate – The percentage of any positive Index Return that will be used in calculating the Index Interest on the Segment maturity date.
Segment Maturity Allocation Program – Allows for the complete allocation of Index Strategy Segment maturity values to the Variable Index Options over consecutive Segment maturity cycles.
Spread – A percentage that reduces the value of positive Index Returns used in the calculation of Index Interest.
Step Rate – The minimum rate that may be credited to amounts allocated to a Segment on the maturity date if the Index Return is between zero and the minimum Step Rate.
Valuation Day – (1) Any day the New York Stock Exchange is open, and (2) any day the value of an Index is published.
i
APPENDIX A: INTERIM VALUE OF INDEX STRATEGIES SEGMENTS
Below is additional information regarding the Interim Value calculation.
The Interim Value for an Index Strategy Segment is equal to the sum of (1) and (2), where:
(1) Is equal to:
a.The Index Strategy Segment Base on the Valuation Day the Interim Value is calculated, reduced by;
b.The fair value of the replicating portfolio of options on the Index Segment start date, with straight-line amortization to the Segment maturity date;
(2) The fair value of the replicating portfolio of options
The options utilized to value the underlying options in the various Index Strategies depend on the Index Strategy chosen and are:
1.At-the-money-call option (AMC)
2.Out-of-the-money call option (OMC)
3.Out-of-the-money put option (OMP)
4.Binary call option (BC) (inclusive of the bull spread)
5.At-the-money put option (AMP)
6.Out-of-the-money binary put option (OMBP)
The replicating portfolio of options for each strategy type is as follows:
•Capped With Buffer Index Strategies
◦AMC – OMC – OMP
•Enhanced Cap Rate with Spread And Buffer Index Strategies
◦OMC(Spread) – OMC(Cap + Spread) – OMP
•Step Rate Plus With Buffer Index Strategies
◦(Step Rate * 1,000 * BC) + (Participation Rate * OMC) – OMP
•Dual Directional With Buffer Index Strategies
◦AMC + AMP – (OMC + 2 * OMP + Buffer * 1,000 * OMBP)
When we calculate the Interim Value, we obtain market data for derivative pricing each business day from outside vendors. If these values are available and we are delayed in receiving these values, and cannot calculate a new Interim Value, we will use the prior business day’s market data that we have on file for calculating Interim Value.
A-1
APPENDIX B: IMPORTANT INFORMATION ABOUT THE INDICES
About the S&P 500®
The S&P 500® is a product of S&P Dow Jones Indices LLC, a division of S&P Global, or its affiliates (“SPDJI”), and has been licensed for use by Prudential for itself and affiliates including Pruco Life Insurance Company (“Pruco Life”). Standard & Poor’s® and S&P® are registered trademarks of Standard & Poor’s Financial Services LLC, a division of S&P Global (“S&P”); Dow Jones® is a registered trademark of Dow Jones Trademark Holdings LLC (“Dow Jones”); and these trademarks have been licensed by Pruco Life. It is not possible to invest directly in an index. Pruco Life’s products are not sponsored, endorsed, sold or promoted by SPDJI, Dow Jones, S&P, any of their respective affiliates (collectively, “S&P Dow Jones Indices”). S&P Dow Jones Indices makes any representation or warranty, express or implied, to the owners of Pruco Life’s products or any member of the public regarding the advisability of investing in securities generally or in Pruco Life’s products particularly or the ability of the S&P 500® to track general market performance. Past performance of an index is not an indication or guarantee of future results. S&P Dow Jones Indices’ only relationship to Pruco Life with respect to the S&P 500® is the licensing of the Index and certain trademarks, service marks and/or trade names of S&P Dow Jones Indices and/or its licensors. The S&P 500® is determined, composed and calculated by S&P Dow Jones Indices without regard to Pruco Life or Pruco Life’s products. S&P Dow Jones Indices has no obligation to take the needs of Pruco Life or the owners of Pruco Life’s products into consideration in determining, composing or calculating the S&P 500®. S&P Dow Jones Indices is responsible for and have not participated in the determination of the prices, and amount of Pruco Life’s products or the timing of the issuance or sale of Pruco Life’s products or in the determination or calculation of the equation by which Pruco Life’s products are to be converted into cash, surrendered or redeemed, as the case may be. S&P Dow Jones Indices has no obligation or liability in connection with the administration, marketing or trading of Pruco Life’s products. There is no assurance that investment products based on the S&P 500® will accurately track index performance or provide positive investment returns. S&P Dow Jones Indices LLC is not an investment or tax advisor. A tax advisor should be consulted to evaluate the impact of any tax-exempt securities on portfolios and the tax consequences of making any particular investment decision. Inclusion of a security within an index is not a recommendation by S&P Dow Jones Indices to buy, sell, or hold such security, nor is it considered to be investment advice.
NEITHER S&P DOW JONES INDICES NOR THIRD PARTY LICENSOR GUARANTEES THE ADEQUACY, ACCURACY, TIMELINESS AND/OR THE COMPLETENESS OF THE S&P 500® OR ANY DATA RELATED THERETO OR ANY COMMUNICATION, INCLUDING BUT NOT LIMITED TO, ORAL OR WRITTEN COMMUNICATION (INCLUDING ELECTRONIC COMMUNICATIONS) WITH RESPECT THERETO. S&P DOW JONES INDICES SHALL NOT BE SUBJECT TO ANY DAMAGES OR LIABILITY FOR ANY ERRORS, OMISSIONS, OR DELAYS THEREIN. S&P DOW JONES INDICES MAKES NO EXPRESS OR IMPLIED WARRANTIES, AND EXPRESSLY DISCLAIMS ALL WARRANTIES, OF MERCHANTABILITY OR FITNESS FOR A PARTICULAR PURPOSE OR USE OR AS TO RESULTS TO BE OBTAINED BY PRUCO LIFE, OWNERS OF PRUCO LIFE’S PRODUCTS OR ANY OTHER PERSON OR ENTITY FROM THE USE OF THE S&P 500® OR WITH RESPECT TO ANY DATA RELATED THERETO. WITHOUT LIMITING ANY OF THE FOREGOING, IN NO EVENT WHATSOEVER SHALL S&P DOW JONES INDICES BE LIABLE FOR ANY INDIRECT, SPECIAL, INCIDENTAL, PUNITIVE, OR CONSEQUENTIAL DAMAGES INCLUDING BUT NOT LIMITED TO, LOSS OF PROFITS, TRADING LOSSES, LOST TIME OR GOODWILL, EVEN IF THEY HAVE BEEN ADVISED OF THE POSSIBILITY OF SUCH DAMAGES, WHETHER IN CONTRACT, TORT, STRICT LIABILITY, OR OTHERWISE. THERE ARE NO THIRD-PARTY BENEFICIARIES OF ANY AGREEMENTS OR ARRANGEMENTS BETWEEN S&P DOW JONES INDICES AND PRUCO LIFE OTHER THAN THE LICENSORS OF S&P DOW JONES INDICES.
B-1
APPENDIX C
C-1
ITEM 8. FINANCIAL STATEMENTS AND SUPPLEMENTARY DATA
PRUCO LIFE INSURANCE COMPANY
CONSOLIDATED FINANCIAL STATEMENTS INDEX
| Page | |||||
| Management’s Annual Report on Internal Control Over Financial Reporting | |||||
Report of Independent Registered Public Accounting Firm (PCAOB ID | |||||
| Consolidated Statements of Financial Position as of December 31, 2025 and 2024 | |||||
| Consolidated Statements of Operations and Comprehensive Income (Loss) for the years ended December 31, 2025, 2024, and 2023 | |||||
| Consolidated Statements of Equity for the years ended December 31, 2025, 2024, and 2023 | |||||
| Consolidated Statements of Cash Flows for the years ended December 31, 2025, 2024, and 2023 | |||||
| Notes to Consolidated Financial Statements: | |||||
| 1. Business and Basis of Presentation | |||||
| 2. Significant Accounting Policies and Pronouncements | |||||
| 3. Investments | |||||
| 4. Variable Interest Entities | |||||
| 5. Derivatives and Hedging | |||||
| 6. Fair Value of Assets and Liabilities | |||||
| 7. Deferred Policy Acquisition Costs, Deferred Reinsurance, and Deferred Sales Inducements | |||||
| 8. Separate Accounts | |||||
| 9. Liability for Future Policy Benefits | |||||
| 10. Policyholders' Account Balances | |||||
| 11. Market Risk Benefits | |||||
| 12. Reinsurance | |||||
| 13. Income Taxes | |||||
| 14. Equity | |||||
| 15. Statutory Net Income and Surplus and Dividend Restrictions | |||||
| 16. Related Party Transactions | |||||
| 17. Commitments and Contingent Liabilities | |||||
2
Management’s Annual Report on Internal Control Over Financial Reporting
Management of Pruco Life Insurance Company (together with its consolidated subsidiaries, the “Company”) is responsible for establishing and maintaining adequate internal control over financial reporting. Management conducted an assessment of the effectiveness, as of December 31, 2025, of the Company’s internal control over financial reporting, based on the framework established in Internal Control—Integrated Framework (2013) issued by the Committee of Sponsoring Organizations of the Treadway Commission ("COSO"). Based on our assessment under that framework, management concluded that the Company’s internal control over financial reporting was effective as of December 31, 2025.
Our internal control over financial reporting is a process designed by or under the supervision of our principal executive and principal financial officers to provide reasonable assurance regarding the reliability of financial reporting and the preparation of financial statements for external purposes in accordance with generally accepted accounting principles. Our internal control over financial reporting includes policies and procedures that (1) pertain to the maintenance of records that, in reasonable detail, accurately and fairly reflect transactions and dispositions of assets; (2) provide reasonable assurance that transactions are recorded as necessary to permit preparation of financial statements in accordance with generally accepted accounting principles, and that receipts and expenditures are being made only in accordance with authorizations of management and the directors of the Company; and (3) provide reasonable assurance regarding prevention or timely detection of unauthorized acquisition, use, or disposition of the Company’s assets that could have a material effect on our financial statements.
Because of its inherent limitations, internal control over financial reporting may not prevent or detect misstatements. Also, projections of any evaluation of effectiveness to future periods are subject to the risk that controls may become inadequate because of changes in conditions, or that the degree of compliance with the policies or procedures may deteriorate.
This Annual Report does not include an attestation report of the Company’s registered public accounting firm, PricewaterhouseCoopers LLP, regarding the internal control over financial reporting. Management’s report was not subject to attestation by the Company’s registered public accounting firm pursuant to rules of the Securities and Exchange Commission that permit the Company to provide only management’s report in this Annual Report.
March 6, 2026
3
Report of Independent Registered Public Accounting Firm
To the Board of Directors and Stockholder of Pruco Life Insurance Company
Opinion on the Financial Statements
We have audited the accompanying consolidated statements of financial position of Pruco Life Insurance Company and its subsidiaries (the "Company") as of December 31, 2025 and 2024, and the related consolidated statements of operations and comprehensive income (loss), of equity and of cash flows for each of the three years in the period ended December 31, 2025, including the related notes and financial statement schedules listed in the index appearing under Item 15(a)(2) (collectively referred to as the “consolidated financial statements”). In our opinion, the consolidated financial statements present fairly, in all material respects, the financial position of the Company as of December 31, 2025 and 2024, and the results of its operations and its cash flows for each of the three years in the period ended December 31, 2025 in conformity with accounting principles generally accepted in the United States of America.
Basis for Opinion
These consolidated financial statements are the responsibility of the Company’s management. Our responsibility is to express an opinion on the Company’s consolidated financial statements based on our audits. We are a public accounting firm registered with the Public Company Accounting Oversight Board (United States) (PCAOB) and are required to be independent with respect to the Company in accordance with the U.S. federal securities laws and the applicable rules and regulations of the Securities and Exchange Commission and the PCAOB.
We conducted our audits of these consolidated financial statements in accordance with the standards of the PCAOB. Those standards require that we plan and perform the audits to obtain reasonable assurance about whether the consolidated financial statements are free of material misstatement, whether due to error or fraud. The Company is not required to have, nor were we engaged to perform, an audit of its internal control over financial reporting. As part of our audits we are required to obtain an understanding of internal control over financial reporting but not for the purpose of expressing an opinion on the effectiveness of the Company's internal control over financial reporting. Accordingly, we express no such opinion.
Our audits included performing procedures to assess the risks of material misstatement of the consolidated financial statements, whether due to error or fraud, and performing procedures that respond to those risks. Such procedures included examining, on a test basis, evidence regarding the amounts and disclosures in the consolidated financial statements. Our audits also included evaluating the accounting principles used and significant estimates made by management, as well as evaluating the overall presentation of the consolidated financial statements. We believe that our audits provide a reasonable basis for our opinion.
Critical Audit Matters
The critical audit matter communicated below is a matter arising from the current period audit of the consolidated financial statements that was communicated or required to be communicated to the audit committee and that (i) relates to accounts or disclosures that are material to the consolidated financial statements and (ii) involved our especially challenging, subjective, or complex judgments. The communication of critical audit matters does not alter in any way our opinion on the consolidated financial statements, taken as a whole, and we are not, by communicating the critical audit matter below, providing a separate opinion on the critical audit matter or on the accounts or disclosures to which it relates.
Valuation of Guaranteed Benefit Features Associated with Certain Annuity and Life Products Included in the Market Risk Benefits and the Liability for Future Policy Benefits
As described in Notes 2, 6, 9 and 11 to the consolidated financial statements, the Company issues certain annuity and life contracts which contain guaranteed benefit features. Certain of the guarantees associated with variable annuity contracts are accounted for as market risk benefits. The market risk benefits represent contracts or contract features that expose the Company to other than nominal capital market risk, primarily related to deferred annuities with guaranteed minimum benefits. The benefits are accounted for using a fair value measurement methodology. The fair value of market risk benefits is calculated as the present value of expected future benefit payments to contractholders less the present value of expected future fees attributable to the market risk benefits, based on assumptions a market participant would use in valuing the market risk benefits. On a quarterly basis, changes in the fair value of market risk benefits are recorded in net income, net of related hedges, except for the portion of the change attributable to changes in the Company’s non-performance risk which is recorded in other comprehensive income. This methodology could result in either a liability or asset balance, given changing capital market conditions and various actuarial assumptions. As of December 31, 2025, the fair value of the obligations associated with these guarantees accounted for as market risk benefit assets was $2.65 billion and for market risk benefit liabilities was $4.30 billion. As there is no observable active market for the transfer of these obligations, the
4
valuations are calculated using internally-developed models with option pricing techniques. The models are based on a risk neutral valuation framework and incorporate premiums for risks inherent in valuation techniques, inputs, and the general uncertainty around the timing and amount of future cash flows. The significant inputs to the valuation models for these market risk benefits include capital market assumptions, such as interest rate levels and volatility assumptions, the Company’s market-perceived non-performance risk under the contract, as well as actuarially determined assumptions, including contractholder behavior, such as lapse rates, benefit utilization rates, withdrawal rates and mortality rates (collectively, the significant market risk benefit assumptions). For certain life insurance products that include certain other contract features, including no-lapse guarantees, additional insurance reserves are established when associated assessments are recognized. The liability for no-lapse guarantee features is included within the additional insurance reserves balance in Note 9. As of December 31, 2025, the additional insurance reserve was $18.52 billion, recorded within the liability for future policy benefits. As disclosed by management, this liability is established using current best estimate assumptions, including mortality rates, lapse rates, and premium pattern rates, as well as interest rate and equity market return assumptions (collectively, the significant additional insurance reserve assumptions), and is based on the ratio of the present value of total expected excess payments (i.e., payments in excess of account value) over the life of the contract divided by the present value of total expected assessments (i.e., benefit ratio). The liability equals the current benefit ratio multiplied by cumulative assessments recognized to date, plus interest, less cumulative excess payments to date.
The principal considerations for our determination that performing procedures relating to the valuation of guaranteed benefit features associated with certain annuity and life products that are accounted for as market risk benefits and those that are included in the liability for future policy benefits is a critical audit matter are (i) the significant judgment by management when determining the valuation model for the benefit features accounted for as market risk benefits due to the lack of an observable market for these guarantees and when developing the aforementioned significant assumptions for the guaranteed benefit features accounted for as market risk benefits and additional insurance reserves, (ii) a high degree of auditor judgment, subjectivity and effort in performing procedures and evaluating audit evidence related to management's model for market risk benefits recorded at fair value and the aforementioned assumptions used by management in the valuation of the liabilities for the guaranteed benefit features accounted for as market risk benefits and additional insurance reserves, and (iii) the audit effort involved the use of professionals with specialized skill and knowledge.
Addressing the matter involved performing procedures and evaluating audit evidence in connection with forming our overall opinion on the consolidated financial statements. These procedures included testing the effectiveness of controls relating to the valuation of guaranteed benefit features associated with certain annuity and life products included in market risk benefits and the liability for future policy benefits, including controls over the model for the benefit features accounted for as market risk benefits and development of the assumptions used in the valuation of the liabilities for the guaranteed benefit features accounted for as market risk benefits and additional insurance reserves. These procedures also included, among others, (i) testing management’s process for determining the valuation of guaranteed benefit features associated with certain annuity and life products included in market risk benefits and the liability for future policy benefits, (ii) the use of professionals with specialized skill and knowledge to assist in evaluating (a) the appropriateness of management’s model for market risk benefits recorded at fair value and (b) the reasonableness of the aforementioned assumptions used in the valuation based on industry knowledge and data as well as historical Company data and experience. The procedures also included testing the completeness and accuracy of data used to develop the aforementioned assumptions and testing that the aforementioned assumptions are accurately reflected in the models.
/s/ PricewaterhouseCoopers LLP
March 6, 2026
We have served as the Company's auditor since 1996.
5
PRUCO LIFE INSURANCE COMPANY
Consolidated Statements of Financial Position
December 31, 2025 and 2024 (in thousands, except share amounts)
| December 31, 2025 | December 31, 2024 | ||||||||||
| ASSETS | |||||||||||
Fixed maturities, available-for-sale, at fair value (allowance for credit losses: 2025 – $ 2024 – $ | $ | $ | |||||||||
Fixed maturities, trading, at fair value (amortized cost: 2025 – $ | |||||||||||
Equity securities, at fair value (cost: 2025 – $ | |||||||||||
| Policy loans | |||||||||||
Short-term investments (net of allowance for credit losses: 2025 – $ | |||||||||||
Commercial mortgage and other loans (net of $ | |||||||||||
Other invested assets (includes $ | |||||||||||
| Total investments | |||||||||||
| Cash and cash equivalents(1) | |||||||||||
| Deferred policy acquisition costs | |||||||||||
| Accrued investment income(1) | |||||||||||
Reinsurance recoverables and deposit receivables (net of $ | |||||||||||
| Receivables from parent and affiliates | |||||||||||
| Deferred sales inducements | |||||||||||
| Income tax assets(1) | |||||||||||
| Market risk benefit assets | |||||||||||
| Other assets(1) | |||||||||||
| Separate account assets | |||||||||||
| TOTAL ASSETS | $ | $ | |||||||||
| LIABILITIES AND EQUITY | |||||||||||
| LIABILITIES | |||||||||||
| Policyholders’ account balances | $ | $ | |||||||||
| Future policy benefits | |||||||||||
| Market risk benefit liabilities | |||||||||||
| Cash collateral for loaned securities | |||||||||||
Reinsurance and funds withheld payables (includes $ | |||||||||||
| Payables to parent and affiliates(1) | |||||||||||
| Other liabilities(1) | |||||||||||
| Separate account liabilities | |||||||||||
| Total liabilities | |||||||||||
COMMITMENTS AND CONTINGENT LIABILITIES (See Note 17) | |||||||||||
| EQUITY | |||||||||||
Common stock ($ | |||||||||||
| Additional paid-in capital | |||||||||||
| Retained earnings / (accumulated deficit) | |||||||||||
| Accumulated other comprehensive income (loss) | ( | ||||||||||
| Total Pruco Life Insurance Company equity | |||||||||||
| Noncontrolling interests | |||||||||||
| Total equity | |||||||||||
| TOTAL LIABILITIES AND EQUITY | $ | $ | |||||||||
(1) See Note 4 for details of balances associated with variable interest entities.
See Notes to Consolidated Financial Statements
6
PRUCO LIFE INSURANCE COMPANY
Consolidated Statements of Operations and Comprehensive Income (Loss)
Years Ended December 31, 2025, 2024, and 2023 (in thousands)
| 2025 | 2024 | 2023 | ||||||||||||||||||
| REVENUES | ||||||||||||||||||||
Premiums (includes $ | $ | $ | $ | |||||||||||||||||
| Policy charges and fee income | ||||||||||||||||||||
| Net investment income | ||||||||||||||||||||
| Asset administration fees | ||||||||||||||||||||
| Other income (loss) | ||||||||||||||||||||
| Realized investment gains (losses), net | ( | ( | ||||||||||||||||||
| Change in value of market risk benefits, net of related hedging gains (losses) | ( | ( | ( | |||||||||||||||||
| TOTAL REVENUES | ||||||||||||||||||||
| BENEFITS AND EXPENSES | ||||||||||||||||||||
| Policyholders’ benefits | ||||||||||||||||||||
| Change in estimates of liability for future policy benefits | ( | ( | ||||||||||||||||||
| Interest credited to policyholders’ account balances | ||||||||||||||||||||
| Amortization of deferred policy acquisition costs | ( | |||||||||||||||||||
| General, administrative and other expenses | ||||||||||||||||||||
| TOTAL BENEFITS AND EXPENSES | ||||||||||||||||||||
| INCOME (LOSS) FROM OPERATIONS BEFORE INCOME TAXES AND EQUITY IN EARNINGS OF OPERATING JOINT VENTURE | ||||||||||||||||||||
| Income tax expense (benefit) | ||||||||||||||||||||
INCOME (LOSS) FROM OPERATIONS BEFORE EQUITY IN EARNINGS OF OPERATING JOINT VENTURE | ||||||||||||||||||||
| Equity in earnings of operating joint venture, net of taxes | ( | ( | ( | |||||||||||||||||
| NET INCOME (LOSS) | $ | $ | $ | |||||||||||||||||
| Less: Income (loss) attributable to noncontrolling interests | ||||||||||||||||||||
| NET INCOME (LOSS) ATTRIBUTABLE TO PRUCO LIFE INSURANCE COMPANY | $ | $ | $ | |||||||||||||||||
| Other comprehensive income (loss), before tax: | ||||||||||||||||||||
| Foreign currency translation adjustments | ( | |||||||||||||||||||
| Net unrealized investment gains (losses) | ( | |||||||||||||||||||
| Interest rate remeasurement of future policy benefits | ( | ( | ||||||||||||||||||
| Gain (loss) from changes in non-performance risk on market risk benefits | ( | ( | ( | |||||||||||||||||
| Total | ( | ( | ||||||||||||||||||
| Less: Income tax expense (benefit) related to other comprehensive income (loss) | ( | ( | ||||||||||||||||||
| Other comprehensive income (loss), net of taxes | ( | ( | ||||||||||||||||||
| Comprehensive income (loss) | ||||||||||||||||||||
| Less: Comprehensive income (loss) attributable to noncontrolling interests | ||||||||||||||||||||
| Comprehensive income (loss) attributable to Pruco Life Insurance Company | $ | $ | $ | |||||||||||||||||
See Notes to Consolidated Financial Statements
7
PRUCO LIFE INSURANCE COMPANY
Consolidated Statements of Equity
Years Ended December 31, 2025, 2024, and 2023 (in thousands)
| Common Stock | Additional Paid-in Capital | Retained Earnings / (Accumulated Deficit) | Accumulated Other Comprehensive Income (Loss) | Total Pruco Life Insurance Company Equity | Noncontrolling Interests | Total Equity | ||||||||||||||||||||||||||||||||||||||
| Balance, December 31, 2022 | $ | $ | $ | ( | $ | ( | $ | $ | $ | |||||||||||||||||||||||||||||||||||
| Return of capital | ( | ( | ( | |||||||||||||||||||||||||||||||||||||||||
| Contributed capital | ||||||||||||||||||||||||||||||||||||||||||||
| Contributions from noncontrolling interests | ||||||||||||||||||||||||||||||||||||||||||||
| Contributed (distributed) capital-parent/child asset transfers | ||||||||||||||||||||||||||||||||||||||||||||
| Comprehensive income (loss): | ||||||||||||||||||||||||||||||||||||||||||||
| Net income (loss) | ||||||||||||||||||||||||||||||||||||||||||||
| Other comprehensive income (loss), net of tax | ( | ( | ( | |||||||||||||||||||||||||||||||||||||||||
| Total comprehensive income (loss) | ( | |||||||||||||||||||||||||||||||||||||||||||
| Balance, December 31, 2023 | ( | ( | ||||||||||||||||||||||||||||||||||||||||||
| Return of capital | ( | ( | ( | |||||||||||||||||||||||||||||||||||||||||
| Contributed capital | ||||||||||||||||||||||||||||||||||||||||||||
| Contributions from noncontrolling interests | ||||||||||||||||||||||||||||||||||||||||||||
| Distributions to noncontrolling interests | ( | ( | ||||||||||||||||||||||||||||||||||||||||||
| Contributed (distributed) capital-parent/child asset transfers | ||||||||||||||||||||||||||||||||||||||||||||
| Comprehensive income (loss): | ||||||||||||||||||||||||||||||||||||||||||||
| Net income (loss) | ||||||||||||||||||||||||||||||||||||||||||||
| Other comprehensive income (loss), net of tax | ( | ( | ( | |||||||||||||||||||||||||||||||||||||||||
| Total comprehensive income (loss) | ( | |||||||||||||||||||||||||||||||||||||||||||
| Balance, December 31, 2024 | ( | |||||||||||||||||||||||||||||||||||||||||||
| Contributed capital | ||||||||||||||||||||||||||||||||||||||||||||
| Contributions from noncontrolling interests | ||||||||||||||||||||||||||||||||||||||||||||
| Distributions to noncontrolling interests | ( | ( | ||||||||||||||||||||||||||||||||||||||||||
| Contributed (distributed) capital-parent/child asset transfers | ||||||||||||||||||||||||||||||||||||||||||||
| Comprehensive income (loss): | ||||||||||||||||||||||||||||||||||||||||||||
| Net income (loss) | ||||||||||||||||||||||||||||||||||||||||||||
| Other comprehensive income (loss), net of tax | ||||||||||||||||||||||||||||||||||||||||||||
| Total comprehensive income (loss) | ||||||||||||||||||||||||||||||||||||||||||||
| Balance, December 31, 2025 | $ | $ | $ | $ | $ | $ | $ | |||||||||||||||||||||||||||||||||||||
See Notes to Consolidated Financial Statements
8
PRUCO LIFE INSURANCE COMPANY
Consolidated Statements of Cash Flows
Years Ended December 31, 2025, 2024, and 2023 (in thousands)
| 2025 | 2024 | 2023 | ||||||||||||||||||
| CASH FLOWS FROM OPERATING ACTIVITIES: | ||||||||||||||||||||
| Net income (loss) | $ | $ | $ | |||||||||||||||||
| Adjustments to reconcile net income (loss) to net cash provided by (used in) operating activities: | ||||||||||||||||||||
| Policy charges and fee income | ( | |||||||||||||||||||
| Interest credited to policyholders’ account balances | ||||||||||||||||||||
| Realized investment (gains) losses, net | ( | |||||||||||||||||||
| Change in value of market risk benefits, net of related hedging (gains) losses | ||||||||||||||||||||
| Change in: | ||||||||||||||||||||
| Future policy benefits and other insurance liabilities | ||||||||||||||||||||
| Reinsurance related-balances | ( | ( | ( | |||||||||||||||||
| Accrued investment income | ( | ( | ( | |||||||||||||||||
| Net payables to (receivables from) parent and affiliates | ( | ( | ( | |||||||||||||||||
| Deferred policy acquisition costs | ( | ( | ( | |||||||||||||||||
| Income taxes | ( | ( | ||||||||||||||||||
| Derivatives, net | ( | |||||||||||||||||||
| Other, net | ( | ( | ( | |||||||||||||||||
| Cash flows from (used in) operating activities | ||||||||||||||||||||
| CASH FLOWS FROM INVESTING ACTIVITIES: | ||||||||||||||||||||
| Proceeds from the sale/maturity/prepayment of: | ||||||||||||||||||||
| Fixed maturities, available-for-sale | ||||||||||||||||||||
| Fixed maturities, trading | ||||||||||||||||||||
| Equity securities | ||||||||||||||||||||
| Policy loans | ||||||||||||||||||||
| Ceded policy loans | ( | ( | ( | |||||||||||||||||
| Short-term investments | ||||||||||||||||||||
| Commercial mortgage and other loans | ||||||||||||||||||||
| Other invested assets | ||||||||||||||||||||
| Notes receivable from parent and affiliates | ||||||||||||||||||||
| Payments for the purchase/origination of: | ||||||||||||||||||||
| Fixed maturities, available-for-sale | ( | ( | ( | |||||||||||||||||
| Fixed maturities, trading | ( | ( | ( | |||||||||||||||||
| Equity securities | ( | ( | ( | |||||||||||||||||
| Policy loans | ( | ( | ( | |||||||||||||||||
| Ceded policy loans | ||||||||||||||||||||
| Short-term investments | ( | ( | ( | |||||||||||||||||
| Commercial mortgage and other loans | ( | ( | ( | |||||||||||||||||
| Other invested assets | ( | ( | ( | |||||||||||||||||
| Notes receivable from parent and affiliates | ( | ( | ( | |||||||||||||||||
| Derivatives, net | ( | ( | ||||||||||||||||||
| Other, net | ( | ( | ( | |||||||||||||||||
| Cash flows from (used in) investing activities | ( | ( | ( | |||||||||||||||||
9
| 2025 | 2024 | 2023 | ||||||||||||||||||
| CASH FLOWS FROM FINANCING ACTIVITIES: | ||||||||||||||||||||
| Policyholders’ account deposits | ||||||||||||||||||||
| Affiliated ceded policyholders’ account deposits | ( | ( | ( | |||||||||||||||||
| Policyholders’ account withdrawals | ( | ( | ( | |||||||||||||||||
| Affiliated ceded policyholders’ account withdrawals | ||||||||||||||||||||
Net change in securities sold under agreement to repurchase and cash collateral for loaned securities | ( | ( | ||||||||||||||||||
| Contributed capital | ||||||||||||||||||||
| Return of capital | ( | ( | ||||||||||||||||||
| Contributed (distributed) capital - parent/child asset transfers | ||||||||||||||||||||
| Net change in all other financing arrangements (maturities 90 days or less) | ( | |||||||||||||||||||
| Repayments of debt (maturities longer than 90 days) | ( | ( | ||||||||||||||||||
| Drafts outstanding | ( | ( | ( | |||||||||||||||||
| Contributions from noncontrolling interests | ||||||||||||||||||||
| Distributions to noncontrolling interests | ( | ( | ||||||||||||||||||
| Other, net | ( | |||||||||||||||||||
| Cash flows from (used in) financing activities | ||||||||||||||||||||
| NET INCREASE (DECREASE) IN CASH AND CASH EQUIVALENTS | ( | ( | ||||||||||||||||||
| CASH AND CASH EQUIVALENTS, BEGINNING OF YEAR | ||||||||||||||||||||
| CASH AND CASH EQUIVALENTS, END OF YEAR | $ | $ | $ | |||||||||||||||||
| SUPPLEMENTAL CASH FLOW INFORMATION | ||||||||||||||||||||
| Income taxes paid (refunded), net(1) | $ | $ | $ | |||||||||||||||||
| Interest paid | $ | $ | $ | |||||||||||||||||
(1) See Note 13 for additional information regarding the income taxes paid (refunded), net amount by jurisdiction for the year ended December 31, 2025.
Significant Non-Cash Transactions During The Year
2025
"Cash flows from (used in) operating activities" for the year ended December 31, 2025 excludes certain non-cash activities in the amount of $(1,397 ) million related to the affiliated reinsurance transaction with The Prudential Insurance Company of America ("Prudential Insurance") effective October 1, 2025. See Note 12 for additional information.
2024
"Cash flows from (used in) operating activities" and "Cash flows from (used in) investing activities" for the year ended December 31, 2024, excludes certain non-cash activities in the amount of $(7,469 ) million primarily related to reinsurance recoverables and $6,722 million related to invested asset transfers, respectively. These transactions are associated with the unaffiliated reinsurance agreement with Wilton Reassurance Company and Wilton Reinsurance Bermuda Limited (collectively, "Wilton Re"), effective October 1, 2024. Associated with the transaction with Wilton Re, "Cash flows from (used in) operating activities" and "Cash flows from (used in) investing activities" for the year ended December 31, 2024, exclude largely offsetting affiliated non-cash activities in the amount of $7,218 million, primarily related to reinsurance recoverables and payables, and $(6,722 ) million related to invested asset transfers, respectively. These are related to the recapture of the risks associated with the business that had previously been reinsured with Prudential Arizona Reinsurance Universal Company ("PAR U"). See Note 12 for additional information.
"Cash flows from (used in) operating activities" for the year ended December 31, 2024 excludes certain non-cash activities in the amount of $(102 ) million related to the affiliated reinsurance transaction with Prudential Arizona Reinsurance Captive Company ("PARCC"), effective October 1, 2024. See Note 12 for additional information.
"Cash flows from (used in) operating activities" for the year ended December 31, 2024 excludes certain non-cash activities in the amount of $1,129 million related to the affiliated reinsurance transaction with Prudential Universal Reinsurance Entity Company ("PURE") and Prudential Insurance, effective January 1, 2024. See Note 12 for additional information.
"Cash flows from (used in) investing activities" and "Cash flows from (used in) financing activities" for the year ended December 31, 2024 excludes non-cash activities related to invested asset transfers in the amount of $416 million, related to capital contributions the Company received from Prudential Insurance. See Note 16 for additional information.
10
2023
"Cash flows from (used in) operating activities" for the year ended December 31, 2023 excludes certain non-cash activities in the amount of $475 million related to the novated indexed variable annuities under the reinsurance agreement with Fortitude Life Insurance & Annuity Company (“FLIAC”). See Note 12 for more details regarding this transaction.
See Notes to Consolidated Financial Statements
11
PRUCO LIFE INSURANCE COMPANY
Notes to Consolidated Financial Statements
1. BUSINESS AND BASIS OF PRESENTATION
Pruco Life Insurance Company, (“Pruco Life”) is a wholly-owned subsidiary of Prudential Insurance, which in turn is a direct wholly-owned subsidiary of Prudential Financial, Inc. (“Prudential Financial”). Pruco Life is a stock life insurance company organized in 1971 under the laws of the State of Arizona. It is licensed to sell life insurance and annuities in the District of Columbia, Guam and in all states except New York, and sells such products primarily through affiliated and unaffiliated distributors.
Pruco Life has one wholly-owned insurance subsidiary, Pruco Life Insurance Company of New Jersey, (“PLNJ”). PLNJ is a stock life insurance company organized in 1982 under the laws of the State of New Jersey. It is licensed to sell life insurance and annuities in New Jersey and New York only. Pruco Life and its subsidiaries are together referred to as the "Company", "we" or "our" and all financial information is shown on a consolidated basis.
Basis of Presentation
The Consolidated Financial Statements have been prepared in accordance with generally accepted accounting principles in the United States of America (“U.S. GAAP”). The Consolidated Financial Statements include the accounts of Pruco Life and entities over which the Company exercises control, including majority-owned subsidiaries, and variable interest entities ("VIEs") in which the Company is considered the primary beneficiary. Intercompany balances and transactions have been eliminated.
Segment Information
Although there are separate products within Pruco Life, the Company is organized as a single reportable segment and manages the business activities on a consolidated basis. The accounting policies are the same as those described in Note 2.
The Company analyzes operating performance using “Income (loss) from operations before income taxes and equity in earnings of operating joint venture”, as determined in accordance with U.S. GAAP. This is the measure of profit or loss used by the Company’s chief operating decision maker to evaluate performance and allocate resources. The measure of segment assets is reported as “Total Assets” on the Consolidated Statements of Financial Position. Segment revenue is reported as “Total Revenues” on the Consolidated Statements of Operations and Comprehensive Income (Loss). As the Company has one reportable segment, there are no intersegment revenues. The Company discloses all significant expense categories separately on the Consolidated Statements of Operations and Comprehensive Income (Loss).
The Company’s chief operating decision maker is a group of Prudential Financial executives that include the chief financial officer, controller, treasurer, and business leaders, which include the Company’s chief executive officer and chief financial officer. Overall business decisions for the Company are made by this group of executives. Such business decisions include the allocation of capital, distribution/sale of products, and allocation/deployment of overall Prudential Financial resources.
Use of Estimates
The preparation of financial statements in conformity with U.S. GAAP requires management to make estimates and assumptions that affect the reported amounts of assets and liabilities and disclosure of contingent assets and liabilities as of the date of the financial statements and the reported amounts of revenues and expenses during the reporting period. Actual results could differ from those estimates.
The most significant estimates include those used in determining future policy benefits; policyholders' account balances and reinsurance related to the fair value of embedded derivative instruments associated with the index-linked features of certain universal life and annuity products; market risk benefits; the valuation of investments including derivatives, the measurement of allowance for credit losses, and the recognition of other-than-temporary impairments; reinsurance recoverables; any provision for income taxes and valuation of deferred tax assets; and accruals for contingent liabilities, including estimates for losses in connection with unresolved legal and regulatory matters.
Reclassifications
Certain amounts in prior periods have been reclassified to conform to the current period presentation.
12
PRUCO LIFE INSURANCE COMPANY
Notes to Consolidated Financial Statements—(Continued)
2. SIGNIFICANT ACCOUNTING POLICIES AND PRONOUNCEMENTS
ASSETS
Fixed maturities, available-for-sale, at fair value ("AFS debt securities") includes bonds, notes and redeemable preferred stock that are carried at fair value. See Note 6 for additional information regarding the determination of fair value. The purchased cost of fixed maturities is adjusted for amortization of premiums and accretion of discounts to maturity or, if applicable, call date.
AFS debt securities, where fair value is below amortized cost, are reviewed quarterly to determine whether the amortized cost basis of the security is recoverable. For mortgage-backed and asset-backed AFS debt securities, a credit impairment will be recognized in earnings as an allowance for credit losses and reported in “Realized investment gains (losses), net,” to the extent the amortized cost exceeds the net present value of projected future cash flows (the “net present value”) for the security. A credit impairment recorded cannot exceed the difference between the amortized cost and fair value of the respective security. The net present value used to measure a credit impairment is calculated by discounting the Company’s best estimate of projected future cash flows at the effective interest rate implicit in the AFS debt security at the date of acquisition. Once the Company has deemed all or a portion of the amortized cost uncollectible, the allowance is removed from the balance sheet by writing down the amortized cost basis of the AFS debt security. Any amount of an AFS debt security’s change in fair value not recorded as an allowance for credit losses will be recorded in Other Comprehensive Income (loss) (“OCI”).
For all other AFS debt securities, qualitative factors are first considered including, but not limited to, the extent of the decline and the reasons for the decline in value (e.g., credit events, currency or interest-rate related, including general credit spread widening), and the financial condition of the issuer. If analysis of these qualitative factors results in the security needing to be impaired, a credit impairment will be recognized and measured using the same process for mortgage-backed and asset-backed AFS debt securities.
When an AFS debt security's fair value is below amortized cost and the Company has the intent to sell the AFS debt security, or it is more likely than not the Company will be required to sell the AFS debt security before its anticipated recovery, the amortized cost basis of the AFS debt security is written down to fair value and any previously recognized allowance is reversed. The write-down is reported in "Realized investment gains (losses), net".
Interest income, including amortization of premium and accretion of discount, are included in “Net investment income” under the effective yield method. Prepayment premiums are also included in “Net investment income”.
For high credit quality mortgage-backed and asset-backed AFS debt securities (those rated AA or above), the amortized cost and effective yield of the securities are adjusted as necessary to reflect historical prepayment experience and changes in estimated future prepayments. The adjustments to amortized cost are recorded as a charge or credit to “Net investment income” in accordance with the retrospective method.
For mortgage-backed and asset-backed AFS debt securities rated below AA, the effective yield is adjusted prospectively for any changes in the estimated timing and amount of cash flows unless the investment is purchased with credit deterioration or an allowance is currently recorded for the respective security. If an investment is impaired, any changes in the estimated timing and amount of cash flows will be recorded as the credit impairment, as opposed to a yield adjustment. If the asset is purchased with credit deterioration (or previously impaired), the effective yield will be adjusted if there are favorable changes in cash flows subsequent to the allowance being reduced to zero.
For mortgage-backed and asset-backed AFS debt securities, cash flow estimates consider the payment terms of the underlying assets backing a particular security, including interest rate and prepayment assumptions based on data from widely accepted third-party data sources or internal estimates. In addition to interest rate and prepayment assumptions, cash flow estimates also include other assumptions regarding the underlying collateral including default rates and recoveries, which vary based on the asset type and geographic location, as well as the vintage year of the security. These assumptions can significantly impact income recognition, unrealized gains and loss recorded in OCI, and the amount of impairment recognized in earnings. The payment priority of the respective security is also considered. For all other AFS debt securities, cash flow estimates are driven by assumptions regarding probability of default and estimates regarding timing and amount of recoveries associated with a default. The Company has developed these estimates using information based on its historical experience as well as using market observable data, such as industry analyst reports and forecasts, sector credit ratings and other data relevant to the collectability of a security, such as the general payment terms of the security and the security’s position within the capital structure of the issuer.
13
PRUCO LIFE INSURANCE COMPANY
Notes to Consolidated Financial Statements—(Continued)
Fixed maturities, trading, at fair value ("Trading debt securities") includes debt securities that are carried at fair value. See Note 6 for additional information regarding the determination of fair value. Realized and unrealized gains and losses for these investments are reported in “Other income (loss),” and interest income from these investments is reported in “Net investment income”.
Equity securities, at fair value consists of common stock and mutual fund shares carried at fair value. Realized and unrealized gains and losses on these investments are reported in “Other income (loss),” and dividend income is reported in “Net investment income” on the ex-dividend date.
Policy loans represents funds loaned to policyholders up to the cash surrender value of the associated insurance policies and are carried at the unpaid principal balances due to the Company from the policyholders. Interest income on policy loans is recognized in “Net investment income” at the contract interest rate when earned. Policy loans are fully collateralized by the cash surrender value of the associated insurance policies.
Short-term investments primarily consists of highly liquid debt instruments with a maturity of twelve months or less and greater than three months when purchased. These investments are generally carried at fair value or amortized cost that approximates fair value and include certain money market investments, funds managed similar to regulated money market funds, short-term debt securities issued by government-sponsored entities and other highly liquid debt instruments.
Commercial mortgage and other loans consist of commercial mortgage loans, agricultural property loans, residential mortgage loans, as well as certain other collateralized loans. Commercial mortgage and other loans held for investment are generally carried at unpaid principal balance, net of unamortized deferred loan origination fees and expenses and net of any current expected credit loss ("CECL") allowance. Certain off-balance sheet credit exposures (e.g., indemnification of serviced mortgage loans, and certain unfunded mortgage loan commitments where the Company cannot unconditionally cancel the commitment) are also subject to a CECL allowance. See Note 17 for additional information.
Commercial mortgage and other loans acquired, including those related to the acquisition of a business, are recorded at fair value when purchased, reflecting any premiums or discounts to unpaid principal balances. Interest income, and the amortization of the related premiums or discounts, are included in “Net investment income” under the effective yield method. Prepayment fees are also included in “Net investment income”.
The CECL allowance represents the Company’s best estimate of expected credit losses over the remaining life of the assets or off-balance sheet credit exposures. The determination of the allowance considers historical credit loss experience, current conditions, and reasonable and supportable forecasts. The allowance is calculated separately for commercial mortgage loans, agricultural property loans, residential mortgage loans, and other collateralized loans.
For commercial mortgage and agricultural property loans, the allowance is calculated using an internally developed CECL model that pools together loans that share similar risk characteristics. Similar risk characteristics used to create the pools include, but are not limited to, vintage, maturity, credit rating, and collateral type.
Key inputs to the CECL model include unpaid principal balances, internal credit ratings, annual expected loss factors, average lives of the loans adjusted for prepayment considerations, current and historical interest rate assumptions, and other factors influencing the Company’s view of the current stage of the economic cycle and future economic conditions. Subjective considerations include a review of whether historical loss experience is representative of current market conditions and the Company’s view of the credit cycle. Model assumptions and factors are reviewed and updated as appropriate. Information about certain key inputs is detailed below.
14
PRUCO LIFE INSURANCE COMPANY
Notes to Consolidated Financial Statements—(Continued)
Key factors in determining the internal credit ratings for commercial mortgage and agricultural property loans include loan-to-value and debt-service-coverage ratios. Other factors include amortization, loan term, and estimated market value growth rate and volatility for the property type and region. The loan-to-value ratio compares the carrying amount of the loan to the fair value of the underlying property or properties collateralizing the loan, and is commonly expressed as a percentage. Loan-to-value ratios greater than 100 % indicate that the carrying amount of the loan exceeds the collateral value. A loan-to-value ratio less than 100 % indicates an excess of collateral value over the carrying amount of the loan. The debt service coverage ratio is a property’s net operating income as a percentage of its debt service payments. Debt service coverage ratios less than 1.0 indicates that property operations do not generate enough income to cover the loan’s current debt payments. A debt service coverage ratio greater than 1.0 indicates an excess of net operating income over the debt service payments. The values utilized in calculating these ratios are developed as part of the Company’s periodic review of the commercial mortgage loan and agricultural property loan portfolios, which includes an internal appraisal of the underlying collateral value. The Company’s periodic review also includes a quality re-rating process, whereby the internal quality rating originally assigned at underwriting is updated based on current loan, property and market information using a proprietary quality rating system. See Note 3 for additional information related to the loan-to-value ratios and debt service coverage ratios related to the Company’s commercial mortgage and agricultural property loan portfolios.
Annual expected loss rates are based on historical default and loss experience factors. Using average lives, the annual expected loss rates are converted into life-of-loan loss expectations.
When individual loans no longer have the credit risk characteristics of the commercial mortgage or agricultural property loan pools, they are removed from the pools and are evaluated individually for an allowance. The allowance is determined based on the outstanding loan balance less the present value of expected future cash flows discounted at the loan’s effective interest rate or the fair value of the collateral if the loan is collateral dependent.
For residential mortgage loans, the allowance is calculated using an internally developed CECL model that pools together loans that share similar risk characteristics. The estimated lifetime loss of the pool is calculated from the risk profiles of the loans, including borrower credit score, loan-to-value ratio, property type, and several key attributes of the loan and property including: loan type, loan age, loan performance history, and current performing or nonperforming status. Estimated lifetime loss rates are calculated by weighting projected losses in multiple economic scenarios based on the Company’s view of the current stage of the economic cycle and future economic conditions. The scenario losses are calibrated to industry historical experience of defaults, loss severities, and prepayment rates in multiple economic cycles, reflective of similar loan characteristics.
The CECL allowance on commercial mortgage and other loans can increase or decrease from period to period based on the factors noted above. The change in allowance is reported in “Realized investment gains (losses), net”. As it relates to unfunded commitments that are in scope of this guidance, the CECL allowance is reported in “Other liabilities”, and the change in the allowance is reported in “Realized investment gains (losses), net”.
The CECL allowance for other collateralized loans carried at amortized cost is determined based on probability of default and loss given default assumptions by sector, credit quality and average lives of the loans. Additions to or releases of the allowance are reported in “Realized investment gains (losses), net”.
Once the Company has deemed a portion of the amortized cost to be uncollectible, the uncollectible portion of allowance is removed from the balance sheet by writing down the amortized cost basis of the loan. The carrying amount of the loan is not adjusted for subsequent recoveries in value.
Interest received on loans that are past due is either applied against the principal or reported as net investment income based on the Company’s assessment as to the collectability of the principal. The Company defines “past due” as principal or interest not collected at least 30 days past the scheduled contractual due date. See Note 3 for additional information about the Company’s past due loans.
The Company discontinues accruing interest on loans after the loans become 90 days delinquent as to principal or interest payments, or earlier when the Company has doubts about collectability. When the Company discontinues accruing interest on a loan, any accrued but uncollectible interest on the loan and other loans backed by the same collateral, if any, is charged against interest income in the same period. Generally, a loan is restored to accrual status only after all delinquent interest and principal are brought current and, in the case of loans where the payment of interest has been interrupted for a substantial period, or the loan has been modified, a regular payment performance has been established.
15
PRUCO LIFE INSURANCE COMPANY
Notes to Consolidated Financial Statements—(Continued)
Commercial mortgage and other loans are occasionally restructured. These restructurings generally include one or more of the following: full or partial payoffs outside of the original contract terms; changes to interest rates; extensions of maturity; or additions or modifications to covenants. Additionally, the Company may accept assets in full or partial satisfaction of the debt.
All restructurings are evaluated under the modification guidance in ASC 310-20. When a loan is modified, the Company evaluates whether the restructuring results in a continuation of the existing loan or a new loan. For modifications that result in a continuation of the existing loan, the CECL allowance of the loan is remeasured using the modified terms, including the loan’s post-modification effective yield, and the allowance is adjusted accordingly.
For modifications that result in a new loan, any CECL allowance is reversed and a direct write-down of the loan is recorded for the amount of the allowance, and any additional loss, net of recoveries, or any gain is recorded for the difference between the fair value of the new loan and the recorded investment in the loan. The new loan is evaluated prospectively for credit impairment based on the CECL allowance process noted above.
Other invested assets consist of the Company’s non-coupon investments in limited partnerships and limited liability companies ("LPs/LLCs"), other than operating joint ventures, as well as derivative assets. LPs/LLCs interests are accounted for using either the equity method of accounting, or at fair value. The Company’s income from investments in LPs/LLCs accounted for using the equity method, other than the Company’s investments in operating joint ventures, is included in “Net investment income”. The carrying value of these investments is written down, or impaired, to fair value when a decline in value is considered to be other-than-temporary. In applying the equity method (including assessment for OTTI), the Company uses financial information provided by the investee, generally on a to three-month lag. For the investments reported at fair value with changes in fair value reported in current earnings, the associated realized and unrealized gains and losses are reported in “Other income (loss)”. The Company consolidates LPs in certain other instances where it is deemed to exercise control, or is considered the primary beneficiary of a variable interest entity. See Note 4 for additional information about VIEs.
Cash and cash equivalents includes cash on hand, amounts due from banks, certain money market investments, funds managed similar to regulated money market funds, other debt instruments with maturities of three months or less when purchased, other than cash equivalents that are included in "Fixed maturities, available-for-sale, at fair value,” and receivables related to securities purchased under agreements to resell (see also "Securities sold under agreements to repurchase" below.) The Company also engages in overnight borrowing and lending of funds with Prudential Financial and affiliates which are considered cash and cash equivalents. These assets are generally carried at fair value or amortized cost which approximates fair value.
Deferred policy acquisition costs ("DAC") represents costs directly related to the successful acquisition of new and renewal insurance and annuity business. Such DAC primarily includes commissions, costs of policy issuance and underwriting, and certain other expenses that are directly related to successfully acquired contracts. In each reporting period, previously capitalized DAC is amortized and included in “Amortization of deferred policy acquisition costs”.
DAC for most long-duration contracts is amortized on a constant-level basis at a grouped contract level over the expected life of the underlying insurance contracts. Contracts are grouped consistent with the groupings used to estimate the liability for future policy benefits (or other related balances) for the corresponding contracts. Since contracts within a grouping may be of different sizes, contracts within a group are weighted to achieve appropriate amortization and to ensure that DAC is derecognized when a policy is no longer in force. The constant-level basis used to weight contracts within a grouping and amortize DAC is generally defined as follows:
•Life insurance contracts – DAC associated with life insurance contracts is generally amortized in proportion to the initial face amount of life insurance in force. This is applicable to traditional and universal life insurance products.
•Payout annuity contracts – DAC associated with payout annuity contracts is amortized in proportion to annual benefit payments.
•Deferred annuity contracts – DAC associated with fixed and variable deferred annuity contracts is amortized in proportion to deposits.
For single premium immediate annuities without life contingencies, acquisition expenses are deferred and amortized over the expected life of the contracts using the interest method.
Current period DAC amortization reflects the impact of changes in actual insurance in force during the period and changes in future assumptions effected as of the end of the quarter, where applicable. The Company typically updates actuarial assumptions annually in the second quarter, unless a material change is observed in an interim period that is indicative of a long-term trend. Generally, the
16
PRUCO LIFE INSURANCE COMPANY
Notes to Consolidated Financial Statements—(Continued)
Company does not expect trends to change significantly in the short-term and, to the extent these trends may change, the Company expects such changes to be gradual over the long-term.
Assumptions used for DAC are consistent with those used in estimating the liability for future policy benefits (or any other related balance) for the corresponding contract. Determining the level of aggregation and actuarial assumptions used in projecting in force terminations requires judgment. Internal criteria are developed to determine the level of aggregation by considering both qualitative and quantitative materiality thresholds.
The assumptions used in projecting in force terminations are mortality, mortality improvement, and lapse assumptions. These assumptions are generally based on the Company’s experience, industry experience and/or other factors, as applicable. For variable deferred annuity contracts, lapse rates are adjusted at the contract level based on the in-the-moneyness of the living benefits and reflect other factors, such as the applicability of any surrender charges. Lapse rates are reduced when contracts are more in-the-money. Lapse rates are also generally assumed to be lower for the period where surrender charges apply.
For some products, policyholders can elect to modify product benefits, features, rights or coverages by exchanging a contract for a new contract or by amendment, endorsement, or rider to a contract, or by the election of a feature or coverage within a contract. These transactions are known as internal replacements. If policyholders surrender traditional life insurance policies in exchange for life insurance policies that do not have fixed and guaranteed terms, the Company immediately charges to expense the remaining unamortized DAC on the surrendered policies. For other internal replacement transactions, except those that involve the addition of a non-integrated contract feature that does not change the existing base contract, the unamortized DAC is immediately charged to expense if the terms of the new policies are not substantially similar to those of the former policies. If the new terms are substantially similar to those of the earlier policies, the DAC is retained with respect to the new policies and amortized over the expected life of the new policies. See Note 7 for additional information regarding DAC.
Accrued investment income primarily includes accruals of interest and dividend income from investments that have been earned but not yet received.
Reinsurance recoverables and deposit receivables includes amounts recoverable under reinsurance agreements and receivables that follow the deposit method of accounting (see “Reinsurance” below).
Market risk benefit assets represents market risk benefits ("MRBs") in an asset position and are presented separately from MRBs in a liability position. See “Market risk benefit liabilities” below. MRB assets also reflect ceded MRBs resulting from reinsurance of the Company's Prudential Defined Income ("PDI") traditional variable annuity contracts. See Note 12 for additional information regarding the reinsurance of PDI.
Deferred Sales Inducements ("DSI") are amounts that are credited to a policyholders’ account balance primarily as an inducement to purchase fixed and/or variable deferred annuity contracts. The Company defers sales inducements and amortizes them over the expected life of the policy using the same methodology, factors and assumptions used to amortize DAC. The Company records amortization of DSI in “Interest credited to policyholders’ account balances”. Unlike DAC, DSI are considered contractual cash flows and, as a result, are subject to periodic recoverability testing. See Note 7 for additional information regarding DSI.
Income tax assets primarily represents the net deferred tax asset and the Company’s estimated taxes receivable for the current year and open audit years.
The Company is a member of the federal income tax return of Prudential Financial and primarily files separate company state and local tax returns. Pursuant to the tax allocation arrangement with Prudential Financial, total federal income tax expense is determined on a separate company basis. Members record tax benefits to the extent tax losses or tax credits are recognized in the consolidated federal tax provision.
The application of U.S. GAAP requires the Company to evaluate the recoverability of the Company’s deferred tax assets and establish a valuation allowance if necessary to reduce the Company’s deferred tax assets to an amount that is more likely than not expected to be realized. Considerable judgment is required in determining whether a valuation allowance is necessary, and if so, the amount of such valuation allowance. See Note 13 for a discussion of factors considered when evaluating the need for a valuation allowance.
17
PRUCO LIFE INSURANCE COMPANY
Notes to Consolidated Financial Statements—(Continued)
U.S. GAAP prescribes a comprehensive model for how a company should recognize, measure, present, and disclose in its financial statements uncertain tax positions that a company has taken or expects to take on tax returns. The application of this guidance is a two-step process. First, the Company determines whether it is more likely than not, based on the technical merits, that the tax position will be sustained upon examination. If a tax position does not meet the more likely than not recognition threshold, the benefit of that position is not recognized in the financial statements. The second step is measurement. The Company measures the tax position as the largest amount of benefit that is greater than 50% likely to be realized upon ultimate resolution with a taxing authority that has full knowledge of all relevant information. This measurement considers the amounts and probabilities of the outcomes that could be realized upon ultimate settlement using the facts, circumstances, and information available at the reporting date.
The Company accrues a liability for unrecognized tax benefits, interest and penalties which relate to tax years still subject to review by the Internal Revenue Service ("IRS") or other taxing jurisdictions. Audit periods remain open for review until the statute of limitations has passed. Generally, for tax years which produce net operating losses, capital losses or tax credit carryforwards (“tax attributes”), the statute of limitations does not close, to the extent of these tax attributes, until the expiration of the statute of limitations for the tax year in which they are fully utilized. The completion of review or the expiration of the statute of limitations for a given audit period could result in an adjustment to the liability for income taxes. The Company classifies all interest and penalties related to tax uncertainties as income tax expense. See Note 13 for additional information regarding income taxes.
Other assets consists primarily of deferred reinsurance losses ("DRL") (see "Reinsurance" below) which are amortized over the expected life of the reinsured contracts on a constant-level basis, receivables resulting from sales of securities that had not yet settled at the balance sheet date, premiums due, prepaid tax expenses, and the Company’s investments in operating joint ventures. Investments in operating joint ventures are generally accounted for under the equity method. The carrying value of these investments is written down, or impaired, to fair value when a decline in value is considered to be other-than-temporary.
Separate account assets represents segregated funds that are invested for certain policyholders, and other customers. The assets consist primarily of equity securities, fixed maturities, real estate-related investments, real estate mortgage loans, short-term investments and derivative instruments and are reported at fair value. The assets of each account are legally segregated and are not subject to claims that arise out of any other business of the Company. Investment risks associated with market value changes are borne by the customers, except to the extent of minimum guarantees made by the Company with respect to certain accounts. The investment income and realized investment gains or losses from separate account assets generally accrue to the policyholders and are not included in the Company’s results of operations. Mortality, policy administration and surrender charges assessed against the accounts are included in “Policy charges and fee income”. Asset administration fees charged to the accounts are included in “Asset administration fees”. Seed money that the Company invests in separate accounts is reported in the appropriate general account asset line. Investment income and realized investment gains or losses from seed money invested in separate accounts accrue to the Company and are included in the Company’s results of operations. See Note 8 for additional information regarding separate account arrangements with contractual guarantees. See also “Separate account liabilities” below.
LIABILITIES
Future policy benefits primarily consists of the present value of expected future payments to or on behalf of policyholders, where the timing and amount of such payments depend on policyholder mortality or morbidity, less the present value of expected future net premiums (where net premiums are gross premiums multiplied by the Net-To-Gross ("NTG") ratio discussed below). The liability for future policy benefits is accrued over time as premium revenue is recognized. See Note 9 for additional information regarding future policy benefits.
18
PRUCO LIFE INSURANCE COMPANY
Notes to Consolidated Financial Statements—(Continued)
The reserving methodology used for non-participating traditional and limited-payment contracts include the following:
•Cash Flow Assumptions. In measuring the liability for future policy benefits, the net premium valuation methodology is utilized. Under this methodology, a liability for future policy benefits is established using current best estimate insurance assumptions and interest rate assumptions locked-in at contract issuance date. The NTG ratio is calculated as the ratio of the present value of expected policy benefits and non-level claim settlement expenses divided by the present value of expected gross premiums. The NTG ratio is applied to gross premiums, as premium revenue is recognized, to determine net premiums. The liability is then determined as the present value of expected future policy benefits and non-level claim settlement expenses less the present value of expected future net premiums. The result of the net premium valuation methodology is that the liability at any point in time represents an accumulation of the portion of premiums received to date expected to fund future benefits (i.e., net premiums received to date), less any benefits and expenses already paid. The liability does not necessarily reflect the full policyholder obligation the Company expects to pay at the conclusion of the contract since a portion of that obligation would be funded by net premiums received in the future and would be recognized in the liability at that time. For purposes of liability measurement, contracts are grouped into cohorts based primarily on issue year and major product line.
The NTG ratio is generally updated quarterly for actual experience and annually in the second quarter of each year for future cash flow assumption updates during the Company’s annual assumptions review process unless a material change is observed in an interim period that is indicative of a long-term trend, with the exception of claim settlement expense assumptions which the Company has made an entity-wide election to lock-in as of contract issuance. The NTG ratio is subject to a retrospective unlocking method whereby the Company updates its best estimate of cash flows expected over the life of the cohort using actual historical experience and updated future cash flow assumptions. These updated cash flows are used to calculate the revised NTG ratio, which is used to derive an updated liability for future policy benefits as of the beginning of the current reporting period, discounted at the original contract issuance discount rate. The updated liability for future policy benefit amount as of the beginning of the quarter is then compared to the carrying amount of the liability as of that same date, before the updates for actual experience or future cash flow assumptions, to determine the current period change in liability estimate. This current period change in the liability is the liability remeasurement gain or loss that is recorded through current period earnings in “Change in estimates of liability for future policy benefits”. In subsequent periods, the revised NTG ratio is used to measure the liability for future policy benefits, subject to future revisions.
If a cohort is in a loss position where the liability for future policy benefits plus the present value of expected future gross premiums are determined to be insufficient to provide for expected future policy benefits and non-level claim settlement expenses, the NTG ratio is capped at 100 %. In these instances, all changes in expected benefits resulting from both actual experience deviations and changes in future assumptions are recognized immediately. While the liability for future policy benefits cannot be less than zero (i.e., a contra-liability) at the cohort level and thus the balance is floored at zero (i.e., “flooring”), the NTG ratio may be negative. This would be the case whereby conditions have improved such that the present value of future net premiums plus the existing liability for future policy benefits as of the valuation date exceed the present value of expected future policy benefits and non-level claim settlement expenses. In this case, the negative NTG ratio would be applied going forward to gross premiums received, effectively amortizing the gain into income and reducing the liability over time.
In addition, for limited-payment contracts, the liability for future policy benefits also includes a Deferred Profit Liability ("DPL") representing gross premiums received in excess of net premiums and is generally recognized in revenue in a constant relationship with insurance in force for life contracts or with the amount of expected future benefit payments for annuity contracts. The DPL is subject to a retrospective unlocking adjustment consistent with the liability for future policy benefits discussed above. The DPL cannot be less than zero (i.e., a contra-liability) at the cohort level and thus the balance is floored at zero (i.e., “flooring”).
•Discount Rate Assumption. The locked-in discount rate is generally based on expected investment returns at contract inception for contracts issued prior to January 1, 2021 and the upper medium grade fixed income corporate instrument yield (i.e., global single A) at contract inception for contracts issued on or after January 1, 2021. The discount rate in effect at contract inception is locked-in for the calculation of the NTG ratio and accretion of interest cost on the liability through net income. However, for balance sheet remeasurement purposes, the discount rate is updated using the current single A rate at each reporting period, with the effect on the liability resulting from such update recorded in “Interest rate remeasurement of future policy benefits" in OCI.
19
PRUCO LIFE INSURANCE COMPANY
Notes to Consolidated Financial Statements—(Continued)
The methodology used in constructing the single A discount rate curve for discounting cash flows used to calculate the liability for future policy benefits is intended to be reflective of the characteristics of the applicable insurance liabilities. The single A discount rate curve is developed by reference to upper medium grade (low credit risk) fixed income instrument yields that reflect the duration characteristics of the applicable insurance liabilities. The single A discount curve for the United States is developed using government bond rates plus public corporate A spreads in the observable periods. The definition of upper medium grade is based on Moody’s Investor Service, Inc. ("Moody's") definition which includes the spectrum of A (i.e., A- to A+). Liquidity is considered in defining the observable period and linear extrapolation is performed to the Company's ultimate long-term economic assumptions. Annually, the Company performs a comprehensive review of the economic assumptions, including long-term interest rate assumptions and equity return assumptions, generally utilizing relevant economic outlook information and industry surveys as the primary basis.
The Company’s liability for future policy benefits also includes net liabilities for guaranteed benefits related to certain long-duration life contracts, such as no-lapse guarantee contract features (Additional Insurance Reserves or "AIR" liability), for which a liability is established when associated assessments are recognized (which include investment margin on policyholders' account balances deposited to fixed and indexed funds and all policy charges including charges for administration, mortality, expense, surrender, and other charges). This liability is established using current best estimate assumptions and is based on the ratio of the present value of total expected excess payments (i.e., payments in excess of account value) over the life of the contract divided by the present value of total expected assessments (i.e., benefit ratio). The liability equals the current benefit ratio multiplied by cumulative assessments recognized to date, plus interest, less cumulative excess payments to date. The liability does not necessarily reflect the full policyholder obligation the Company expects to pay at the conclusion of the contract since a portion of that excess payment would be funded by assessments received in the future and would be recognized in the liability at that time. The reserves are subject to adjustments based on annual reviews of assumptions and quarterly adjustments for experience as described below, including market performance. These adjustments reflect the impact on the benefit ratio of using actual historical experience from the issuance date to the balance sheet date plus updated estimates of future experience. The updated benefit ratio is then applied to all prior periods’ assessments to derive an adjustment to the reserve recognized through a benefit or charge to current period earnings. Any adjustments to this liability related to net unrealized gains (losses) on securities classified as available-for-sale are included in AOCI.
For universal life type contracts and participating contracts, the Company performs premium deficiency tests using best estimate assumptions as of the testing date, at a minimum, on an annual basis, and on a quarterly basis for business whose profitability is closely tied to equity market performance. If the liabilities determined based on these best estimate assumptions are greater than the net reserves (i.e., GAAP reserves including unearned revenue reserves ("URR"), net of reinsurance and any DSI asset), the existing net reserves are adjusted by first reducing assets, such as DSI or deferred reinsurance loss, by the amount of the deficiency or to zero through a charge to current period earnings. If the deficiency is more than these asset balances for insurance contracts, the net reserves are increased by the excess through a charge to current period earnings included in "Policyholders' benefits". Since investment yields are used as the discount rate, the premium deficiency test is also performed using a discount rate based on the market yield (i.e., assuming what would be the impact if any unrealized gains (losses) were realized as of the testing date). In the event that by using the market yield a deficiency occurs, an adjustment is established for the deficiency and is included in AOCI.
20
PRUCO LIFE INSURANCE COMPANY
Notes to Consolidated Financial Statements—(Continued)
Market risk benefit liabilities represents contracts or contract features that provide protection to the contractholder and exposes the Company to other than nominal capital market risk, primarily related to deferred annuities with guaranteed minimum benefits associated with annuities products including guaranteed minimum death benefits (“GMDB”), guaranteed minimum income benefits (“GMIB”), guaranteed minimum accumulation benefits (“GMAB”), guaranteed minimum withdrawal benefits (“GMWB”) and guaranteed minimum income and withdrawal benefits (“GMIWB”). The benefits are accounted for using a fair value measurement framework. If a contract contains multiple market risk benefits, the benefits are bundled together and accounted for as a single compound market risk benefit. Market risk benefits in an asset position are presented separately from those in a liability position as there is no legal right of offset between contracts. The fair value of market risk benefits is calculated as the present value of expected future benefit payments to contractholders less the present value of expected future rider fees attributable to the market risk benefits. The fair value of market risk benefits is based on assumptions a market participant would use in valuing market risk benefits. For additional information regarding the valuation of market risk benefits, see Note 6. On a quarterly basis, changes in the fair value of market risk benefits are recorded in net income, net of related hedges, in "Change in value of market risk benefits, net of related hedging gains (losses)", except for the portion of the change attributable to changes in the Company’s non-performance risk ("NPR") which is recorded in OCI. See Note 11 for additional information regarding market risk benefits. See "Reinsurance" below for information regarding the reinsurance of MRBs.
Cash collateral for loaned securities represents liabilities to return cash proceeds from security lending transactions. Securities lending transactions are used primarily to earn spread income. As part of securities lending transactions, the Company transfers U.S. and foreign debt and equity securities, as well as U.S. government and government agency securities, and receives cash as collateral. Cash proceeds from securities lending transactions are primarily used to earn spread income, and are typically invested in cash equivalents, short-term investments or fixed maturities. Securities lending transactions are treated as financing arrangements and are recorded at the amount of cash received. The Company obtains collateral in an amount equal to 102 % and 105 % of the fair value of the domestic and foreign securities, respectively. The Company monitors the market value of the securities loaned on a daily basis with additional collateral obtained as necessary. Substantially all of the Company’s securities lending transactions are with large brokerage firms and large banks. Income and expenses associated with securities lending transactions used to earn spread income are reported as "Net investment income".
Securities sold under agreements to repurchase represents liabilities associated with securities repurchase agreements that are used primarily to earn spread income. As part of securities repurchase agreements, the Company transfers U.S. government and government agency securities to a third-party, and receives cash as collateral. For securities repurchase agreements, the cash received is typically invested in cash equivalents, short-term investments or fixed maturities. Receivables associated with securities purchased under agreements to resell are generally reflected as cash equivalents. As part of securities resale agreements, the Company invests cash and receives as collateral U.S. government securities or other debt securities.
Securities repurchase and resale agreements that satisfy certain criteria are treated as secured borrowing or secured lending arrangements. These agreements are carried at the amounts at which the securities will be subsequently resold or reacquired, as specified in the respective transactions. For securities purchased under agreements to resell, the Company’s policy is to take possession or control of the securities either directly or through a third-party custodian. These securities are valued daily, and additional securities or cash collateral is received, or returned, when appropriate to protect against credit exposure. Securities to be resold are the same, or substantially the same, as the securities received. The majority of these transactions are with large brokerage firms and large banks. For securities sold under agreements to repurchase, the market value of the securities to be repurchased is monitored, and additional collateral is obtained where appropriate, to protect against credit exposure. The Company obtains collateral in an amount at least equal to 95 % of the fair value of the securities sold. Securities to be repurchased are the same, or substantially the same, as those sold. The majority of these transactions are with highly rated money market funds. Income and expenses related to these transactions executed within the insurance companies used to earn spread income are reported as “Net investment income”.
Reinsurance and funds withheld payables represents amounts payable under reinsurance agreements (see “Reinsurance” below). Reinsurance and funds withheld payables may also include derivative instruments for which fair values are determined as described below under "Derivative Financial Instruments".
Separate account liabilities primarily represents the contractholders’ account balances in separate account assets and to a lesser extent borrowings of the separate account, and will be equal and offsetting to total separate account assets. See also “Separate account assets” above.
21
PRUCO LIFE INSURANCE COMPANY
Notes to Consolidated Financial Statements—(Continued)
Short-term and long-term debt liabilities are primarily carried at an amount equal to unpaid principal balance, net of unamortized discount or premium and debt issuance costs. Original-issue discount or premium and debt-issue costs are recognized as a component of interest expense over the period the debt is expected to be outstanding, using the interest method of amortization. Interest expense is generally presented within “General, administrative and other expenses” in the Company’s Consolidated Statements of Operations. Short-term debt is debt coming due in the next twelve months, including that portion of debt otherwise classified as long-term. The short-term debt caption may exclude short-term debt items for which the Company has the intent and ability to refinance on a long-term basis in the near term. See Note 16 for additional information regarding short-term and long-term debt.
Commitments and contingent liabilities are accrued if it is probable that a liability has been incurred and an amount is reasonably estimable. Management evaluates whether there are incremental legal or other costs directly associated with the ultimate resolution of the matter that are reasonably estimable and, if so, they are included in the accrual. These accruals are generally reported in “Other liabilities”.
REVENUES, BENEFITS AND EXPENSES
Insurance Revenue and Expense Recognition
Premiums from individual life products, other than universal and variable life contracts, are recognized when due. When premiums are due over a significantly shorter period than the period over which benefits are provided, any gross premium in excess of the net premium (i.e., the portion of the gross premium required to provide for all expected future policy benefits and non-level claim settlement expenses) is generally deferred and recognized into revenue in a constant relationship to insurance in force. Benefits are recorded as an expense when they are incurred. A liability for future policy benefits is recorded when premiums are recognized as described in "Future policy benefits" above.
Premiums from single premium immediate annuities with life contingencies are recognized when due. When premiums are due over a significantly shorter period than the period over which benefits are provided, any gross premium in excess of the net premium is generally deferred and recognized into revenue based on expected future benefit payments. Benefits are recorded as an expense when they are incurred. A liability for future policy benefits is recorded when premiums are recognized as described in "Future policy benefits" above.
Certain individual annuity contracts provide the contractholder a guarantee that the benefit received upon death or annuitization will be no less than a minimum prescribed amount. These benefits are generally accounted for as market risk benefits (see “Market risk benefits” above).
Amounts received from policyholders as payment for universal or variable individual life contracts, deferred fixed or variable annuities and other contracts without life contingencies are reported as deposits to “Policyholders’ account balances” and/or “Separate account liabilities”. Revenues from these contracts are reflected in “Policy charges and fee income” consisting primarily of fees assessed during the period against the policyholders’ account balances for mortality and other benefit charges, policy administration charges and surrender charges. In addition to fees, the Company earns investment income from the investment of deposits in the Company’s general account portfolio. Fees assessed that represent compensation to the Company for services to be provided in future periods and certain other fees are generally deferred and amortized into revenue over the life of the related contracts using the same methodology, factors, and assumption used to amortize DAC as described above. Benefits and expenses for these products include claims in excess of related account balances, expenses of contract administration, interest credited to policyholders’ account balances and amortization of DAC and DSI.
Policyholders’ account balances also include amounts representing the fair value of embedded derivative instruments associated with the index-linked features of certain universal life and annuity products where changes in the value of the embedded derivatives are recorded through "Realized investment gains (losses), net". For additional information regarding the valuation of these embedded derivatives, see Note 6.
22
PRUCO LIFE INSURANCE COMPANY
Notes to Consolidated Financial Statements—(Continued)
Other income (loss) includes realized and unrealized gains or losses from investments reported as “Fixed maturities, trading, at fair value”, “Equity securities, at fair value”, and “Other invested assets” that are measured at fair value as well as interest income related to affiliated cash collateral. See Note 16 for more information related to affiliated cash collateral. Other income (loss) in 2025 also includes the recognition of previously deferred reinsurance gains.
Realized investment gains (losses), net includes realized gains or losses from sales and maturities of investments, changes to the allowance for credit losses, other impairments, fair value changes on mortgage loans where the fair value option has been elected, and derivative gains or losses. The derivative gains or losses include the impact of maturities, terminations and changes in fair value of the derivative instruments, including embedded derivatives, and other hedging instruments. Realized investment gains (losses) from the sales of securities are generally calculated using the specific identification method.
OTHER ACCOUNTING POLICIES
Derivative Financial Instruments
Derivatives are financial instruments whose values are derived from interest rates, foreign exchange rates, financial indices, values of securities or commodities, credit spreads, market volatility, expected returns, and liquidity. Values can also be affected by changes in estimates and assumptions, including those related to counterparty behavior and NPR used in valuation models. Derivative financial instruments generally used by the Company include swaps, futures, forwards and options and may be exchange-traded or contracted in the over-the-counter (“OTC”) market. Certain of the Company’s OTC derivatives are cleared and settled through central clearing counterparties, while others are bilateral contracts between two counterparties. Derivative positions are carried at fair value, generally by obtaining quoted market prices or through the use of valuation models.
Derivatives are used to manage the interest rate and currency characteristics of assets or liabilities. Additionally, derivatives may be used to reduce exposure to risks such as interest rate, credit, foreign currency and equity associated with assets held or expected to be purchased or sold, and liabilities incurred or expected to be incurred. As discussed in detail below and in Note 5, all realized and unrealized changes in fair value of derivatives are recorded in current earnings, with the exception of cash flow hedges. Cash flows from derivatives are reported in the operating, investing or financing activities sections in the Consolidated Statements of Cash Flows based on the nature and purpose of the derivative.
Derivatives are recorded either as assets, within “Other invested assets”, or as liabilities, within “Payables to parent and affiliates”, except for embedded derivatives which are recorded with the associated host contract. The Company nets the fair value of all derivative financial instruments with counterparties for which a master netting arrangement has been executed.
The Company designates derivatives as either (1) a hedge of a forecasted transaction or of the variability of cash flows to be received or paid related to a recognized asset or liability (“cash flow” hedge); or (2) a derivative that does not qualify for hedge accounting.
To qualify for hedge accounting treatment, a derivative must be highly effective in mitigating the designated risk of the hedged item. Effectiveness of the hedge is formally assessed at inception and throughout the life of the hedging relationship.
The Company formally documents at inception all relationships between hedging instruments and hedged items, as well as its risk-management objective and strategy for undertaking various hedge transactions. This process includes linking all derivatives designated as cash flow hedges to specific assets and liabilities on the balance sheet or to specific firm commitments or forecasted transactions.
When a derivative is designated as a cash flow hedge and is determined to be highly effective, changes in its fair value are recorded in AOCI until earnings are affected by the variability of cash flows being hedged (e.g., when periodic settlements on a variable-rate asset or liability are recorded in earnings). At that time, the related portion of deferred gains or losses on the derivative instrument is reclassified and reported in the Consolidated Statements of Operations line item associated with the hedged item.
If it is determined that a derivative no longer qualifies as an effective cash flow hedge or management removes the hedge designation, the derivative will continue to be carried on the balance sheet at its fair value, with changes in fair value recognized currently in “Realized investment gains (losses), net”. The component of AOCI related to discontinued cash flow hedges is reclassified to the Consolidated Statements of Operations line associated with the hedged cash flows consistent with the earnings impact of the original hedged cash flows.
23
PRUCO LIFE INSURANCE COMPANY
Notes to Consolidated Financial Statements—(Continued)
When hedge accounting is discontinued because the hedged item no longer meets the definition of a firm commitment, or because it is probable that the forecasted transaction will not occur by the end of the specified time period, the derivative will continue to be carried on the balance sheet at its fair value, with changes in fair value recognized currently in “Realized investment gains (losses), net”. Any asset or liability that was recorded pursuant to recognition of the firm commitment is removed from the balance sheet and recognized currently in “Realized investment gains (losses), net”. Gains and losses that were in AOCI pursuant to the hedge of a forecasted transaction are recognized immediately in “Realized investment gains (losses), net”.
If a derivative does not qualify for hedge accounting, all changes in its fair value, including net receipts and payments, are included in “Realized investment gains (losses), net” without considering changes in the fair value of the economically associated assets or liabilities.
The Company is a party to financial instruments that contain derivative instruments that are “embedded” in the financial instruments. At inception, the Company assesses whether the economic characteristics of the embedded instrument are clearly and closely related to the economic characteristics of the remaining component of the financial instrument (i.e., the host contract) and whether a separate instrument with the same terms as the embedded instrument would meet the definition of a derivative instrument. When it is determined that (1) the embedded instrument possesses economic characteristics that are not clearly and closely related to the economic characteristics of the host contract, and (2) a separate instrument with the same terms would qualify as a derivative instrument, the embedded instrument qualifies as an embedded derivative that is separated from the host contract, carried at fair value, and changes in its fair value are included in “Realized investment gains (losses), net”. For certain financial instruments that contain an embedded derivative that otherwise would need to be bifurcated and reported at fair value, the Company may elect to carry the entire instrument at fair value and report it within "Other invested assets" and "Reinsurance recoverable and deposit receivables", or as liabilities, within “Payables to parent and affiliates” or "Reinsurance and funds withheld payables".
The Company sells variable annuity contracts that include optional living benefit features that may be treated from an accounting perspective as embedded derivatives. The embedded derivatives related to the living benefit features and the related reinsurance agreements are carried at fair value and included in “Future policy benefits" and “Reinsurance recoverables and deposit receivables”. Additionally, changes in the fair value are determined using valuation models as described in Note 6 and are recorded in “Realized investment gains (losses), net".
Reinsurance
The Company participates in reinsurance arrangements in various capacities as either the ceding entity or as the reinsurer (i.e., assuming entity). See Note 12 for additional information regarding the Company’s reinsurance arrangements. Reinsurance assumed business is generally accounted for consistent with direct business. Amounts currently recoverable under reinsurance agreements are included in “Reinsurance recoverables and deposit receivables” and amounts payable are included in “Reinsurance and funds withheld payables”. “Reinsurance recoverables and deposit receivables” also includes deposit receivables where the Company has ceded fixed indexed annuities, including from coinsurance with funds withheld arrangements and receivables from modified coinsurance arrangements where the Company is the cedant, and in certain instances are net of the payables under these arrangements which generally reflect the fair value of the invested assets retained by the cedant. “Reinsurance and funds withheld payables” also includes amounts payable to the reinsurer under coinsurance with funds withheld arrangements where the Company is the cedant, and generally reflect the fair value of the invested assets retained by the Company. The receivables and payables associated with each of these coinsurance with funds withheld and modified coinsurance arrangements each contain an embedded derivative that is bifurcated and accounted for at fair value separately from the host contract, with changes in fair value recorded through “Realized investment gains (losses), net”, and are ultimately presented net within “Reinsurance recoverables and deposit receivables”. Revenues and benefits and expenses include amounts assumed under reinsurance agreements and are reflected net of reinsurance ceded.
Reinsurance ceded arrangements do not discharge the Company as the primary insurer. Ceded balances would represent a liability of the Company in the event the reinsurers were unable to meet their obligations to the Company under the terms of the reinsurance agreements. Reinsurance recoverables are reported on the Consolidated Statements of Financial Position net of the CECL allowance. The CECL allowance considers the credit quality of the reinsurance counterparty and is generally determined based on the probability of default and loss given default assumptions, after considering any applicable collateral arrangements. The CECL allowance does not apply to reinsurance recoverables with affiliated counterparties under common control. Additions to or releases of the allowance are reported in “Policyholders’ benefits”. Reinsurance premiums, commissions, expense reimbursements, benefits and reserves related to reinsured long-duration contracts under coinsurance arrangements are accounted for over the life of the underlying reinsured contracts using assumptions consistent with those used to account for the underlying contracts. For reinsurance of in force blocks of non-participating traditional and limited-payment contracts, the current value of the direct liability as of inception of the reinsurance agreement is used to calculate the reinsurance recoverable and cost of reinsurance such that there is no immediate other
24
PRUCO LIFE INSURANCE COMPANY
Notes to Consolidated Financial Statements—(Continued)
comprehensive income or loss from recognition of the reinsurance recoverable at inception. Consistent with the direct liability, the reinsurance recoverable for non-participating traditional and limited-payment contracts is remeasured each period using current single A rates with the effect on the reinsurance recoverable resulting from such updates recorded in "Interest rate remeasurement of future policy benefits" in OCI. For reinsurance of limited-payment contracts, the Company establishes a cost of reinsurance asset relating to the direct DPL and amortizes this balance through “Premiums” using the same methodology and assumptions used to amortize the direct DPL.
For reinsurance of existing in force blocks of long-duration contracts that transfer significant insurance risk, the difference between the fair value of the net consideration exchanged and the net liabilities ceded related to the underlying reinsured contracts is considered the net cost of reinsurance at the inception of the reinsurance agreement. This initial net cost of reinsurance is deferred and amortized into income over the remaining life of the reinsured policies on a basis consistent with the methodologies and assumptions used for amortizing DAC. This initial net cost of reinsurance may result in a deferred reinsurance gain which is recorded in "Other liabilities" and amortized through "Other income (loss)", or a deferred reinsurance loss which is recorded in "Other assets" and amortized through "General, administrative and other expenses".
Consistent with direct contracts, reinsurance agreements may also include features that meet the definition of an MRB and, if so, are accounted for at fair value. The fair value of direct or assumed MRBs reflects the Company's NPR, while the fair value of ceded MRBs reflects the counterparty credit risk of the reinsurer. Changes in the fair value of ceded MRBs, including the impact of changes in counterparty credit risk, are recorded in net income in "Change in value of market risk benefits, net of related hedging gains (losses)".
Coinsurance arrangements contrast with the Company’s yearly renewable term ("YRT") arrangements, where only mortality risk is transferred to the reinsurer and premiums are paid to the reinsurer to reinsure that risk. The mortality risk that is reinsured under YRT arrangements represents the difference between the stated death benefits in the underlying reinsured contracts and the corresponding reserves or account value carried by the Company on those same contracts. The premiums paid to the reinsurer are based upon negotiated amounts, not on the actual premiums paid by the underlying contractholders to the Company. As YRT arrangements are usually entered into by the Company with the expectation that the contracts will be in force for the lives of the underlying policies, they are considered to be long-duration reinsurance contracts. The cost of reinsurance for universal life products is generally recognized based on the gross assessments of the underlying direct policies. The cost of reinsurance for term insurance products is generally recognized in proportion to direct premiums over the life of the underlying policies.
If the Company determines that a reinsurance agreement does not expose the reinsurer to a reasonable possibility of a significant loss from insurance risk, the Company records the agreement using the deposit method of accounting. Deposits received are included in “Reinsurance and funds withheld payables” and deposits made are included in “Reinsurance recoverables and deposit receivables”. As amounts are paid or received, consistent with the underlying contracts, the deposit assets or liabilities are adjusted. Interest on such deposits is recorded as “Other income (loss)” or “General, administrative and other expenses”, as appropriate.
25
PRUCO LIFE INSURANCE COMPANY
Notes to Consolidated Financial Statements—(Continued)
RECENT ACCOUNTING PRONOUNCEMENTS
Changes to U.S. GAAP are established by the Financial Accounting Standards Board (“FASB”) in the form of Accounting Standards Updates ("ASUs") to the FASB Accounting Standards Codification ("ASC"). The Company considers the applicability and impact of all ASUs. ASUs listed below include those that have been adopted during the current fiscal year and/or those that have been issued but not yet adopted as of December 31, 2025, and as of the date of this filing. ASUs not listed below were assessed and determined to be either not applicable or not material.
ASUs adopted during the year ended December 31, 2025
| Standard | Description | Effective date and method of adoption | Effect on the financial statements or other significant matters | |||||||||||||||||
| ASU 2023-09—Income Taxes (Topic 740) Improvements to Income Tax Disclosures | This ASU requires entities to provide additional information primarily related to the effective tax rate reconciliation and income taxes paid. | January 1, 2025 using the prospective method. | Adoption of the ASU did not have an impact on the Company's Consolidated Financial Statements but resulted in expanded disclosures in the Notes to the Consolidated Financial Statements. | |||||||||||||||||
ASUs issued but not yet adopted as of December 31, 2025
| Standard | Description | Effective date and method of adoption | Effect on the financial statements or other significant matters | |||||||||||||||||
| ASU 2024-03—Income Statement—Reporting Comprehensive Income—Expense Disaggregation Disclosures (Subtopic 220-40): Disaggregation of Income Statement Expenses | This ASU requires public companies to disclose, in interim and annual reporting periods, additional information about certain expenses in the notes to financial statements. | Effective for fiscal years beginning after December 15, 2026, and interim periods within fiscal years beginning after December 15, 2027, with early adoption permitted and applied either prospectively or retrospectively. | The Company is currently assessing the impact of the ASU on the Company’s Consolidated Financial Statements and Notes to the Consolidated Financial Statements. | |||||||||||||||||
26
PRUCO LIFE INSURANCE COMPANY
Notes to Consolidated Financial Statements—(Continued)
3. INVESTMENTS
Fixed Maturity Securities
The following tables set forth the composition of fixed maturity securities (excluding investments classified as trading), as of the dates indicated:
| December 31, 2025 | |||||||||||||||||||||||||||||
| Amortized Cost | Gross Unrealized Gains | Gross Unrealized Losses | Allowance for Credit Losses | Fair Value | |||||||||||||||||||||||||
| (in thousands) | |||||||||||||||||||||||||||||
| Fixed maturities, available-for-sale: | |||||||||||||||||||||||||||||
| U.S. Treasury securities and obligations of U.S. government authorities and agencies | $ | $ | $ | $ | $ | ||||||||||||||||||||||||
| Obligations of U.S. states and their political subdivisions | |||||||||||||||||||||||||||||
| Foreign government securities | |||||||||||||||||||||||||||||
| U.S. public corporate securities | |||||||||||||||||||||||||||||
| U.S. private corporate securities | |||||||||||||||||||||||||||||
| Foreign public corporate securities | |||||||||||||||||||||||||||||
| Foreign private corporate securities | |||||||||||||||||||||||||||||
| Asset-backed securities(1) | |||||||||||||||||||||||||||||
| Commercial mortgage-backed securities | |||||||||||||||||||||||||||||
| Residential mortgage-backed securities(2) | |||||||||||||||||||||||||||||
| Total fixed maturities, available-for-sale | $ | $ | $ | $ | $ | ||||||||||||||||||||||||
(1) Includes credit-tranched securities collateralized by loan obligations, home equity loans, auto loans and education loans.
(2) Includes publicly-traded agency pass-through securities and collateralized mortgage obligations.
| December 31, 2024 | |||||||||||||||||||||||||||||
| Amortized Cost | Gross Unrealized Gains | Gross Unrealized Losses | Allowance for Credit Losses | Fair Value | |||||||||||||||||||||||||
| (in thousands) | |||||||||||||||||||||||||||||
| Fixed maturities, available-for-sale: | |||||||||||||||||||||||||||||
| U.S. Treasury securities and obligations of U.S. government authorities and agencies | $ | $ | $ | $ | $ | ||||||||||||||||||||||||
| Obligations of U.S. states and their political subdivisions | |||||||||||||||||||||||||||||
| Foreign government securities | |||||||||||||||||||||||||||||
| U.S. public corporate securities | |||||||||||||||||||||||||||||
| U.S. private corporate securities | |||||||||||||||||||||||||||||
| Foreign public corporate securities | |||||||||||||||||||||||||||||
| Foreign private corporate securities | |||||||||||||||||||||||||||||
| Asset-backed securities(1) | |||||||||||||||||||||||||||||
| Commercial mortgage-backed securities | |||||||||||||||||||||||||||||
| Residential mortgage-backed securities(2) | |||||||||||||||||||||||||||||
| Total fixed maturities, available-for-sale | $ | $ | $ | $ | $ | ||||||||||||||||||||||||
(1) Includes credit-tranched securities collateralized by loan obligations, home equity loans, auto loans and education loans.
(2) Includes publicly-traded agency pass-through securities and collateralized mortgage obligations.
27
PRUCO LIFE INSURANCE COMPANY
Notes to Consolidated Financial Statements—(Continued)
The following tables set forth the fair value and gross unrealized losses on available-for-sale fixed maturity securities without an allowance for credit losses aggregated by investment category and length of time that individual fixed maturity securities had been in a continuous unrealized loss position, as of the dates indicated:
| December 31, 2025 | |||||||||||||||||||||||||||||||||||
| Less Than Twelve Months | Twelve Months or More | Total | |||||||||||||||||||||||||||||||||
| Fair Value | Gross Unrealized Losses | Fair Value | Gross Unrealized Losses | Fair Value | Gross Unrealized Losses | ||||||||||||||||||||||||||||||
| (in thousands) | |||||||||||||||||||||||||||||||||||
| Fixed maturities, available-for-sale: | |||||||||||||||||||||||||||||||||||
| U.S. Treasury securities and obligations of U.S. government authorities and agencies | $ | $ | $ | $ | $ | $ | |||||||||||||||||||||||||||||
| Obligations of U.S. states and their political subdivisions | |||||||||||||||||||||||||||||||||||
| Foreign government securities | |||||||||||||||||||||||||||||||||||
| U.S. public corporate securities | |||||||||||||||||||||||||||||||||||
| U.S. private corporate securities | |||||||||||||||||||||||||||||||||||
| Foreign public corporate securities | |||||||||||||||||||||||||||||||||||
| Foreign private corporate securities | |||||||||||||||||||||||||||||||||||
| Asset-backed securities | |||||||||||||||||||||||||||||||||||
| Commercial mortgage-backed securities | |||||||||||||||||||||||||||||||||||
| Residential mortgage-backed securities | |||||||||||||||||||||||||||||||||||
| Total fixed maturities, available-for-sale | $ | $ | $ | $ | $ | $ | |||||||||||||||||||||||||||||
| December 31, 2024 | |||||||||||||||||||||||||||||||||||
| Less Than Twelve Months | Twelve Months or More | Total | |||||||||||||||||||||||||||||||||
| Fair Value | Gross Unrealized Losses | Fair Value | Gross Unrealized Losses | Fair Value | Gross Unrealized Losses | ||||||||||||||||||||||||||||||
| (in thousands) | |||||||||||||||||||||||||||||||||||
| Fixed maturities, available-for-sale: | |||||||||||||||||||||||||||||||||||
| U.S. Treasury securities and obligations of U.S. government authorities and agencies | $ | $ | $ | $ | $ | $ | |||||||||||||||||||||||||||||
| Obligations of U.S. states and their political subdivisions | |||||||||||||||||||||||||||||||||||
| Foreign government securities | |||||||||||||||||||||||||||||||||||
| U.S. public corporate securities | |||||||||||||||||||||||||||||||||||
| U.S. private corporate securities | |||||||||||||||||||||||||||||||||||
| Foreign public corporate securities | |||||||||||||||||||||||||||||||||||
| Foreign private corporate securities | |||||||||||||||||||||||||||||||||||
| Asset-backed securities | |||||||||||||||||||||||||||||||||||
| Commercial mortgage-backed securities | |||||||||||||||||||||||||||||||||||
| Residential mortgage-backed securities | |||||||||||||||||||||||||||||||||||
| Total fixed maturities, available-for-sale | $ | $ | $ | $ | $ | $ | |||||||||||||||||||||||||||||
As of December 31, 2025 and 2024, the gross unrealized losses on fixed maturity, available-for-sale securities without an allowance of $1,469 million and $2,059 million, respectively, related to “1” highest quality or “2” high quality securities based on the National Association of Insurance Commissioners (“NAIC”) or equivalent rating and $46 million and $102 million, respectively, related to other than high or highest quality securities based on NAIC or equivalent rating. As of December 31, 2025, the $1,462 million of gross unrealized losses of twelve months or more were concentrated in the Company’s corporate securities within the finance, consumer non-cyclical and utility sectors. As of December 31, 2024, the $1,894 million of gross unrealized losses of twelve months or more were concentrated in the Company's corporate securities within the finance, consumer non-cyclical and utility sectors.
28
PRUCO LIFE INSURANCE COMPANY
Notes to Consolidated Financial Statements—(Continued)
In accordance with its policy described in Note 2, the Company concluded that an adjustment to earnings for credit losses related to these fixed maturity securities was not warranted at December 31, 2025. This conclusion was based on a detailed analysis of the underlying credit and cash flows for each security. Gross unrealized losses are primarily attributable to increases in interest rates, general credit spread widening and foreign currency exchange rate movements. As of December 31, 2025, the Company did not intend to sell these securities, and it was not more likely than not that the Company would be required to sell these securities before the anticipated recovery of the remaining amortized cost basis.
The following table sets forth the amortized cost and fair value of fixed maturities by contractual maturities, as of the date indicated:
| December 31, 2025 | ||||||||||||||
| Amortized Cost | Fair Value | |||||||||||||
| (in thousands) | ||||||||||||||
| Fixed maturities, available-for-sale: | ||||||||||||||
| Due in one year or less | $ | $ | ||||||||||||
| Due after one year through five years | ||||||||||||||
| Due after five years through ten years | ||||||||||||||
| Due after ten years | ||||||||||||||
| Asset-backed securities | ||||||||||||||
| Commercial mortgage-backed securities | ||||||||||||||
| Residential mortgage-backed securities | ||||||||||||||
| Total fixed maturities, available-for-sale | $ | $ | ||||||||||||
Actual maturities may differ from contractual maturities because issuers may have the right to call or prepay obligations. Asset-backed, commercial mortgage-backed and residential mortgage-backed securities are shown separately in the table above, as they do not have a single maturity date.
The following table sets forth the sources of fixed maturity proceeds and related investment gains (losses), as well as losses on write-downs and the allowance for credit losses of fixed maturities, for the periods indicated:
| Years Ended December 31 | ||||||||||||||||||||
| 2025 | 2024 | 2023 | ||||||||||||||||||
| (in thousands) | ||||||||||||||||||||
| Fixed maturities, available-for-sale: | ||||||||||||||||||||
| Proceeds from sales(1) | $ | $ | $ | |||||||||||||||||
| Proceeds from maturities/prepayments | ||||||||||||||||||||
| Gross investment gains from sales and maturities | ||||||||||||||||||||
| Gross investment losses from sales and maturities | ( | ( | ( | |||||||||||||||||
| Write-downs recognized in earnings(2) | ( | ( | ( | |||||||||||||||||
| (Addition to) release of allowance for credit losses | ( | |||||||||||||||||||
(1)Excludes activity from non-cash related proceeds due to the timing of trade settlements of $106.2 million, $(158.4 ) million and $57.4 million for the years ended December 31, 2025, 2024, and 2023, respectively.
(2)Amounts represent write-downs of credit adverse securities and securities actively marketed for sale.
29
PRUCO LIFE INSURANCE COMPANY
Notes to Consolidated Financial Statements—(Continued)
The following tables set forth the balance of and changes in the allowance for credit losses for fixed maturity securities, as of and for the periods indicated:
| Year Ended December 31, 2025 | |||||||||||||||||||||||||||||||||||||||||
| U.S. Treasury Securities and Obligations of U.S. States | Foreign Government Securities | U.S. and Foreign Corporate Securities | Asset-Backed Securities | Commercial Mortgage-Backed Securities | Residential Mortgage-Backed Securities | Total | |||||||||||||||||||||||||||||||||||
| (in thousands) | |||||||||||||||||||||||||||||||||||||||||
| Fixed maturities, available-for-sale: | |||||||||||||||||||||||||||||||||||||||||
| Balance, beginning of period | $ | $ | $ | $ | $ | $ | $ | ||||||||||||||||||||||||||||||||||
| Additions to allowance for credit losses not previously recorded | |||||||||||||||||||||||||||||||||||||||||
| Reductions for securities sold during the period | ( | ( | ( | ||||||||||||||||||||||||||||||||||||||
| Additions (reductions) on securities with previous allowance | ( | ||||||||||||||||||||||||||||||||||||||||
| Write-downs charged against the allowance | ( | ( | |||||||||||||||||||||||||||||||||||||||
| Balance, end of period | $ | $ | $ | $ | $ | $ | $ | ||||||||||||||||||||||||||||||||||
| Year Ended December 31, 2024 | |||||||||||||||||||||||||||||||||||||||||
| U.S. Treasury Securities and Obligations of U.S. States | Foreign Government Securities | U.S. and Foreign Corporate Securities | Asset-Backed Securities | Commercial Mortgage-Backed Securities | Residential Mortgage-Backed Securities | Total | |||||||||||||||||||||||||||||||||||
| (in thousands) | |||||||||||||||||||||||||||||||||||||||||
| Fixed maturities, available-for-sale: | |||||||||||||||||||||||||||||||||||||||||
| Balance, beginning of period | $ | $ | $ | $ | $ | $ | $ | ||||||||||||||||||||||||||||||||||
| Additions to allowance for credit losses not previously recorded | |||||||||||||||||||||||||||||||||||||||||
| Reductions for securities sold during the period | ( | ( | |||||||||||||||||||||||||||||||||||||||
| Additions (reductions) on securities with previous allowance | ( | ( | |||||||||||||||||||||||||||||||||||||||
| Assets transferred (to) from parent and affiliates | |||||||||||||||||||||||||||||||||||||||||
| Balance, end of period | $ | $ | $ | $ | $ | $ | $ | ||||||||||||||||||||||||||||||||||
See Note 2 for additional information about the Company's methodology for developing its allowance and expected losses.
For the year ended December 31, 2025, the net decrease in the allowance for credit losses on available-for-sale securities was primarily related to write-downs of distressed securities, partially offset by net additions in the communications and transportation sectors within corporate securities due to adverse projected cash flows.
For the year ended December 31, 2024, the net increase in the allowance for credit losses on available-for-sale securities was primarily related to net additions within the consumer cyclical, consumer non-cyclical and energy sectors within corporate securities due to adverse projected cash flows.
The Company did not
Fixed Maturities, Trading
30
PRUCO LIFE INSURANCE COMPANY
Notes to Consolidated Financial Statements—(Continued)
The net change in unrealized gains (losses) from fixed maturities, trading still held at period end, recorded within “Other income (loss),” was $231.7 million, $(182.9 ) million and $65.6 million during the years ended December 31, 2025, 2024 and 2023, respectively.
Equity Securities
The net change in unrealized gains (losses) from equity securities still held at period end, recorded within “Other income (loss)," was $(86.3 ) million, $(34.2 ) million and $25.8 million during the years ended December 31, 2025, 2024 and 2023, respectively.
Commercial Mortgage and Other Loans
The following table sets forth the composition of “Commercial mortgage and other loans”, as of the dates indicated:
| December 31, 2025 | December 31, 2024 | |||||||||||||||||||||||||
| Amount | % of Total | Amount | % of Total | |||||||||||||||||||||||
| ($ in thousands) | ||||||||||||||||||||||||||
| Commercial mortgage and agricultural property loans by property type: | ||||||||||||||||||||||||||
| Apartments/Multi-Family | $ | % | $ | % | ||||||||||||||||||||||
| Health Care Senior Living(1) | ||||||||||||||||||||||||||
| Hospitality | ||||||||||||||||||||||||||
| Industrial | ||||||||||||||||||||||||||
| Office | ||||||||||||||||||||||||||
| Retail | ||||||||||||||||||||||||||
| Self-Storage(1) | ||||||||||||||||||||||||||
| Other(1) | ||||||||||||||||||||||||||
| Total commercial mortgage loans | ||||||||||||||||||||||||||
| Agricultural property loans | ||||||||||||||||||||||||||
| Total commercial mortgage and agricultural property loans | % | % | ||||||||||||||||||||||||
| Allowance for credit losses | ( | ( | ||||||||||||||||||||||||
| Total net commercial mortgage and agricultural property loans | ||||||||||||||||||||||||||
| Other loans: | ||||||||||||||||||||||||||
Residential mortgage loans | ||||||||||||||||||||||||||
| Other collateralized loans | ||||||||||||||||||||||||||
| Total other loans | ||||||||||||||||||||||||||
Allowance for credit losses | ( | |||||||||||||||||||||||||
| Total net other loans | ||||||||||||||||||||||||||
| Total net commercial mortgage and other loans | $ | $ | ||||||||||||||||||||||||
As of December 31, 2025, the commercial mortgage and agricultural property loans were secured by properties geographically dispersed throughout the United States with the largest concentrations in California (23 %), Florida (8 %) and Texas (8 %) and included loans secured by properties in Europe (8 %), Australia (1 %) and Mexico (1 %).
As of December 31, 2025, the residential mortgage loans were secured by properties geographically dispersed throughout the United States with the largest concentrations in Florida (13 %), California (10 %) and New York (9 %).
31
PRUCO LIFE INSURANCE COMPANY
Notes to Consolidated Financial Statements—(Continued)
The following table sets forth the balance of and changes in the allowance for credit losses for commercial mortgage and other loans, as of and for the periods ended:
| Commercial Mortgage Loans | Agricultural Property Loans | Residential Mortgage Loans | Total | ||||||||||||||||||||
| (in thousands) | |||||||||||||||||||||||
| Balance at December 31, 2022 | $ | $ | $ | $ | |||||||||||||||||||
| Addition to (release of) allowance for expected losses | |||||||||||||||||||||||
| Balance at December 31, 2023 | |||||||||||||||||||||||
| Addition to (release of) allowance for expected losses | |||||||||||||||||||||||
| Write-downs charged against allowance | ( | ( | |||||||||||||||||||||
| Balance at December 31, 2024 | |||||||||||||||||||||||
| Addition to (release of) allowance for expected losses | |||||||||||||||||||||||
| Write-downs charged against allowance | ( | ( | ( | ||||||||||||||||||||
| Balance at December 31, 2025 | $ | $ | $ | $ | |||||||||||||||||||
See Note 2 for additional information about the Company's methodology for developing the allowance and expected losses.
For the year ended December 31, 2025, the net increase to the allowance for credit losses on commercial mortgage and other loans was primarily related to increases in loan specific allowances in commercial mortgage loans within the retail sector and in agricultural property loans along with the establishment of general reserves for residential mortgage loans, partially offset by write-downs against loan-specific reserves within agricultural property loans and the retail sector of commercial mortgage loans.
For the year ended December 31, 2024, net additions to the allowance for credit losses on commercial mortgage and other loans were primarily related to increases in loan-specific allowances in commercial mortgage loans within the retail and office sectors and in agricultural property loans.
The following table sets forth the write-downs of commercial mortgage and other loans by origination year for the year ended December 31, 2025:
| December 31, 2025 | |||||||||||||||||||||||||||||||||||||||||
| Amortized Cost by Origination Year | |||||||||||||||||||||||||||||||||||||||||
| 2025 | 2024 | 2023 | 2022 | 2021 | Prior | Total | |||||||||||||||||||||||||||||||||||
(in thousands) | |||||||||||||||||||||||||||||||||||||||||
Commercial mortgage loans | $ | $ | $ | $ | $ | $ | $ | ||||||||||||||||||||||||||||||||||
Agricultural property loans | |||||||||||||||||||||||||||||||||||||||||
| Total | $ | $ | $ | $ | $ | $ | $ | ||||||||||||||||||||||||||||||||||
For the year ended December 31, 2024, there were $9.4 million of write-downs charged against the allowance related to a loan originated in 2016.
32
PRUCO LIFE INSURANCE COMPANY
Notes to Consolidated Financial Statements—(Continued)
The following tables set forth key credit quality indicators based upon the recorded investment gross of allowance for credit losses, as of the dates indicated:
| December 31, 2025 | |||||||||||||||||||||||||||||||||||||||||||||||
| Amortized Cost by Origination Year | |||||||||||||||||||||||||||||||||||||||||||||||
| 2025 | 2024 | 2023 | 2022 | 2021 | Prior | Revolving Loans | Total | ||||||||||||||||||||||||||||||||||||||||
| (in thousands) | |||||||||||||||||||||||||||||||||||||||||||||||
| Commercial mortgage loans | |||||||||||||||||||||||||||||||||||||||||||||||
| Loan-to-Value Ratio: | |||||||||||||||||||||||||||||||||||||||||||||||
| 0%-59.99% | $ | $ | $ | $ | $ | $ | $ | $ | |||||||||||||||||||||||||||||||||||||||
| 60%-69.99% | |||||||||||||||||||||||||||||||||||||||||||||||
| 70%-79.99% | |||||||||||||||||||||||||||||||||||||||||||||||
| 80% or greater | |||||||||||||||||||||||||||||||||||||||||||||||
| Total | $ | $ | $ | $ | $ | $ | $ | $ | |||||||||||||||||||||||||||||||||||||||
| Debt Service Coverage Ratio: | |||||||||||||||||||||||||||||||||||||||||||||||
| Greater than 1.2x | $ | $ | $ | $ | $ | $ | $ | $ | |||||||||||||||||||||||||||||||||||||||
| 1.0 - 1.2x | |||||||||||||||||||||||||||||||||||||||||||||||
| Less than 1.0x | |||||||||||||||||||||||||||||||||||||||||||||||
| Total | $ | $ | $ | $ | $ | $ | $ | $ | |||||||||||||||||||||||||||||||||||||||
| Agricultural property loans | |||||||||||||||||||||||||||||||||||||||||||||||
| Loan-to-Value Ratio: | |||||||||||||||||||||||||||||||||||||||||||||||
| 0%-59.99% | $ | $ | $ | $ | $ | $ | $ | $ | |||||||||||||||||||||||||||||||||||||||
| 60%-69.99% | |||||||||||||||||||||||||||||||||||||||||||||||
| 70%-79.99% | |||||||||||||||||||||||||||||||||||||||||||||||
| 80% or greater | |||||||||||||||||||||||||||||||||||||||||||||||
| Total | $ | $ | $ | $ | $ | $ | $ | $ | |||||||||||||||||||||||||||||||||||||||
| Debt Service Coverage Ratio: | |||||||||||||||||||||||||||||||||||||||||||||||
| Greater than 1.2x | $ | $ | $ | $ | $ | $ | $ | $ | |||||||||||||||||||||||||||||||||||||||
| 1.0 - 1.2x | |||||||||||||||||||||||||||||||||||||||||||||||
| Less than 1.0x | |||||||||||||||||||||||||||||||||||||||||||||||
| Total | $ | $ | $ | $ | $ | $ | $ | $ | |||||||||||||||||||||||||||||||||||||||
33
PRUCO LIFE INSURANCE COMPANY
Notes to Consolidated Financial Statements—(Continued)
| December 31, 2024 | |||||||||||||||||||||||||||||||||||||||||||||||
| Amortized Cost by Origination Year | |||||||||||||||||||||||||||||||||||||||||||||||
| 2024 | 2023 | 2022 | 2021 | 2020 | Prior | Revolving Loans | Total | ||||||||||||||||||||||||||||||||||||||||
| (in thousands) | |||||||||||||||||||||||||||||||||||||||||||||||
| Commercial mortgage loans | |||||||||||||||||||||||||||||||||||||||||||||||
| Loan-to-Value Ratio: | |||||||||||||||||||||||||||||||||||||||||||||||
| 0%-59.99% | $ | $ | $ | $ | $ | $ | $ | $ | |||||||||||||||||||||||||||||||||||||||
| 60%-69.99% | |||||||||||||||||||||||||||||||||||||||||||||||
| 70%-79.99% | |||||||||||||||||||||||||||||||||||||||||||||||
| 80% or greater | |||||||||||||||||||||||||||||||||||||||||||||||
| Total | $ | $ | $ | $ | $ | $ | $ | $ | |||||||||||||||||||||||||||||||||||||||
| Debt Service Coverage Ratio: | |||||||||||||||||||||||||||||||||||||||||||||||
| Greater than 1.2x | $ | $ | $ | $ | $ | $ | $ | $ | |||||||||||||||||||||||||||||||||||||||
| 1.0 - 1.2x | |||||||||||||||||||||||||||||||||||||||||||||||
| Less than 1.0x | |||||||||||||||||||||||||||||||||||||||||||||||
| Total | $ | $ | $ | $ | $ | $ | $ | $ | |||||||||||||||||||||||||||||||||||||||
| Agricultural property loans | |||||||||||||||||||||||||||||||||||||||||||||||
| Loan-to-Value Ratio: | |||||||||||||||||||||||||||||||||||||||||||||||
| 0%-59.99% | $ | $ | $ | $ | $ | $ | $ | $ | |||||||||||||||||||||||||||||||||||||||
| 60%-69.99% | |||||||||||||||||||||||||||||||||||||||||||||||
| 70%-79.99% | |||||||||||||||||||||||||||||||||||||||||||||||
| 80% or greater | |||||||||||||||||||||||||||||||||||||||||||||||
| Total | $ | $ | $ | $ | $ | $ | $ | $ | |||||||||||||||||||||||||||||||||||||||
| Debt Service Coverage Ratio: | |||||||||||||||||||||||||||||||||||||||||||||||
| Greater than 1.2x | $ | $ | $ | $ | $ | $ | $ | $ | |||||||||||||||||||||||||||||||||||||||
| 1.0 - 1.2x | |||||||||||||||||||||||||||||||||||||||||||||||
| Less than 1.0x | |||||||||||||||||||||||||||||||||||||||||||||||
| Total | $ | $ | $ | $ | $ | $ | $ | $ | |||||||||||||||||||||||||||||||||||||||
Residential mortgage loans primarily include fixed-rate, amortizing mortgage loans on rental properties owned by borrowers with Fair Isaac Corporation ("FICO") scores typically considered prime or above. The primary credit quality indicator is whether a loan is performing or nonperforming. The Company defines nonperforming residential mortgage loans as those that are 90 days or more past due and/or in nonaccrual status.
| December 31, 2025 | |||||||||||||||||||||||||||||||||||||||||
| Amortized Cost by Origination Year | |||||||||||||||||||||||||||||||||||||||||
| 2025 | 2024 | 2023 | 2022 | 2021 | Prior | Total | |||||||||||||||||||||||||||||||||||
(in thousands) | |||||||||||||||||||||||||||||||||||||||||
Residential mortgage loans | |||||||||||||||||||||||||||||||||||||||||
Performance indicators: | |||||||||||||||||||||||||||||||||||||||||
Performing | $ | $ | $ | $ | $ | $ | $ | ||||||||||||||||||||||||||||||||||
Nonperforming | |||||||||||||||||||||||||||||||||||||||||
| Total | $ | $ | $ | $ | $ | $ | $ | ||||||||||||||||||||||||||||||||||
34
PRUCO LIFE INSURANCE COMPANY
Notes to Consolidated Financial Statements—(Continued)
See Note 2 for additional information about the Company’s commercial mortgage and other loans credit quality monitoring process.
The Company may grant loan modifications in its commercial mortgage and other loan portfolios to borrowers experiencing financial difficulties. These loan modifications may be in the form of principal forgiveness, interest rate reduction, other-than-insignificant payment delay, term extension or some combination thereof. The amount, timing and extent of modifications granted and subsequent performance are considered in determining any allowance for credit losses.
The following tables set forth the amortized cost basis of loan modifications made to borrowers experiencing financial difficulties during the periods indicated:
| Year Ended December 31, 2025 | ||||||||||||||||||||
| Term Extension | Other Than Insignificant Delay in Payment | % of Amortized Cost | ||||||||||||||||||
| ($ in thousands) | ||||||||||||||||||||
| Commercial mortgage loans | $ | $ | % | |||||||||||||||||
| Year Ended December 31, 2024 | ||||||||||||||||||||
| Term Extension | Other Than Insignificant Delay in Payment | % of Amortized Cost | ||||||||||||||||||
| ($ in thousands) | ||||||||||||||||||||
| Commercial mortgage loans | $ | $ | % | |||||||||||||||||
During the year ended December 31, 2024, the modifications added less than one year to the weighted average life in the commercial mortgage loan portfolio.
The Company did not have any commitments to lend additional funds to borrowers experiencing financial difficulties on modified loans as of both December 31, 2025 and 2024.
The following tables set forth an aging of past due commercial mortgage and other loans based upon the recorded investment gross of allowance for credit losses, as well as the amount of commercial mortgage and other loans on non-accrual status, as of the dates indicated:
| December 31, 2025 | |||||||||||||||||||||||||||||||||||
| Current | 30-59 Days Past Due | 60-89 Days Past Due | 90 Days or More Past Due(1) | Total Loans | Non-Accrual Status(2) | ||||||||||||||||||||||||||||||
| (in thousands) | |||||||||||||||||||||||||||||||||||
| Commercial mortgage loans | $ | $ | $ | $ | $ | $ | |||||||||||||||||||||||||||||
| Agricultural property loans | |||||||||||||||||||||||||||||||||||
| Residential mortgage loans | |||||||||||||||||||||||||||||||||||
| Other collateralized loans | |||||||||||||||||||||||||||||||||||
| Total | $ | $ | $ | $ | $ | $ | |||||||||||||||||||||||||||||
(1)As of December 31, 2025, there were no loans in this category accruing interest.
(2)For additional information regarding the Company’s policies for accruing interest on loans, see Note 2.
35
PRUCO LIFE INSURANCE COMPANY
Notes to Consolidated Financial Statements—(Continued)
| December 31, 2024 | |||||||||||||||||||||||||||||||||||
| Current | 30-59 Days Past Due | 60-89 Days Past Due | 90 Days or More Past Due(1) | Total Loans | Non-Accrual Status(2) | ||||||||||||||||||||||||||||||
| (in thousands) | |||||||||||||||||||||||||||||||||||
| Commercial mortgage loans | $ | $ | $ | $ | $ | $ | |||||||||||||||||||||||||||||
| Agricultural property loans | |||||||||||||||||||||||||||||||||||
| Residential mortgage loans | |||||||||||||||||||||||||||||||||||
| Other collateralized loans | |||||||||||||||||||||||||||||||||||
| Total | $ | $ | $ | $ | $ | $ | |||||||||||||||||||||||||||||
(1)As of December 31, 2024, there were no loans in this category accruing interest.
(2)For additional information regarding the Company’s policies for accruing interest on loans, see Note 2.
Loans on non-accrual status recognized interest of $0.5 million and $0.7 million for the years ended December 31, 2025 and 2024, respectively. Loans on non-accrual status that did not have a related allowance for credit losses were $21.2 million and $2.0 million as of December 31, 2025 and 2024, respectively.
For the years ended December 31, 2025 and 2024, there were $589.9 million and $12.6 million, respectively, of commercial mortgage and other loans acquired, other than those through direct origination. For the year ended December 31, 2025, there were $100.0 million commercial mortgage and other loans sold. For the year ended December 31, 2024, there were no commercial mortgage and other loans sold.
The Company did no
Other Invested Assets
The following table sets forth the composition of “Other invested assets”, as of the dates indicated:
| December 31, | |||||||||||
| 2025 | 2024 | ||||||||||
| (in thousands) | |||||||||||
| LPs/LLCs: | |||||||||||
| Equity method: | |||||||||||
| Private equity | $ | $ | |||||||||
| Hedge funds | |||||||||||
| Real estate-related | |||||||||||
| Subtotal equity method | |||||||||||
| Fair value: | |||||||||||
| Private equity | |||||||||||
| Hedge funds | |||||||||||
| Real estate-related | |||||||||||
| Subtotal fair value | |||||||||||
| Total LPs/LLCs | |||||||||||
| Derivative instruments | |||||||||||
| Other(1) | |||||||||||
| Total other invested assets | $ | $ | |||||||||
(1)Includes tax advantaged investments and investments in separate account funds.
36
PRUCO LIFE INSURANCE COMPANY
Notes to Consolidated Financial Statements—(Continued)
Equity Method Investments
The following tables set forth summarized combined financial information for significant LP/LLC interests accounted for under the equity method, including the Company’s investments in operating joint ventures. Changes between periods in the tables below reflect changes in the activities within the operating joint ventures and LPs/LLCs, as well as changes in the Company’s level of investment in such entities:
| December 31, | ||||||||||||||
| 2025 | 2024 | |||||||||||||
| (in thousands) | ||||||||||||||
| STATEMENTS OF FINANCIAL POSITION | ||||||||||||||
| Total assets(1) | $ | $ | ||||||||||||
| Total liabilities(2) | $ | $ | ||||||||||||
| Partners’ capital | ||||||||||||||
| Total liabilities and partners’ capital | $ | $ | ||||||||||||
| Equity in LP/LLC interests included above | $ | $ | ||||||||||||
| Equity in LP/LLC interests not included above | ||||||||||||||
| Carrying value | $ | $ | ||||||||||||
(2)Amount represents gross assets of each fund where the Company has a significant investment. These assets consist primarily of investments in real estate, investments in securities and other miscellaneous assets.
(3)Amount represents gross liabilities of each fund where the Company has a significant investment. These liabilities consist primarily of third-party borrowed funds and other miscellaneous liabilities.
| Years Ended December 31, | ||||||||||||||||||||
| 2025 | 2024 | 2023 | ||||||||||||||||||
| (in thousands) | ||||||||||||||||||||
| STATEMENTS OF OPERATIONS | ||||||||||||||||||||
| Total revenues(1) | $ | $ | $ | |||||||||||||||||
| Total expenses(2) | ( | ( | ( | |||||||||||||||||
| Net earnings (losses) | $ | $ | $ | |||||||||||||||||
| Equity in net earnings (losses) of LP/LLC interests included above | $ | $ | $ | |||||||||||||||||
| Equity in net earnings (losses) of LP/LLC interests not included above | ||||||||||||||||||||
| Total equity in net earnings (losses) | $ | $ | $ | |||||||||||||||||
(1)Amount represents gross revenue of each fund where the Company has a significant investment. This revenue consists of income from investments in real estate, investments in securities and other income.
(2)Amount represents gross expenses of each fund where the Company has a significant investment. These expenses consist primarily of interest expense, investment management fees, salary expenses and other expenses.
Accrued Investment Income
The following table sets forth the composition of “Accrued investment income,” as of the dates indicated:
| December 31, | |||||||||||
| 2025 | 2024 | ||||||||||
| (in thousands) | |||||||||||
| Fixed maturities | $ | $ | |||||||||
| Equity securities | |||||||||||
| Commercial mortgage and other loans | |||||||||||
| Policy loans | |||||||||||
| Short-term investments and cash equivalents | |||||||||||
| Total accrued investment income | $ | $ | |||||||||
37
PRUCO LIFE INSURANCE COMPANY
Notes to Consolidated Financial Statements—(Continued)
There were no
Net Investment Income
The following table sets forth “Net investment income” by investment type, for the periods indicated:
| Years Ended December 31, | |||||||||||||||||
| 2025 | 2024 | 2023 | |||||||||||||||
| (in thousands) | |||||||||||||||||
| Fixed maturities, available-for-sale | $ | $ | $ | ||||||||||||||
| Fixed maturities, trading | |||||||||||||||||
| Equity securities | |||||||||||||||||
| Commercial mortgage and other loans | |||||||||||||||||
| Policy loans | |||||||||||||||||
| Other invested assets | |||||||||||||||||
| Short-term investments and cash equivalents | |||||||||||||||||
| Gross investment income | |||||||||||||||||
| Less: investment expenses | ( | ( | ( | ||||||||||||||
| Net investment income | $ | $ | $ | ||||||||||||||
The carrying value of non-income producing assets included $19.1 million in fixed maturities, available-for-sale and $0.2 million in fixed maturities, trading as of December 31, 2025. Non-income producing assets represent investments that had not produced income for the twelve months preceding December 31, 2025.
Realized Investment Gains (Losses), Net
The following table sets forth “Realized investment gains (losses), net” by investment type, for the periods indicated:
| Years Ended December 31, | |||||||||||||||||
| 2025 | 2024 | 2023 | |||||||||||||||
| (in thousands) | |||||||||||||||||
| Fixed maturities(1) | $ | ( | $ | ( | $ | ( | |||||||||||
| Commercial mortgage and other loans | ( | ( | ( | ||||||||||||||
| LPs/LLCs(2) | ( | ( | |||||||||||||||
| Derivatives | ( | ( | |||||||||||||||
| Short-term investments and cash equivalents | |||||||||||||||||
| Ceded income on modified coinsurance assets(2)(3) | ( | ( | |||||||||||||||
| Other(2) | ( | ( | |||||||||||||||
| Realized investment gains (losses), net | $ | ( | $ | $ | ( | ||||||||||||
(1)Includes fixed maturity securities classified as available-for-sale and excludes fixed maturity securities classified as trading.
(2)Prior period amounts have been updated to conform to current period presentation.
(3)Includes changes in the value of reinsurance and funds withheld payables, primarily reflecting the impact of net investment income on withheld assets that are ceded to certain reinsurance counterparties.
38
PRUCO LIFE INSURANCE COMPANY
Notes to Consolidated Financial Statements—(Continued)
Net Unrealized Gains (Losses) on Investments within AOCI
The following table sets forth net unrealized gains (losses) on investments, as of the dates indicated:
| December 31, | |||||||||||||||||
| 2025 | 2024 | 2023 | |||||||||||||||
| (in thousands) | |||||||||||||||||
| Fixed maturity securities, available-for-sale with an allowance | $ | ( | $ | $ | |||||||||||||
| Fixed maturity securities, available-for-sale without an allowance | ( | ( | ( | ||||||||||||||
| Derivatives designated as cash flow hedges(1) | ( | ||||||||||||||||
| Affiliated notes | ( | ( | ( | ||||||||||||||
| Other investments(2) | ( | ||||||||||||||||
| Net unrealized gains (losses) on investments | $ | ( | $ | ( | $ | ( | |||||||||||
(1)For additional information regarding cash flow hedges, see Note 5.
(2)Includes net unrealized gains (losses) on certain joint ventures that are strategic in nature and are included in "Other assets".
Repurchase Agreements and Securities Lending
In the normal course of business, the Company sells securities under agreements to repurchase and enters into securities lending transactions. As of both December 31, 2025 and 2024, the Company had no
The following table sets forth the composition of “Cash collateral for loaned securities,” which represents the liability to return cash collateral received for the following types of securities loaned, as of the dates indicated:
| December 31, 2025 | December 31, 2024 | ||||||||||||||||||||||||||||||||||
| Remaining Contractual Maturities of the Agreements | Remaining Contractual Maturities of the Agreements | ||||||||||||||||||||||||||||||||||
| Overnight & Continuous | Up to 30 Days | Total | Overnight & Continuous | Up to 30 Days | Total | ||||||||||||||||||||||||||||||
| (in thousands) | |||||||||||||||||||||||||||||||||||
| Obligations of U.S. states and their political subdivisions | $ | $ | $ | $ | $ | $ | |||||||||||||||||||||||||||||
| U.S. public corporate securities | |||||||||||||||||||||||||||||||||||
| U.S. private corporate securities | |||||||||||||||||||||||||||||||||||
| Foreign public corporate securities | |||||||||||||||||||||||||||||||||||
| Equity securities | |||||||||||||||||||||||||||||||||||
| Total cash collateral for loaned securities(1) | $ | $ | $ | $ | $ | $ | |||||||||||||||||||||||||||||
(1)The Company did no
39
PRUCO LIFE INSURANCE COMPANY
Notes to Consolidated Financial Statements—(Continued)
Securities Pledged, Restricted Assets and Special Deposits
The Company pledges as collateral investment securities it owns through certain transactions, including securities lending, securities sold under agreements to repurchase, collateralized borrowings and postings of collateral with derivative counterparties. The following table sets forth the carrying value of investments pledged to third-parties and the carrying amount of the associated liabilities supported by the pledged collateral, as of the dates indicated:
| December 31, | ||||||||||||||
| 2025 | 2024 | |||||||||||||
| (in thousands) | ||||||||||||||
| Securities pledged: | ||||||||||||||
| Fixed maturities, available-for-sale | $ | $ | ||||||||||||
| Fixed maturities, trading | ||||||||||||||
| Equity securities | ||||||||||||||
| Total securities pledged | $ | $ | ||||||||||||
| Liabilities supported by the pledged collateral: | ||||||||||||||
| Cash collateral for loaned securities | $ | $ | ||||||||||||
| Other liabilities | ||||||||||||||
| Total liabilities supported by the pledged collateral | $ | $ | ||||||||||||
In the normal course of its business activities, the Company accepts collateral that can be sold or repledged. The primary sources of this collateral are securities purchased under agreements to resell. As of both December 31, 2025 and 2024, there was $0.0
As of December 31, 2025 and 2024, there were $0.0 million and $3.6 million, respectively, on deposit with governmental authorities or trustees as required by certain insurance laws.
4. VARIABLE INTEREST ENTITIES
In the normal course of its activities, the Company enters into relationships with various special-purpose entities and other entities that are deemed to be VIEs. A VIE is an entity that either (1) has equity investors that lack certain essential characteristics of a controlling financial interest (including the ability to control activities of the entity, the obligation to absorb the entity’s expected losses and the right to receive the entity’s expected residual returns) or (2) lacks sufficient equity to finance its own activities without financial support provided by other entities, which in turn would be expected to absorb at least some of the expected losses of the VIE.
The Company is the primary beneficiary if the Company has (1) the power to direct the activities of the VIE that most significantly impact the economic performance of the entity and (2) the obligation to absorb losses of the entity that could be potentially significant to the VIE or the right to receive benefits from the entity that could be potentially significant. If the Company determines that it is the VIE’s primary beneficiary, it consolidates the VIE.
Consolidated Variable Interest Entities
The Company is the primary beneficiary of certain VIEs in which the Company has invested, as part of its investment activities, but for which it is not the investment manager. The Company’s involvement in the structuring of these investments combined with its economic interest indicates that the Company is the primary beneficiary. The Company has not provided material financial support or other support that was not contractually required to these VIEs.
40
PRUCO LIFE INSURANCE COMPANY
Notes to Consolidated Financial Statements—(Continued)
The table below reflects the carrying amount and balance sheet caption in which the assets and liabilities of consolidated VIEs are reported:
| December 31, 2025 | December 31, 2024 | ||||||||||
| (in thousands) | |||||||||||
| Fixed maturities, available-for-sale, at fair value | $ | $ | |||||||||
| Other invested assets | |||||||||||
| Accrued investment income | |||||||||||
| Cash and cash equivalents | |||||||||||
| Income tax assets | |||||||||||
| Other assets | |||||||||||
| Total assets of consolidated variable interest entities | $ | $ | |||||||||
| Payables to parent and affiliates | $ | $ | |||||||||
| Other liabilities | |||||||||||
| Total liabilities of consolidated variable interest entities | $ | $ | |||||||||
Unconsolidated Variable Interest Entities
The Company has determined that it is not the primary beneficiary of certain VIEs. These VIEs consist of investment funds for which the Company has determined that it is not the primary beneficiary as it does not have both (1) the power to direct the activities of the VIE that most significantly impact the economic performance of the entity and (2) the obligation to absorb losses of the entity that could be potentially significant to the VIE or the right to receive benefits from the entity that could be potentially significant. The Company’s maximum exposure to loss resulting from its relationship with unconsolidated VIEs is limited to its investment in the VIEs, which was $80 million and $0 million as of December 31, 2025 and 2024, respectively. These investments are reflected in “Other invested assets”. There are no liabilities associated with these unconsolidated VIEs on the Company’s Consolidated Statements of Financial Position.
5. DERIVATIVES AND HEDGING
Types of Derivative Instruments and Derivative Strategies
Interest Rate Contracts
Interest rate swaps, interest rate total return swaps, options, and futures are used by the Company to reduce risks from changes in interest rates, manage interest rate exposures arising from mismatches between assets and liabilities and to hedge against changes in the values it owns or anticipates acquiring or selling.
Swaps may be attributed to specific assets or liabilities or to a portfolio of assets or liabilities. Under interest rate swaps, the Company agrees with counterparties to exchange, at specified intervals, the difference between fixed-rate and floating-rate interest amounts calculated by reference to an agreed upon notional principal amount. Under interest rate total return swaps, the company agrees with counterparties to exchange, at specified intervals, the difference between the return on a fixed income market index and Secured Overnight Financing Rate (“SOFR”) plus an associated funding spread based on a notional amount.
The Company also uses interest rate swaptions, caps and floors to manage interest rate risk. A swaption is an option to enter into a swap with a forward starting effective date. The Company pays a premium for purchased swaptions and receives a premium for written swaptions. In an interest rate cap, the buyer receives payments at the end of each period in which the interest rate exceeds the agreed strike price. Similarly, in an interest rate floor, the buyer receives payments at the end of each period in which the interest rate is below the agreed strike price. Swaptions, caps and floors are included in interest rate options.
In standardized exchange-traded interest rate futures transactions, the Company purchases or sells a specified number of contracts, the values of which are determined by the daily market values of underlying referenced investments. The Company enters into exchange-traded futures with regulated futures commission's merchants who are members of a trading exchange.
Equity Contracts
Equity options, equity total return swaps, and futures are used by the Company to manage its exposure to the equity markets which impacts the value of assets and liabilities it owns or anticipates acquiring or selling.
41
PRUCO LIFE INSURANCE COMPANY
Notes to Consolidated Financial Statements—(Continued)
Equity index options are contracts which will settle in cash based on differentials in the underlying indices at the time of exercise and the strike price. The Company uses combinations of purchases and sales of equity index options to hedge the effects of adverse changes in equity indices within a predetermined range.
Equity total return swaps are contracts whereby the Company agrees with counterparties to exchange, at specified intervals, the difference between the return on an asset (or market index) and SOFR plus an associated funding spread based on a notional amount. The Company generally uses total return swaps to hedge the effect of adverse changes in equity indices.
In standardized exchange-traded equity futures transactions, the Company purchases or sells a specified number of contracts, the values of which are determined by the daily market values of underlying referenced equity indices. The Company enters into exchange-traded futures with regulated futures commission's merchants who are members of a trading exchange.
Foreign Exchange Contracts
Currency derivatives, including currency swaps and forwards, are used by the Company to reduce risks from changes in currency exchange rates with respect to investments denominated in foreign currencies that the Company either holds or intends to acquire or sell.
Under currency forwards, the Company agrees with counterparties to deliver a specified amount of an identified currency at a specified future date. Typically, the price is agreed upon at the time of the contract and payment for such a contract is made at the specified future date. The Company executes forward sales of the hedged currency in exchange for U.S. dollars at a specified exchange rate. The maturities of these forwards correspond with the future periods in which the non-U.S. dollar-denominated earnings are expected to be generated.
Under currency swaps, the Company agrees with counterparties to exchange, at specified intervals, the difference between one currency and another at an exchange rate and calculated by reference to an agreed principal amount. Generally, the principal amount of each currency is exchanged at the beginning and termination of the currency swap by each party.
Credit Contracts
The Company writes credit protection to gain exposure similar to investment in public fixed maturity cash instruments. With these credit derivatives the Company sells credit protection on a single name reference, or certain index reference, and in return receives a quarterly premium. This premium or credit spread generally corresponds to the difference between the yield on the referenced name (or an index’s referenced names) public fixed maturity cash instruments and swap rates, at the time the agreement is executed. If there is an event of default by the referenced name or one of the referenced names in the index, as defined by the agreement, then the Company is obligated to pay the referenced amount of the contract to the counterparty and receive in return the referenced defaulted security or similar security or (in the case of a credit default index) pay the referenced amount less the auction recovery rate.
In addition to selling credit protection, the Company purchases credit protection using credit derivatives in order to hedge specific credit exposures in the Company’s investment portfolio.
Embedded Derivatives
The Company offers certain products (for example, indexed annuities and index-linked universal life) which may include features that are accounted for as embedded derivatives; related to certain of these derivatives, the Company has entered into reinsurance agreements with both affiliated and unaffiliated parties. See Note 12 for additional information on the reinsurance agreements.
These embedded derivatives and reinsurance agreements, also accounted for as derivatives, are carried at fair value and marked to market through “Realized investment gains (losses), net” based on the change in value of the underlying contractual guarantees, which are determined using valuation models, as described in Note 6.
42
PRUCO LIFE INSURANCE COMPANY
Notes to Consolidated Financial Statements—(Continued)
Synthetic Guarantees
The Company sells synthetic guarantees in the form of stable value wrap guarantees on third-party banked owned life insurance contracts. The synthetic guarantees are issued in respect of assets that are owned by the third-party insurer, who invest the assets according to the contract terms agreed to with the Company. The contracts establish policyholder balances and credit interest thereon. The policyholder balances are supported by the underlying assets. In connection with certain policyholder-initiated withdrawals, the contract guarantees that after all underlying assets are liquidated, any remaining policyholder balances will be paid by the Company. These guarantees are accounted for as derivatives and recorded at fair value.
Primary Risks Managed by Derivatives
The table below provides a summary of the gross notional amount and fair value of derivative contracts by the primary underlying risks, excluding embedded derivatives and associated reinsurance recoverables and deposit receivables. Many derivative instruments contain multiple underlying risks. The fair value amounts below represent the value of derivative contracts prior to taking into account the netting effects of master netting agreements and cash collateral.
| December 31, 2025 | December 31, 2024 | |||||||||||||||||||||||||||||||||||||
| Primary Underlying Risk/Instrument Type | Fair Value | Fair Value | ||||||||||||||||||||||||||||||||||||
| Gross Notional | Assets | Liabilities | Gross Notional | Assets | Liabilities | |||||||||||||||||||||||||||||||||
| (in thousands) | ||||||||||||||||||||||||||||||||||||||
| Derivatives Designated as Hedge Accounting Instruments: | ||||||||||||||||||||||||||||||||||||||
| Currency/Interest Rate | ||||||||||||||||||||||||||||||||||||||
| Interest Rate Swaps | $ | $ | $ | ( | $ | $ | $ | ( | ||||||||||||||||||||||||||||||
| Foreign Currency Swaps | ( | ( | ||||||||||||||||||||||||||||||||||||
| Total Derivatives Designated as Hedge Accounting Instruments | $ | $ | $ | ( | $ | $ | $ | ( | ||||||||||||||||||||||||||||||
| Derivatives Not Qualifying as Hedge Accounting Instruments: | ||||||||||||||||||||||||||||||||||||||
| Interest Rate | ||||||||||||||||||||||||||||||||||||||
| Interest Rate Swaps | $ | $ | $ | ( | $ | $ | $ | ( | ||||||||||||||||||||||||||||||
| Interest Rate Futures | ( | ( | ||||||||||||||||||||||||||||||||||||
| Interest Rate Options | ( | ( | ||||||||||||||||||||||||||||||||||||
| Interest Rate Forwards | ||||||||||||||||||||||||||||||||||||||
Interest Rate Total Return Swaps | ( | ( | ||||||||||||||||||||||||||||||||||||
| Foreign Currency | ||||||||||||||||||||||||||||||||||||||
| Foreign Currency Forwards | ( | ( | ||||||||||||||||||||||||||||||||||||
| Credit | ||||||||||||||||||||||||||||||||||||||
| Credit Default Swaps | ||||||||||||||||||||||||||||||||||||||
| Currency/Interest Rate | ||||||||||||||||||||||||||||||||||||||
| Foreign Currency Swaps | ( | ( | ||||||||||||||||||||||||||||||||||||
| Equity | ||||||||||||||||||||||||||||||||||||||
Equity Total Return Swaps | ( | ( | ||||||||||||||||||||||||||||||||||||
| Equity Options | ( | ( | ||||||||||||||||||||||||||||||||||||
| Equity Futures | ( | ( | ||||||||||||||||||||||||||||||||||||
| Synthetic GICs | ( | |||||||||||||||||||||||||||||||||||||
| Total Derivatives Not Qualifying as Hedge Accounting Instruments | $ | $ | $ | ( | $ | $ | $ | ( | ||||||||||||||||||||||||||||||
| Total Derivatives(1)(2) | $ | $ | $ | ( | $ | $ | $ | ( | ||||||||||||||||||||||||||||||
(1)Excludes embedded derivatives which contain multiple underlying risks. The fair value of these embedded derivatives was a net liability of $17,801 million and $11,968 million as of December 31, 2025 and 2024, respectively, primarily included in "Policyholders' account balances".
(2)Recorded in “Other invested assets”, “Payables to parent and affiliates” and "Other liabilities" on the Consolidated Statements of Financial Position.
43
PRUCO LIFE INSURANCE COMPANY
Notes to Consolidated Financial Statements—(Continued)
Offsetting Assets and Liabilities
The following table presents recognized derivative instruments (excluding embedded derivatives and associated reinsurance recoverables and deposit receivables), and repurchase and reverse repurchase agreements that are offset in the Consolidated Statements of Financial Position, and/or are subject to an enforceable master netting arrangement or similar agreement, irrespective of whether they are offset in the Consolidated Statements of Financial Position.
| December 31, 2025 | ||||||||||||||||||||||||||||||||
| Gross Amounts of Recognized Financial Instruments | Gross Amounts Offset in the Consolidated Statements of Financial Position | Net Amounts Presented in the Consolidated Statements of Financial Position | Financial Instruments/ Collateral(1) | Net Amount | ||||||||||||||||||||||||||||
| (in thousands) | ||||||||||||||||||||||||||||||||
| Offsetting of Financial Assets: | ||||||||||||||||||||||||||||||||
| Derivatives | $ | $ | ( | $ | $ | $ | ||||||||||||||||||||||||||
| Total Assets | $ | $ | ( | $ | $ | $ | ||||||||||||||||||||||||||
| Offsetting of Financial Liabilities: | ||||||||||||||||||||||||||||||||
| Derivatives | $ | $ | ( | $ | $ | ( | $ | |||||||||||||||||||||||||
| Total Liabilities | $ | $ | ( | $ | $ | ( | $ | |||||||||||||||||||||||||
| December 31, 2024 | ||||||||||||||||||||||||||||||||
| Gross Amounts of Recognized Financial Instruments | Gross Amounts Offset in the Consolidated Statements of Financial Position | Net Amounts Presented in the Consolidated Statements of Financial Position | Financial Instruments/ Collateral(1) | Net Amount | ||||||||||||||||||||||||||||
| (in thousands) | ||||||||||||||||||||||||||||||||
| Offsetting of Financial Assets: | ||||||||||||||||||||||||||||||||
| Derivatives | $ | $ | ( | $ | $ | $ | ||||||||||||||||||||||||||
| Total Assets | $ | $ | ( | $ | $ | $ | ||||||||||||||||||||||||||
| Offsetting of Financial Liabilities: | ||||||||||||||||||||||||||||||||
| Derivatives | $ | $ | ( | $ | $ | ( | $ | |||||||||||||||||||||||||
| Total Liabilities | $ | $ | ( | $ | $ | ( | $ | |||||||||||||||||||||||||
(1)Amounts exclude the excess of collateral received/pledged from/to the counterparty.
For information regarding the rights of offset associated with the derivative assets and liabilities in the table above see “Credit Risk” below and Note 16. For securities purchased under agreements to resell and securities sold under agreements to repurchase, the Company monitors the value of the securities and maintains collateral, as appropriate, to protect against credit exposure. Where the Company has entered into repurchase and resale agreements with the same counterparty, in the event of default, the Company would generally be permitted to exercise rights of offset. For additional information on the Company’s accounting policy for securities repurchase and resale agreements, see Note 2 to the Consolidated Financial Statements.
44
PRUCO LIFE INSURANCE COMPANY
Notes to Consolidated Financial Statements—(Continued)
Cash Flow Hedges
The primary derivative instruments used by the Company in its cash flow hedge accounting relationships are currency swaps and interest rate swaps. These instruments are only designated for hedge accounting in instances where the appropriate criteria are met. The Company does not use futures, options, credit, or equity derivatives in any of its cash flow hedge accounting relationships.
The following tables provide the financial statement classification and impact of derivatives used in qualifying and non-qualifying hedge relationships, excluding the offset of the hedged item in an effective hedge relationship.
| Year Ended December 31, 2025 | ||||||||||||||||||||||||||||||||
| (in thousands) | ||||||||||||||||||||||||||||||||
| Derivatives Designated as Hedge Accounting Instruments: | ||||||||||||||||||||||||||||||||
| Cash flow hedges | ||||||||||||||||||||||||||||||||
| Interest Rate | $ | $ | $ | ( | $ | $ | ||||||||||||||||||||||||||
| Currency/Interest Rate | ( | ( | ||||||||||||||||||||||||||||||
| Total cash flow hedges | ( | ( | ||||||||||||||||||||||||||||||
| Derivatives Not Qualifying as Hedge Accounting Instruments: | ||||||||||||||||||||||||||||||||
| Interest Rate | ( | |||||||||||||||||||||||||||||||
| Currency | ( | |||||||||||||||||||||||||||||||
| Currency/Interest Rate | ( | ( | ||||||||||||||||||||||||||||||
| Credit | ||||||||||||||||||||||||||||||||
| Equity | ( | |||||||||||||||||||||||||||||||
| Embedded Derivatives | ( | |||||||||||||||||||||||||||||||
| Total Derivatives Not Qualifying as Hedge Accounting Instruments | ( | ( | ( | |||||||||||||||||||||||||||||
| Total | $ | ( | $ | ( | $ | $ | ( | $ | ( | |||||||||||||||||||||||
45
PRUCO LIFE INSURANCE COMPANY
Notes to Consolidated Financial Statements—(Continued)
| Year Ended December 31, 2024 | ||||||||||||||||||||||||||||||||
| (in thousands) | ||||||||||||||||||||||||||||||||
| Derivatives Designated as Hedge Accounting Instruments: | ||||||||||||||||||||||||||||||||
| Cash flow hedges | ||||||||||||||||||||||||||||||||
| Interest Rate | $ | $ | $ | ( | $ | $ | ||||||||||||||||||||||||||
| Currency/Interest Rate | ||||||||||||||||||||||||||||||||
| Total cash flow hedges | ||||||||||||||||||||||||||||||||
| Derivatives Not Qualifying as Hedge Accounting Instruments: | ||||||||||||||||||||||||||||||||
| Interest Rate | ( | |||||||||||||||||||||||||||||||
| Currency | ||||||||||||||||||||||||||||||||
| Currency/Interest Rate | ||||||||||||||||||||||||||||||||
| Credit | ||||||||||||||||||||||||||||||||
| Equity | ( | |||||||||||||||||||||||||||||||
| Embedded Derivatives | ( | |||||||||||||||||||||||||||||||
| Total Derivatives Not Qualifying as Hedge Accounting Instruments | ( | |||||||||||||||||||||||||||||||
| Total | $ | $ | ( | $ | $ | $ | ||||||||||||||||||||||||||
| Year Ended December 31, 2023 | ||||||||||||||||||||||||||||||||
| (in thousands) | ||||||||||||||||||||||||||||||||
| Derivatives Designated as Hedge Accounting Instruments: | ||||||||||||||||||||||||||||||||
| Cash flow hedges | ||||||||||||||||||||||||||||||||
| Interest Rate | $ | $ | $ | ( | $ | $ | ||||||||||||||||||||||||||
| Currency/Interest Rate | ( | ( | ( | |||||||||||||||||||||||||||||
| Total cash flow hedges | ( | ( | ( | |||||||||||||||||||||||||||||
| Derivatives Not Qualifying as Hedge Accounting Instruments: | ||||||||||||||||||||||||||||||||
| Interest Rate | ( | |||||||||||||||||||||||||||||||
| Currency | ( | |||||||||||||||||||||||||||||||
| Currency/Interest Rate | ( | ( | ||||||||||||||||||||||||||||||
| Credit | ||||||||||||||||||||||||||||||||
| Equity | ( | |||||||||||||||||||||||||||||||
| Embedded Derivatives | ( | |||||||||||||||||||||||||||||||
| Total Derivatives Not Qualifying as Hedge Accounting Instruments | ( | ( | ( | |||||||||||||||||||||||||||||
| Total | $ | ( | $ | ( | $ | $ | ( | $ | ( | |||||||||||||||||||||||
46
PRUCO LIFE INSURANCE COMPANY
Notes to Consolidated Financial Statements—(Continued)
Presented below is a rollforward of current period cash flow hedges in AOCI before taxes:
| (in thousands) | |||||
| Balance, December 31, 2022 | $ | ||||
| Amount recorded in AOCI | |||||
| Interest Rate | ( | ||||
| Currency/Interest Rate | ( | ||||
| Total amount recorded in AOCI | ( | ||||
| Amount reclassified from AOCI to income | |||||
| Interest Rate | |||||
| Currency/Interest Rate | ( | ||||
| Total amount reclassified from AOCI to income | ( | ||||
| Balance, December 31, 2023 | $ | ||||
| Amount recorded in AOCI | |||||
| Interest Rate | ( | ||||
| Currency/Interest Rate | |||||
| Total amount recorded in AOCI | |||||
| Amount reclassified from AOCI to income | |||||
| Interest Rate | |||||
| Currency/Interest Rate | ( | ||||
| Total amount reclassified from AOCI to income | ( | ||||
| Balance, December 31, 2024 | $ | ||||
| Amount recorded in AOCI | |||||
| Interest Rate | |||||
| Currency/Interest Rate | ( | ||||
| Total amount recorded in AOCI | ( | ||||
| Amount reclassified from AOCI to income | |||||
| Interest Rate | |||||
| Currency/Interest Rate | |||||
| Total amount reclassified from AOCI to income | |||||
| Balance, December 31, 2025 | $ | ( | |||
The changes in fair value of cash flow hedges are deferred in AOCI and are included in "Net unrealized investment gains (losses)" in the Consolidated Statements of Operations and Comprehensive Income (Loss); these amounts are then reclassified to earnings when the hedged item affects earnings. Using December 31, 2025 values, it is estimated that a pre-tax gain of $38 million is expected to be reclassified from AOCI to earnings during the subsequent twelve months ending December 31, 2026.
The exposures the Company is hedging with these qualifying cash flow hedges include the variability of the payment or receipt of interest or foreign currency amounts on existing financial instruments.
There were no material amounts reclassified from AOCI into earnings relating to instances in which the Company discontinued cash flow hedge accounting because the forecasted transaction did not occur by the anticipated date or within the additional time period permitted by the authoritative guidance for the accounting for derivatives and hedging.
47
PRUCO LIFE INSURANCE COMPANY
Notes to Consolidated Financial Statements—(Continued)
Credit Derivatives
Credit derivatives, where the Company has written credit protection on certain index references, have outstanding notional amounts of $875 million and $912 million as of December 31, 2025 and 2024, respectively. These credit derivatives are reported at fair value as an asset of $10 million and $10 million as of December 31, 2025 and 2024, respectively. As of December 31, 2025 the notional amount of these credit derivatives had the following NAIC ratings: $845 million in NAIC 3 and $30 million in NAIC 6.
The Company has no
Counterparty Credit Risk
The Company is exposed to credit-related losses in the event of non-performance by counterparties to financial derivative transactions with a positive fair value. The Company manages credit risk by entering into derivative transactions with regulated derivatives exchanges for exchange traded derivatives and its affiliate, Prudential Global Funding LLC (“PGF”), related to its OTC derivatives. PGF, in turn, manages its credit risk by: (i) entering into derivative transactions with highly rated major international financial institutions and other creditworthy counterparties governed by master netting agreements, as applicable; (ii) trading through central clearing and OTC parties; (iii) obtaining collateral, such as cash and securities, when appropriate; and (iv) setting limits on single party credit exposures which are subject to periodic management review.
6. FAIR VALUE OF ASSETS AND LIABILITIES
Fair Value Measurement - Fair value represents the price that would be received to sell an asset or paid to transfer a liability in an orderly transaction between market participants at the measurement date. The authoritative fair value guidance establishes a framework for measuring fair value that includes a hierarchy used to classify the inputs used in measuring fair value. The level in the fair value hierarchy within which the fair value measurement falls is determined based on the lowest level input that is significant to the fair value measurement. The levels of the fair value hierarchy are as follows:
Level 1 - Fair value is based on unadjusted quoted prices in active markets that are accessible to the Company for identical assets or liabilities. The Company’s Level 1 assets and liabilities primarily include certain cash equivalents and short-term investments, equity securities, and derivative contracts that trade on an active exchange market included in other invested assets and other liabilities.
Level 2 - Fair value is based on significant inputs, other than quoted prices included in Level 1, that are observable for the asset or liability, either directly or indirectly, for substantially the full term of the asset or liability through corroboration with observable market data. Level 2 inputs include quoted prices in active markets for similar assets and liabilities, quoted prices in markets that are not active for identical or similar assets or liabilities, and other market observable inputs. The Company’s Level 2 assets and liabilities include: fixed maturities (corporate public and private bonds, most government securities, certain asset-backed and mortgage-backed securities, etc.), certain equity securities (mutual funds, which do not trade in active markets because they are not publicly available), certain cash equivalents (primarily commercial paper), short-term investments, certain OTC derivatives, separate account assets, receivables from parent and affiliates, other liabilities and embedded derivatives associated with certain reinsurance arrangements.
Level 3 - Fair value is based on at least one significant unobservable input for the asset or liability. The assets and liabilities in this category may require significant judgment or estimation in determining the fair value. The Company’s Level 3 assets and liabilities primarily include: certain private fixed maturities and equity securities, certain manually priced public equity securities and fixed maturities, certain highly structured OTC derivative contracts, contracts or contract features pertaining to living benefit features (market risk benefits) of the Company's variable annuity contracts, embedded derivatives associated with the index-linked features of certain universal life and annuity products, receivables from parent and affiliates, short-term investments, cash equivalents and other liabilities.
48
PRUCO LIFE INSURANCE COMPANY
Notes to Consolidated Financial Statements—(Continued)
Assets and Liabilities by Hierarchy Level – The tables below present the balances of assets and liabilities reported at fair value on a recurring basis, as of the dates indicated.
| December 31, 2025 | ||||||||||||||||||||||||||||||||
| Level 1 | Level 2 | Level 3 | Netting(1) | Total | ||||||||||||||||||||||||||||
| (in thousands) | ||||||||||||||||||||||||||||||||
| Fixed maturities, available-for-sale: | ||||||||||||||||||||||||||||||||
| U.S. Treasury securities and obligations of U.S. government authorities and agencies | $ | $ | $ | $ | $ | |||||||||||||||||||||||||||
| Obligations of U.S. states and their political subdivisions | ||||||||||||||||||||||||||||||||
| Foreign government securities | ||||||||||||||||||||||||||||||||
| U.S. corporate public securities | ||||||||||||||||||||||||||||||||
| U.S. corporate private securities | ||||||||||||||||||||||||||||||||
| Foreign corporate public securities | ||||||||||||||||||||||||||||||||
| Foreign corporate private securities | ||||||||||||||||||||||||||||||||
| Asset-backed securities(2) | ||||||||||||||||||||||||||||||||
| Commercial mortgage-backed securities | ||||||||||||||||||||||||||||||||
| Residential mortgage-backed securities | ||||||||||||||||||||||||||||||||
| Subtotal | ||||||||||||||||||||||||||||||||
| Market risk benefit assets | ||||||||||||||||||||||||||||||||
| Fixed maturities, trading | ||||||||||||||||||||||||||||||||
| Equity securities | ||||||||||||||||||||||||||||||||
| Short-term investments | ||||||||||||||||||||||||||||||||
| Cash equivalents | ||||||||||||||||||||||||||||||||
| Other invested assets(3) | ( | |||||||||||||||||||||||||||||||
| Reinsurance recoverables and deposit receivables | ||||||||||||||||||||||||||||||||
| Receivables from parent and affiliates | ||||||||||||||||||||||||||||||||
| Subtotal excluding separate account assets | ( | |||||||||||||||||||||||||||||||
| Separate account assets(4)(5) | ||||||||||||||||||||||||||||||||
| Total assets | $ | $ | $ | $ | ( | $ | ||||||||||||||||||||||||||
| Market risk benefit liabilities | $ | $ | $ | $ | $ | |||||||||||||||||||||||||||
| Policyholders' account balances | ||||||||||||||||||||||||||||||||
| Reinsurance and funds withheld payables | ||||||||||||||||||||||||||||||||
| Payables to parent and affiliates | ( | |||||||||||||||||||||||||||||||
| Other liabilities | ( | |||||||||||||||||||||||||||||||
| Total liabilities | $ | $ | $ | $ | ( | $ | ||||||||||||||||||||||||||
49
PRUCO LIFE INSURANCE COMPANY
Notes to Consolidated Financial Statements—(Continued)
| December 31, 2024 | ||||||||||||||||||||||||||||||||
| Level 1 | Level 2 | Level 3 | Netting(1) | Total | ||||||||||||||||||||||||||||
| (in thousands) | ||||||||||||||||||||||||||||||||
| Fixed maturities, available-for-sale: | ||||||||||||||||||||||||||||||||
| U.S. Treasury securities and obligations of U.S. government authorities and agencies | $ | $ | $ | $ | $ | |||||||||||||||||||||||||||
| Obligations of U.S. states and their political subdivisions | ||||||||||||||||||||||||||||||||
| Foreign government securities | ||||||||||||||||||||||||||||||||
| U.S. corporate public securities | ||||||||||||||||||||||||||||||||
| U.S. corporate private securities | ||||||||||||||||||||||||||||||||
| Foreign corporate public securities | ||||||||||||||||||||||||||||||||
| Foreign corporate private securities | ||||||||||||||||||||||||||||||||
| Asset-backed securities(2) | ||||||||||||||||||||||||||||||||
| Commercial mortgage-backed securities | ||||||||||||||||||||||||||||||||
| Residential mortgage-backed securities | ||||||||||||||||||||||||||||||||
| Subtotal | ||||||||||||||||||||||||||||||||
| Market risk benefit assets | ||||||||||||||||||||||||||||||||
| Fixed maturities, trading | ||||||||||||||||||||||||||||||||
| Equity securities | ||||||||||||||||||||||||||||||||
| Short-term investments | ||||||||||||||||||||||||||||||||
| Cash equivalents | ||||||||||||||||||||||||||||||||
| Other invested assets(3) | ( | |||||||||||||||||||||||||||||||
| Reinsurance recoverables and deposit receivables | ||||||||||||||||||||||||||||||||
| Receivables from parent and affiliates | ||||||||||||||||||||||||||||||||
| Subtotal excluding separate account assets | ( | |||||||||||||||||||||||||||||||
| Separate account assets(4)(5) | ||||||||||||||||||||||||||||||||
| Total assets | $ | $ | $ | $ | ( | $ | ||||||||||||||||||||||||||
| Market risk benefit liabilities | $ | $ | $ | $ | $ | |||||||||||||||||||||||||||
| Policyholders' account balances | ||||||||||||||||||||||||||||||||
| Payables to parent and affiliates | ( | |||||||||||||||||||||||||||||||
| Other liabilities | ( | |||||||||||||||||||||||||||||||
| Total liabilities | $ | $ | $ | $ | ( | $ | ||||||||||||||||||||||||||
(1)"Netting" amounts represent cash collateral of $(9,225 ) million and $(8,311 ) million as of December 31, 2025 and 2024, respectively, and the impact of offsetting asset and liability positions held with the same counterparty, subject to master netting agreements.
(2)Includes credit-tranched securities collateralized by loan obligations, home equity loans, auto loans and education loans.
(3)Other invested assets excluded from the fair value hierarchy include certain hedge funds, private equity funds and other funds for which fair value is measured at net asset value ("NAV") per share (or its equivalent) as a practical expedient. At December 31, 2025 and 2024, the fair value of such investments was $87 million and $44 million, respectively.
(4)Separate account assets represent segregated funds that are invested for certain customers. Investment risks associated with market value changes are borne by the customers, except to the extent of minimum guarantees made by the Company with respect to certain accounts. Separate account liabilities are not included in the above table as they are reported at contract value and not fair value in the Company's Consolidated Statements of Financial Position.
(5)Separate account assets included in the fair value hierarchy exclude investments in entities that calculate NAV per share (or its equivalent) as a practical expedient. Such investments excluded from the fair value hierarchy include investments in real estate, hedge funds and a corporate-owned life insurance fund. At December 31, 2025 and 2024, the fair value of such investments was $7,914 million and $6,444 million, respectively.
50
PRUCO LIFE INSURANCE COMPANY
Notes to Consolidated Financial Statements—(Continued)
The methods and assumptions the Company uses to estimate the fair value of assets and liabilities measured at fair value on a recurring basis are summarized below.
Fixed Maturity Securities – The fair values of the Company’s public fixed maturity securities are generally based on prices obtained from independent pricing services. Prices for each security are generally sourced from multiple pricing vendors, and a vendor hierarchy is maintained by asset type based on historical pricing experience and vendor expertise. The Company ultimately uses the price from the pricing service highest in the vendor hierarchy based on the respective asset type. The pricing hierarchy is updated for new financial products and recent pricing experience with various vendors. Consistent with the fair value hierarchy described above, securities with validated quotes from pricing services are generally reflected within Level 2, as they are primarily based on observable pricing for similar assets and/or other market observable inputs. Typical inputs used by these pricing services include but are not limited to, reported trades, benchmark yields, issuer spreads, bids, offers, and/or estimated cash flow, prepayment speeds, and default rates. If the pricing information received from third-party pricing services is deemed not reflective of market activity or other inputs observable in the market, the Company may challenge the price through a formal process with the pricing service or classify the securities as Level 3. If the pricing service updates the price to be more consistent with the presented market observations, the security remains within Level 2.
Internally-developed valuations or indicative broker quotes are also used to determine fair value in circumstances where vendor pricing is not available, or where the Company ultimately concludes that pricing information received from the independent pricing services is not reflective of market activity. If the Company concludes the values from both pricing services and brokers are not reflective of market activity, it may override the information with an internally-developed valuation. As of December 31, 2025 and 2024, overrides on a net basis were not material. Pricing service overrides, internally-developed valuations and indicative broker quotes are generally included in Level 3 in the fair value hierarchy.
The Company conducts several specific price monitoring activities. Daily analyses identify price changes over predetermined thresholds defined at the financial instrument level. Various pricing integrity reports are reviewed on a daily and monthly basis to determine if pricing is reflective of market activity or if it would warrant any adjustments. Other procedures performed include, but are not limited to, reviews of third-party pricing services methodologies, reviews of pricing trends and back testing.
The fair values of private fixed maturities, which are originated by internal private asset managers, are primarily determined using discounted cash flow models. These models primarily use observable inputs that include Treasury or similar base rates plus estimated credit spreads to value each security. The credit spreads are obtained through a survey of private market intermediaries who are active in both primary and secondary transactions, and consider, among other factors, the credit quality and the reduced liquidity associated with private placements. Internal adjustments are made to reflect variation in observed sector spreads. Since most private placements are valued using standard market observable inputs and inputs derived from, or corroborated by, market observable data including, but not limited to observed prices and spreads for similar publicly or privately traded issues, they have been reflected within Level 2. For certain private fixed maturities, the discounted cash flow model may incorporate significant unobservable inputs, which reflect the Company’s own assumptions about the inputs that market participants would use in pricing the asset. To the extent management determines that such unobservable inputs are significant to the price of a security, a Level 3 classification is made.
Equity Securities – Equity securities consist principally of investments in common and preferred stock of publicly traded companies, privately traded securities, as well as mutual fund shares. The fair values of most publicly traded equity securities are based on quoted prices in active markets for identical assets and are classified within Level 1 in the fair value hierarchy. Estimated fair values for most privately traded equity securities are determined using discounted cash flow, earnings multiple and other valuation models that require a substantial level of judgment around inputs and therefore are classified within Level 3. The fair values of mutual fund shares that transact regularly (but do not trade in active markets because they are not publicly available) are based on transaction prices of identical fund shares and are classified within Level 2 in the fair value hierarchy.
Cash Equivalents and Short-Term Investments – Cash equivalents and short-term investments include money market instruments, commercial paper and other highly liquid debt instruments. Certain money market instruments are valued using unadjusted quoted prices in active markets that are accessible for identical assets and are primarily classified as Level 1. The remaining instruments in this category are generally fair valued based on market observable inputs and these investments have primarily been classified within Level 2.
Derivative Instruments – Derivatives are recorded at fair value either as assets within "Other invested assets", or as liabilities within "Payables to parent and affiliates" or "Other liabilities", except for embedded derivatives which are recorded with the associated host contract. The fair values of derivative contracts can be affected by changes in interest rates, foreign exchange rates, credit spreads, market volatility, expected returns, NPR, liquidity and other factors.
51
PRUCO LIFE INSURANCE COMPANY
Notes to Consolidated Financial Statements—(Continued)
The Company's exchange-traded futures and options include treasury and equity futures. Exchange-traded futures and options are valued using quoted prices in active markets and are classified within Level 1 in the fair value hierarchy.
The majority of the Company’s derivative positions are traded in the OTC derivative market and are classified within Level 2 in the fair value hierarchy. OTC derivatives classified within Level 2 are valued using models that utilize actively quoted or observable market inputs from external market data providers, third-party pricing vendors and/or recent trading activity. The Company’s policy is to use mid-market pricing in determining its best estimate of fair value. The fair values of most OTC derivatives, including interest rate and cross-currency swaps, currency forward contracts and credit default swaps are determined using discounted cash flow models. The fair values of European style option contracts are determined using Black-Scholes option pricing models. These models’ key inputs include the contractual terms of the respective contract, along with significant observable inputs, including interest rates, currency rates, credit spreads, equity prices, index dividend yields, NPR, volatility and other factors.
The Company’s cleared interest rate swaps and credit derivatives linked to an index are valued using models that utilize actively quoted or observable market inputs, including SOFR, obtained from external market data providers, third-party pricing vendors and/or recent trading activity. These derivatives are classified as Level 2 in the fair value hierarchy.
Reinsurance Recoverables and Deposit Receivables – Reinsurance recoverables and deposit receivables primarily include (1) an embedded derivative associated with net receivables from modified coinsurance arrangements where the Company is the cedant; and (2) an embedded derivatives on deposit receivables where the Company has ceded fixed indexed annuities. The methods and assumptions used to estimate the fair value are consistent with those described below in "Policyholders' account balances".
Receivables from Parent and Affiliates – Receivables from parent and affiliates carried at fair value include affiliated bonds within the Company’s legal entity where fair value is determined consistent with similar securities described above under "Fixed Maturity Securities" managed by affiliated asset managers.
Separate Account Assets – Separate account assets include fixed maturity securities, treasuries, equity securities, real estate, mutual funds and commercial mortgage loans for which values are determined consistent with similar instruments described above under "Fixed Maturity Securities" and "Equity Securities".
Market Risk Benefits – Market risk benefit liabilities (or assets) represent contracts or contract features that provide protection to the contractholder and expose the insurance entity to other than nominal capital market risk, primarily related to deferred annuities with guaranteed minimum benefits in the annuities products including GMDB, GMIB, GMAB, GMWB and GMIWB. The benefits are bundled together and accounted for as single compound market risk benefits using a fair value measurement framework.
The fair value of these market risk benefits is calculated as the present value of expected future benefit payments to contractholders less the present value of expected future rider fees attributable to the market risk benefits. The fair value of these benefit features is based on assumptions a market participant would use in valuing market risk benefits. This methodology could result in either a liability or asset balance, given changing capital market conditions and various actuarial assumptions. Since there is no observable active market for the transfer of these obligations, the valuations are calculated using internally-developed models with option pricing techniques. The models are based on a risk neutral valuation framework and incorporate premiums for risks inherent in valuation techniques, inputs, and the general uncertainty around the timing and amount of future cash flows. The determination of these risk premiums requires the use of management’s judgment.
The significant inputs to the valuation models for these market risk benefits include capital market assumptions, such as interest rate levels and volatility assumptions, the Company’s market-perceived NPR, as well as actuarially determined assumptions, including contractholder behavior, such as lapse rates, benefit utilization rates, withdrawal rates, and mortality rates. Since many of these assumptions are unobservable and are considered to be significant inputs to the valuations, the assets and liabilities included in market risk benefits have been reflected within Level 3 in the fair value hierarchy.
Capital market inputs and actual policyholders’ account values are updated each quarter based on capital market conditions as of the end of the quarter, including interest rates, equity markets and volatility. In the risk neutral valuation, the initial swap curve drives the total return used to grow the policyholders’ account values. The Company’s discount rate assumption is based on the SOFR swap curve adjusted for an additional spread relative to SOFR to reflect the Company’s market-perceived NPR, which is the risk that the obligation will not be fulfilled by the Company. NPR is primarily estimated by utilizing the credit spreads associated with the Company issued funding agreements, adjusted for any illiquidity risk premium. In order to reflect the financial strength ratings of the Company, credit spreads associated with funding agreements, as opposed to credit spread associated with debt, are utilized in developing this estimate because funding agreements, living benefit guarantees, and index-linked interest crediting guarantees are insurance liabilities and are therefore senior to debt.
52
PRUCO LIFE INSURANCE COMPANY
Notes to Consolidated Financial Statements—(Continued)
Actuarial assumptions, including contractholder behavior and mortality, are reviewed at least annually, and updated based upon Company emerging experience and industry studies, future expectations and other data, including any observable market data. These assumptions are generally updated annually unless a material change that the Company feels is indicative of a long-term trend is observed in an interim period.
Policyholders' Account Balances – The liability for policyholders’ account balances is related to certain embedded derivative instruments associated with certain universal life and annuity products that provide policyholders with index-linked interest credited over contract specified term periods. The fair values of these liabilities are determined using discounted cash flow models which include capital market assumptions such as interest rates and equity index volatility assumptions, the Company’s market-perceived NPR and actuarially determined assumptions for mortality, lapses and projected hedge costs.
As there is no observable active market for these liabilities, the fair value is determined as the present value of account balances paid to policyholders in excess of contractually guaranteed minimums using option pricing techniques for index term periods that contain deposits as of the valuation date, and the expected option cost for future index term periods, where the terms of index crediting rates have not yet been declared by the Company. Premiums for risks inherent in valuation techniques, inputs, and the general uncertainty around the timing and amount of future cash flows are also incorporated in the fair value of these liabilities. Since the valuation of these liabilities requires the use of management’s judgment to determine these risk premiums and the use of unobservable inputs, these liabilities are reflected within Level 3 in the fair value hierarchy.
Capital market inputs, including interest rates and equity market volatility, and actual policyholders’ account values are updated each quarter. Actuarial assumptions are reviewed at least annually and updated based upon emerging Company experience, future expectations and other data, including any observable market data. Aside from these annual updates, assumptions are generally updated only if a material change is observed in an interim period that the Company believes is indicative of a long-term trend.
Reinsurance and Funds Withheld Payables – Reinsurance and funds withheld payables primarily includes an embedded derivative associated with certain funds withheld reinsurance arrangements that are described in Note 12. The fair value is determined based on the valuation of the underlying funds withheld assets identified to support the payable due to the applicable reinsurance counterparties.
Other Liabilities – Other liabilities include certain derivative instruments. The fair values of derivative instruments are determined consistent with those described above under "Derivative Instruments".
53
PRUCO LIFE INSURANCE COMPANY
Notes to Consolidated Financial Statements—(Continued)
Quantitative Information Regarding Internally-Priced Level 3 Assets and Liabilities - The tables below present quantitative information regarding significant internally-priced Level 3 assets and liabilities.
| December 31, 2025 | |||||||||||||||||||||||||||||||||||||||||
| Fair Value | Valuation Techniques | Unobservable Inputs | Minimum | Maximum | Weighted Average | Impact of Increase in Input on Fair Value(1)(2) | |||||||||||||||||||||||||||||||||||
| (in thousands) | |||||||||||||||||||||||||||||||||||||||||
| Assets: | |||||||||||||||||||||||||||||||||||||||||
| Corporate securities(3) | $ | Discounted cash flow | Discount rate | % | % | % | Decrease | ||||||||||||||||||||||||||||||||||
| Market comparables | EBITDA multiple(4) | Increase | |||||||||||||||||||||||||||||||||||||||
| Liquidation | Liquidation value | % | % | % | Increase | ||||||||||||||||||||||||||||||||||||
| Asset-backed securities | $ | Discounted cash flow | Discount rate | % | % | % | Decrease | ||||||||||||||||||||||||||||||||||
| Commercial mortgage-backed securities | $ | Discounted cash flow | Liquidity premium | % | % | % | Decrease | ||||||||||||||||||||||||||||||||||
| Market risk benefit assets(5) | $ | Discounted cash flow | Lapse rate(6) | % | % | Increase | |||||||||||||||||||||||||||||||||||
| Spread over SOFR(7) | % | % | Increase | ||||||||||||||||||||||||||||||||||||||
| Utilization rate(8) | % | % | Decrease | ||||||||||||||||||||||||||||||||||||||
| Withdrawal rate | See table footnote (9) below. | ||||||||||||||||||||||||||||||||||||||||
| Mortality rate(10) | % | % | Increase | ||||||||||||||||||||||||||||||||||||||
| Equity volatility curve | % | % | Decrease | ||||||||||||||||||||||||||||||||||||||
| Reinsurance recoverables and deposit receivables(11) | $ | Discounted cash flow | Lapse rate(6) | % | % | Decrease | |||||||||||||||||||||||||||||||||||
| Spread over SOFR(7) | % | % | Decrease | ||||||||||||||||||||||||||||||||||||||
| Option budget(13) | ( | % | % | Increase | |||||||||||||||||||||||||||||||||||||
| Receivables from parent and affiliates | $ | Liquidation | Liquidation value | % | % | % | Increase | ||||||||||||||||||||||||||||||||||
| Liabilities: | |||||||||||||||||||||||||||||||||||||||||
| Market risk benefit liabilities(5) | $ | Discounted cash flow | Lapse rate(6) | % | % | Decrease | |||||||||||||||||||||||||||||||||||
| Spread over SOFR(7) | % | % | Decrease | ||||||||||||||||||||||||||||||||||||||
| Utilization rate(8) | % | % | Increase | ||||||||||||||||||||||||||||||||||||||
| Withdrawal rate | See table footnote (9) below. | ||||||||||||||||||||||||||||||||||||||||
| Mortality rate(10) | % | % | Decrease | ||||||||||||||||||||||||||||||||||||||
| Equity volatility curve | % | % | Increase | ||||||||||||||||||||||||||||||||||||||
| Policyholders' account balances(12) | $ | Discounted cash flow | Lapse rate(6) | % | % | Decrease | |||||||||||||||||||||||||||||||||||
| Spread over SOFR(7) | % | % | Decrease | ||||||||||||||||||||||||||||||||||||||
| Mortality rate(10) | % | % | Decrease | ||||||||||||||||||||||||||||||||||||||
| Option budget(13) | ( | % | % | Increase | |||||||||||||||||||||||||||||||||||||
54
PRUCO LIFE INSURANCE COMPANY
Notes to Consolidated Financial Statements—(Continued)
| December 31, 2024 | |||||||||||||||||||||||||||||||||||||||||
| Fair Value | Valuation Techniques | Unobservable Inputs | Minimum | Maximum | Weighted Average | Impact of Increase in Input on Fair Value(1)(2) | |||||||||||||||||||||||||||||||||||
| (in thousands) | |||||||||||||||||||||||||||||||||||||||||
| Assets: | |||||||||||||||||||||||||||||||||||||||||
| Corporate securities(3) | $ | Discounted cash flow | Discount rate | % | % | % | Decrease | ||||||||||||||||||||||||||||||||||
| Market comparables | EBITDA multiple(4) | X | X | X | Increase | ||||||||||||||||||||||||||||||||||||
| Liquidation | Liquidation value | % | % | % | Increase | ||||||||||||||||||||||||||||||||||||
| Asset-backed securities | $ | Discounted cash flow | Discount rate | % | % | % | Decrease | ||||||||||||||||||||||||||||||||||
| Commercial mortgage-backed securities | $ | Discounted cash flow | Liquidity premium | % | % | % | Decrease | ||||||||||||||||||||||||||||||||||
| Market risk benefit assets(5) | $ | Discounted cash flow | Lapse rate(6) | % | % | Increase | |||||||||||||||||||||||||||||||||||
| Spread over SOFR(7) | % | % | Increase | ||||||||||||||||||||||||||||||||||||||
| Utilization rate(8) | % | % | Decrease | ||||||||||||||||||||||||||||||||||||||
| Withdrawal rate | See table footnote (9) below. | ||||||||||||||||||||||||||||||||||||||||
| Mortality rate(10) | % | % | Increase | ||||||||||||||||||||||||||||||||||||||
| Equity volatility curve | % | % | Decrease | ||||||||||||||||||||||||||||||||||||||
| Reinsurance recoverables and deposit receivables(11) | $ | Discounted cash flow | Lapse rate(6) | % | % | Decrease | |||||||||||||||||||||||||||||||||||
| Spread over SOFR(7) | % | % | Decrease | ||||||||||||||||||||||||||||||||||||||
| Option budget(13) | ( | % | % | Increase | |||||||||||||||||||||||||||||||||||||
| Receivables from parent and affiliates | $ | Liquidation | Liquidation value | % | % | % | Increase | ||||||||||||||||||||||||||||||||||
| Liabilities: | |||||||||||||||||||||||||||||||||||||||||
| Market risk benefit liabilities(5) | $ | Discounted cash flow | Lapse rate(6) | % | % | Decrease | |||||||||||||||||||||||||||||||||||
| Spread over SOFR(7) | % | % | Decrease | ||||||||||||||||||||||||||||||||||||||
| Utilization rate(8) | % | % | Increase | ||||||||||||||||||||||||||||||||||||||
| Withdrawal rate | See table footnote (9) below. | ||||||||||||||||||||||||||||||||||||||||
| Mortality rate(10) | % | % | Decrease | ||||||||||||||||||||||||||||||||||||||
| Equity volatility curve | % | % | Increase | ||||||||||||||||||||||||||||||||||||||
| Policyholders' account balances(12) | $ | Discounted cash flow | Lapse rate(6) | % | % | Decrease | |||||||||||||||||||||||||||||||||||
| Spread over SOFR(7) | % | % | Decrease | ||||||||||||||||||||||||||||||||||||||
| Mortality rate(10) | % | % | Decrease | ||||||||||||||||||||||||||||||||||||||
| Option budget(13) | ( | % | % | Increase | |||||||||||||||||||||||||||||||||||||
(1)Conversely, the impact of a decrease in input would have the opposite impact on fair value as that presented in the table.
(2)Directional impacts for MRB assets and liabilities are associated with the directional impacts of direct and assumed MRBs.
(3)Includes assets classified as fixed maturities, available-for-sale and fixed maturities, trading.
(4)Represents multiple of earnings before interest, taxes, depreciation and amortization ("EBITDA"), and are amounts used when the Company has determined that market participants would use such multiples when valuing the investments.
(5)Market risk benefits primarily represent fair value for all living benefit guarantees including accumulation, withdrawal and income benefits. Since the valuation methodology for these assets and liabilities uses a range of inputs that vary at the contract level over the cash flow projection period, presenting a range, rather than a weighted average, is a more meaningful representation of the unobservable inputs used in the valuation.
55
PRUCO LIFE INSURANCE COMPANY
Notes to Consolidated Financial Statements—(Continued)
(6)Lapse rates for contracts with living benefit guarantees are adjusted at the contract level based on the in-the-moneyness of the living benefit and reflect other factors, such as the applicability of any surrender charges. Lapse rates are reduced when contracts are more in-the-money. Lapse rates for contracts with index-linked crediting guarantees may be adjusted at the contract level based on the applicability of any surrender charges, product type, and market related factors such as interest rates. Lapse rates are also generally assumed to be lower for the period where surrender charges apply. For any given contract, lapse rates vary throughout the period over which cash flows are projected for the purposes of valuing these balances.
(7)The spread over the SOFR swap curve represents the premium added to the proxy for the risk-free rate (SOFR) to reflect the Company's estimates of rates that a market participant would use to value the living benefits in both the accumulation and payout phases and index-linked interest crediting guarantees as of December 31, 2025 and 2024, respectively. This spread includes an estimate of NPR, which is the risk that the obligation will not be fulfilled by the Company. NPR is primarily estimated by utilizing the credit spreads associated with issuing funding agreements, adjusted for any illiquidity risk premium. In order to reflect the financial strength ratings of the Company, credit spreads associated with funding agreements, as opposed to credit spread associated with debt, are utilized in developing this estimate because funding agreements are insurance liabilities and are therefore senior to debt. Effective April 2023, the Company entered into an agreement with The Ohio National Life Insurance Company, now known as AuguStar Life Insurance Company ("AuguStar"), an affiliate of Constellation Insurance Holdings, Inc., to reinsure approximately $10 billion of account values of PDI traditional variable annuity contracts with guaranteed living benefits. See Note 12 for additional information regarding this transaction. As a result of this transaction, a ceded MRB asset balance was established to fair value the reinsurance reimbursements to the Company. The establishment of the fair value also required an estimate of NPR for AuguStar, which may differ from the Company's; however, the NPR spreads for AuguStar were developed using a methodology similar to that of the Company.
(8)The utilization rate assumption estimates the percentage of contracts that will utilize the benefit during the contract duration and begin lifetime withdrawals at various time intervals from contract inception. The remaining contractholders are assumed to either begin lifetime withdrawals immediately or never utilize the benefit. Utilization assumptions may vary by product type, tax status and age. The impact of changes in these assumptions is highly dependent on the product type, the age of the contractholder at the time of the sale, and the timing of the first lifetime income withdrawal. Range reflects the utilization rate for the vast majority of business with living benefits.
(9)The withdrawal rate assumption estimates the magnitude of annual contractholder withdrawals relative to the maximum allowable amount under the contract. These assumptions vary based on the age of the contractholder, the tax status of the contract and the duration since the contractholder began lifetime withdrawals. As of both December 31, 2025 and 2024, the minimum withdrawal rate assumption is 78 100 100 % and decrease as the withdrawal rate moves further away from 100 %.
(10)The range reflects the mortality rates for the vast majority of business with living benefits and other contracts, with policyholders ranging from 50 to 90 years old. While the majority of living benefits have a minimum age requirement, certain other contracts do not have an age restriction. This results in contractholders with mortality rates approaching 0 % for certain benefits. Mortality rates may vary by product, age and duration. A mortality improvement assumption is also incorporated into the overall mortality table.
(11)Includes deposit assets related to reinsurance agreements using deposit method of accounting and modified coinsurance agreements, which include amounts representing the fair value of embedded derivative instruments associated with the index-linked features of certain annuity products.
(12)Policyholders’ account balances primarily represent general account liabilities for the index-linked interest credited on certain of the Company’s life and annuity products that are accounted for as embedded derivatives. Since the valuation methodology for these liabilities uses a range of inputs that vary at the contract level over the cash flow projection period, presenting a range, rather than a weighted average, is a more meaningful representation of the unobservable inputs used in the valuation.
(13)Option budget estimates the expected long-term cost of options used to hedge exposures associated with equity price and interest rate changes. The level of option budget determines future costs of the options, which impacts the growth in account value and the valuation of embedded derivatives.
Interrelationships Between Unobservable Inputs – In addition to the sensitivities of fair value measurements to changes in each unobservable input in isolation, as reflected in the table above, interrelationships between these inputs may also exist, such that a change in one unobservable input may give rise to a change in another or multiple inputs. Examples of such interrelationships for significant internally-priced Level 3 assets and liabilities are as follows:
Corporate Securities – The rate used to discount future cash flows reflects current risk-free rates plus credit and liquidity spread requirements that market participants would use to value an asset. The discount rate may be influenced by many factors, including market cycles, expectations of default, collateral, term, and asset complexity. Each of these factors can influence discount rates, either in isolation, or in response to other factors. During weaker economic cycles, as the expectations of default increase, credit spreads widen, which results in a decrease in fair value.
Commercial Mortgage-backed Securities – Interrelationships may exist between the prepayment rate, the default rate and/or loss severity, depending on specific market conditions. In stronger economic cycles, prepayment rates are generally driven by underlying property appreciation and subsequent cash-out refinances, while default rates and loss severity may be lower. During weaker economic cycles, prepayment rates may decline, while default rates and loss severity increase. Generally, a change in the assumption used for the probability of default would be accompanied by a directionally similar change in the assumption used for the loss severity and a directionally opposite change in the assumption used for prepayment rates. The impact of these factors on average life and economics varies with the deal structure and tranche subordination.
Market Risk Benefits – The Company expects efficient benefit utilization and withdrawal rates to generally be correlated with lapse rates. However, behavior is generally highly dependent on the facts and circumstances surrounding the individual contractholder, such as their liquidity needs or tax situation, which could drive lapse behavior independent of other contractholder behavior assumptions. To the extent more efficient contractholder behavior results in greater in-the-moneyness at the contract level, lapse rates may decline for those contracts. Similarly, to the extent that increases in equity volatility are correlated with overall declines in the capital markets, lapse rates may decline as contracts become more in-the-money.
56
PRUCO LIFE INSURANCE COMPANY
Notes to Consolidated Financial Statements—(Continued)
Changes in Level 3 Assets and Liabilities – The following tables describe changes in fair values of Level 3 assets and liabilities as of the dates indicated, as well as the portion of gains or losses included in income attributable to unrealized gains or losses related to those assets and liabilities still held at the end of their respective periods (excluding MRBs disclosed in Note 11). When a determination is made to classify assets and liabilities within Level 3, the determination is based on significance of the unobservable inputs in the overall fair value measurement. All transfers are based on changes in the observability of the valuation inputs, including the availability of pricing service information that the Company can validate. Transfers into Level 3 are generally the result of unobservable inputs utilized within valuation methodologies and the use of indicative broker quotes for assets that were previously valued using observable inputs. Transfers out of Level 3 are generally due to the use of observable inputs in valuation methodologies as well as the availability of pricing service information for certain assets that the Company can validate.
| Year Ended December 31, 2025(6) | |||||||||||||||||||||||||||||||||||
| Fair Value, beginning of period | Total realized and unrealized gains (losses) | Purchases | Sales | Issuances | Settlements | Other(1) | Transfers into Level 3(7) | Transfers out of Level 3(7) | Fair Value, end of period | Unrealized gains (losses) for assets and liabilities still held(2) | |||||||||||||||||||||||||
| (in thousands) | |||||||||||||||||||||||||||||||||||
| Fixed maturities, available-for-sale: | |||||||||||||||||||||||||||||||||||
| Foreign government | $ | $ | ( | $ | $ | $ | $ | ( | $ | $ | $ | $ | $ | ||||||||||||||||||||||
| Corporate securities(3) | ( | ( | ( | ( | ( | ( | |||||||||||||||||||||||||||||
| Structured securities(4) | ( | ( | ( | ( | |||||||||||||||||||||||||||||||
| Other assets: | |||||||||||||||||||||||||||||||||||
| Fixed maturities, trading | ( | ( | |||||||||||||||||||||||||||||||||
| Equity securities | ( | ( | ( | ||||||||||||||||||||||||||||||||
| Other invested assets | ( | ( | |||||||||||||||||||||||||||||||||
| Short-term investments | ( | ( | ( | ( | ( | ||||||||||||||||||||||||||||||
| Cash equivalents | ( | ( | ( | ( | ( | ||||||||||||||||||||||||||||||
| Reinsurance recoverables and deposit receivables(5) | ( | ( | |||||||||||||||||||||||||||||||||
| Separate account assets | ( | ( | |||||||||||||||||||||||||||||||||
| Receivables from parent and affiliates | ( | ( | ( | ( | ( | ||||||||||||||||||||||||||||||
| Liabilities: | |||||||||||||||||||||||||||||||||||
| Policyholders' account balances(5) | ( | ( | ( | ( | |||||||||||||||||||||||||||||||
| Other liabilities | ( | ||||||||||||||||||||||||||||||||||
| Notes issued by consolidated variable interest entities | ( | ||||||||||||||||||||||||||||||||||
57
PRUCO LIFE INSURANCE COMPANY
Notes to Consolidated Financial Statements—(Continued)
| Year Ended December 31, 2025 | ||||||||||||||||||||||||||||||||
| Total realized and unrealized gains (losses) | Unrealized gains (losses) for assets and liabilities still held(2) | |||||||||||||||||||||||||||||||
| Realized investment gains (losses), net | Other income (loss) | Interest credited to policyholders' account balances | Included in other comprehensive income (loss) | Net investment income | Realized investment gains (losses), net | Other income (loss) | Interest credited to policyholders' account balances | Included in other comprehensive income (loss) | ||||||||||||||||||||||||
| (in thousands) | ||||||||||||||||||||||||||||||||
| Fixed maturities, available-for-sale | $ | ( | $ | $ | $ | $ | $ | ( | $ | $ | $ | |||||||||||||||||||||
| Other assets: | ||||||||||||||||||||||||||||||||
| Fixed maturities, trading | ( | |||||||||||||||||||||||||||||||
| Equity securities | ( | ( | ||||||||||||||||||||||||||||||
| Other invested assets | ( | ( | ||||||||||||||||||||||||||||||
| Short-term investments | ( | ( | ||||||||||||||||||||||||||||||
| Cash equivalents | ( | ( | ||||||||||||||||||||||||||||||
| Reinsurance recoverables and deposit receivables | ( | ( | ||||||||||||||||||||||||||||||
| Separate account assets | ||||||||||||||||||||||||||||||||
| Receivables from parent and affiliates | ( | ( | ( | |||||||||||||||||||||||||||||
| Liabilities: | ||||||||||||||||||||||||||||||||
| Policyholders' account balances | ( | |||||||||||||||||||||||||||||||
| Other liabilities | ||||||||||||||||||||||||||||||||
| Notes issued by consolidated variable interest entities | ||||||||||||||||||||||||||||||||
58
PRUCO LIFE INSURANCE COMPANY
Notes to Consolidated Financial Statements—(Continued)
| Year Ended December 31, 2024(6) | |||||||||||||||||||||||||||||||||||
| Fair Value, beginning of period | Total realized and unrealized gains (losses) | Purchases | Sales | Issuances | Settlements | Other(1) | Transfers into Level 3(7) | Transfers out of Level 3(7) | Fair Value, end of period | Unrealized gains (losses) for assets and liabilities still held(2) | |||||||||||||||||||||||||
| (in thousands) | |||||||||||||||||||||||||||||||||||
| Fixed maturities, available-for-sale: | |||||||||||||||||||||||||||||||||||
| Foreign government | $ | $ | ( | $ | $ | $ | $ | $ | $ | $ | $ | $ | ( | ||||||||||||||||||||||
| Corporate securities(3) | ( | ( | ( | ( | ( | ||||||||||||||||||||||||||||||
| Structured securities(4) | ( | ( | ( | ( | ( | ||||||||||||||||||||||||||||||
| Other assets: | |||||||||||||||||||||||||||||||||||
| Fixed maturities, trading | ( | ( | ( | ( | ( | ||||||||||||||||||||||||||||||
| Equity securities | ( | ( | ( | ( | |||||||||||||||||||||||||||||||
| Other invested assets | |||||||||||||||||||||||||||||||||||
| Short-term investments | ( | ( | ( | ||||||||||||||||||||||||||||||||
| Cash equivalents | ( | ( | ( | ( | |||||||||||||||||||||||||||||||
| Reinsurance recoverables and deposit receivables(5) | ( | ||||||||||||||||||||||||||||||||||
| Separate account assets | ( | ( | |||||||||||||||||||||||||||||||||
| Receivables from parent and affiliates | ( | ( | |||||||||||||||||||||||||||||||||
| Liabilities: | |||||||||||||||||||||||||||||||||||
| Policyholders' account balances(5) | ( | ( | ( | ( | |||||||||||||||||||||||||||||||
| Other liabilities | ( | ( | ( | ||||||||||||||||||||||||||||||||
59
PRUCO LIFE INSURANCE COMPANY
Notes to Consolidated Financial Statements—(Continued)
| Year Ended December 31, 2024 | ||||||||||||||||||||||||||||||||
| Total realized and unrealized gains (losses) | Unrealized gains (losses) for assets and liabilities still held(2) | |||||||||||||||||||||||||||||||
| Realized investment gains (losses), net | Other income (loss) | Interest credited to policyholders' account balances | Included in other comprehensive income (loss) | Net investment income | Realized investment gains (losses), net | Other income (loss) | Interest credited to policyholders' account balances | Included in other comprehensive income (loss) | ||||||||||||||||||||||||
| (in thousands) | ||||||||||||||||||||||||||||||||
| Fixed maturities, available-for-sale | $ | ( | $ | $ | $ | ( | $ | ( | $ | ( | $ | $ | $ | ( | ||||||||||||||||||
| Other assets: | ||||||||||||||||||||||||||||||||
| Fixed maturities, trading | ( | ( | ||||||||||||||||||||||||||||||
| Equity securities | ( | ( | ||||||||||||||||||||||||||||||
| Other invested assets | ||||||||||||||||||||||||||||||||
| Short-term investments | ( | |||||||||||||||||||||||||||||||
| Cash equivalents | ( | ( | ||||||||||||||||||||||||||||||
| Reinsurance recoverables and deposit receivables | ( | |||||||||||||||||||||||||||||||
| Separate account assets | ||||||||||||||||||||||||||||||||
| Receivables from parent and affiliates | ||||||||||||||||||||||||||||||||
| Liabilities: | ||||||||||||||||||||||||||||||||
| Policyholders' account balances | ( | |||||||||||||||||||||||||||||||
| Other liabilities | ( | ( | ||||||||||||||||||||||||||||||
| Year Ended December 31, 2023 | ||||||||||||||||||||||||||||||||
| Total realized and unrealized gains (losses) | Unrealized gains (losses) for assets and liabilities still held(2) | |||||||||||||||||||||||||||||||
| Realized investment gains (losses), net | Other income (loss) | Interest credited to policyholders' account balances | Included in other comprehensive income (loss) | Net investment income | Realized investment gains (losses), net | Other income (loss) | Interest credited to policyholders' account balances | Included in other comprehensive income (loss) | ||||||||||||||||||||||||
| (in thousands) | ||||||||||||||||||||||||||||||||
| Fixed maturities, available-for-sale | $ | ( | $ | $ | $ | ( | $ | $ | ( | $ | $ | $ | ( | |||||||||||||||||||
| Other assets: | ||||||||||||||||||||||||||||||||
| Fixed maturities, trading | ||||||||||||||||||||||||||||||||
| Equity securities | ( | ( | ||||||||||||||||||||||||||||||
| Other invested assets | ||||||||||||||||||||||||||||||||
| Short-term investments | ( | |||||||||||||||||||||||||||||||
| Reinsurance recoverables and deposit receivables | ( | ( | ||||||||||||||||||||||||||||||
| Separate account assets | ||||||||||||||||||||||||||||||||
| Liabilities: | ||||||||||||||||||||||||||||||||
| Policyholders' account balances | ( | ( | ||||||||||||||||||||||||||||||
(1)"Other" includes additional activity not allocated to the specific categories within the rollforward of Level 3 Assets and Liabilities.
(2)Unrealized gains or losses related to assets still held at the end of the period do not include amortization or accretion of premiums and discounts.
(3)Includes U.S. corporate private, foreign corporate public, foreign corporate private, and foreign government bonds.
(4)Includes asset-backed, commercial mortgage-backed, and residential mortgage-backed securities.
60
PRUCO LIFE INSURANCE COMPANY
Notes to Consolidated Financial Statements—(Continued)
(5)Purchases/issuances and settlements for Policyholders' account balances and Reinsurance recoverables and deposit receivables are presented net in the rollforward.
(6)Excludes MRB assets of $2,656 million and $2,637 million and MRB liabilities of $4,482 million and $4,281 million as of December 31, 2025 and 2024, respectively. See Note 11 for additional information.
(7)Transfers into or out of Level 3 are generally reported at the value as of the beginning of the quarter in which the transfers occur for any such positions still held at the end of the quarter.
Fair Value of Financial Instruments
The tables below present the carrying amount and fair value by fair value hierarchy level of certain financial instruments that are not reported at fair value. The financial instruments presented below are reported at carrying value on the Company’s Consolidated Statements of Financial Position. In some cases, as described below, the carrying amount equals or approximates fair value.
| December 31, 2025 | ||||||||||||||||||||||||||||||||
| Fair Value | Carrying Amount(1) | |||||||||||||||||||||||||||||||
| Level 1 | Level 2 | Level 3 | Total | Total | ||||||||||||||||||||||||||||
| (in thousands) | ||||||||||||||||||||||||||||||||
| Assets: | ||||||||||||||||||||||||||||||||
| Commercial mortgage and other loans | $ | $ | $ | $ | $ | |||||||||||||||||||||||||||
| Policy loans | ||||||||||||||||||||||||||||||||
| Short-term investments | ||||||||||||||||||||||||||||||||
| Cash and cash equivalents | ||||||||||||||||||||||||||||||||
| Accrued investment income | ||||||||||||||||||||||||||||||||
| Reinsurance recoverables and deposit receivables | ||||||||||||||||||||||||||||||||
| Receivables from parent and affiliates | ||||||||||||||||||||||||||||||||
| Other assets | ||||||||||||||||||||||||||||||||
| Total assets | $ | $ | $ | $ | $ | |||||||||||||||||||||||||||
| Liabilities: | ||||||||||||||||||||||||||||||||
| Policyholders’ account balances - investment contracts | $ | $ | $ | $ | $ | |||||||||||||||||||||||||||
| Cash collateral for loaned securities | ||||||||||||||||||||||||||||||||
| Reinsurance and funds withheld payables | ||||||||||||||||||||||||||||||||
| Payables to parent and affiliates | ||||||||||||||||||||||||||||||||
| Other liabilities | ||||||||||||||||||||||||||||||||
| Total liabilities | $ | $ | $ | $ | $ | |||||||||||||||||||||||||||
61
PRUCO LIFE INSURANCE COMPANY
Notes to Consolidated Financial Statements—(Continued)
| December 31, 2024 | ||||||||||||||||||||||||||||||||
| Fair Value | Carrying Amount(1) | |||||||||||||||||||||||||||||||
| Level 1 | Level 2 | Level 3 | Total | Total | ||||||||||||||||||||||||||||
| (in thousands) | ||||||||||||||||||||||||||||||||
| Assets: | ||||||||||||||||||||||||||||||||
| Commercial mortgage and other loans | $ | $ | $ | $ | $ | |||||||||||||||||||||||||||
| Policy loans | ||||||||||||||||||||||||||||||||
| Short-term investments | ||||||||||||||||||||||||||||||||
| Cash and cash equivalents | ||||||||||||||||||||||||||||||||
| Accrued investment income | ||||||||||||||||||||||||||||||||
| Reinsurance recoverables and deposit receivables | ||||||||||||||||||||||||||||||||
| Receivables from parent and affiliates | ||||||||||||||||||||||||||||||||
| Other assets | ||||||||||||||||||||||||||||||||
| Total assets | $ | $ | $ | $ | $ | |||||||||||||||||||||||||||
| Liabilities: | ||||||||||||||||||||||||||||||||
| Policyholders’ account balances - investment contracts | $ | $ | $ | $ | $ | |||||||||||||||||||||||||||
| Cash collateral for loaned securities | ||||||||||||||||||||||||||||||||
| Reinsurance and funds withheld payables | ||||||||||||||||||||||||||||||||
| Payables to parent and affiliates | ||||||||||||||||||||||||||||||||
| Other liabilities | ||||||||||||||||||||||||||||||||
| Total liabilities | $ | $ | $ | $ | $ | |||||||||||||||||||||||||||
(1)Carrying values presented herein differ from those in the Company’s Consolidated Statements of Financial Position because certain items within the respective financial statement captions are not considered financial instruments or are out of scope under authoritative guidance relating to disclosures of the fair value of financial instruments.
The fair values presented above have been determined by using available market information and by applying market valuation methodologies, as described in more detail below.
Commercial Mortgage and Other Loans
The fair value of most commercial mortgage loans is based upon the present value of the expected future cash flows discounted at the appropriate U.S. Treasury rate or foreign government bond rate (for non-U.S. dollar-denominated loans) plus an appropriate credit spread for loans of similar quality, average life and currency. The quality ratings for these loans, a primary determinant of the credit spreads and a significant component of the pricing process, are based on an internally-developed methodology. Certain commercial mortgage loans are valued incorporating other factors, including the terms of the loans, the relative strength of the underlying collateral, the principal exit strategies for the loans, prevailing interest rates and credit risk.
Policy Loans
The Company's valuation technique for policy loans is to discount cash flows at the current policy loan coupon rate. Policy loans are fully collateralized by the cash surrender value of underlying insurance policies. As a result, the carrying value of the policy loans approximates the fair value.
Short-Term Investments, Cash and Cash Equivalents, Accrued Investment Income, Receivables from Parent and Affiliates and Other Assets
The Company believes that due to the short-term nature of certain assets, the carrying value approximates fair value. These assets include: certain short-term investments, which are not securities, recorded at amortized cost, cash and cash equivalent instruments; accrued investment income; receivables from parent and affiliates; and other assets that meet the definition of financial instruments, including receivables such as unsettled trades and accounts receivable.
62
PRUCO LIFE INSURANCE COMPANY
Notes to Consolidated Financial Statements—(Continued)
Reinsurance Recoverables and Deposit Receivables
Reinsurance recoverables and deposit receivables include receivables from modified coinsurance arrangements and other reinsurance arrangements between the Company, its affiliates, and third-parties. See Note 12 for additional information about the Company's reinsurance arrangements. Deposit receivables primarily consist of deposit assets related to the reinsurance agreements. Deposits made are included in "Reinsurance recoverables and deposit receivables". The deposit assets are adjusted as amounts are paid, consistent with the underlying contracts.
Policyholders’ Account Balances - Investment Contracts
Only the portion of policyholders’ account balances related to products that are investment contracts (those without significant mortality or morbidity risk) are reflected in the table above. For fixed deferred annuities, payout annuities and other similar contracts without life contingencies, fair values are generally derived using discounted projected cash flows based on interest rates that are representative of the Company’s financial strength ratings, and hence reflect the Company’s NPR. For those balances that can be withdrawn by the customer at any time without prior notice or penalty, the fair value is the amount estimated to be payable to the customer as of the reporting date, which is generally the carrying value.
Cash Collateral for Loaned Securities
Cash collateral for loaned securities represents the collateral received or paid in connection with loaning or borrowing securities. Due to the short-term nature of these transactions, the carrying value approximates fair value.
Reinsurance and Funds Withheld Payables
Reinsurance and funds withheld payables include amounts payable to the reinsurer under coinsurance with funds withheld arrangements where the Company is the cedant. Deposits received are included in "Reinsurance and funds withheld payables". The deposit liabilities are adjusted as amounts are received, consistent with the underlying contracts.
Payables to Parent and Affiliates
Payables to parent and affiliates is primarily related to accrued expense payables. Due to the short-term until settlement of most of these liabilities, the Company believes that carrying value approximates fair value.
Other Liabilities
Other liabilities are primarily payables, such as unsettled trades, drafts, and escrow deposits. Due to the short-term until settlement of most of these liabilities, the Company believes that carrying value approximates fair value.
63
PRUCO LIFE INSURANCE COMPANY
Notes to Consolidated Financial Statements—(Continued)
7. DEFERRED POLICY ACQUISITION COSTS, DEFERRED REINSURANCE AND DEFERRED SALES INDUCEMENTS
Deferred Policy Acquisition Costs
The following table shows a rollforward for the lines of business that contain DAC balances, along with a reconciliation to the Company's total DAC balance:
| Fixed Annuities | Variable Annuities | Term Life | Variable / Universal Life | Total | ||||||||||||||||||||||||||||
| (in thousands) | ||||||||||||||||||||||||||||||||
| Balance, December 31, 2022 | $ | $ | $ | $ | $ | |||||||||||||||||||||||||||
| Capitalization | ||||||||||||||||||||||||||||||||
| Amortization expense | ( | ( | ( | ( | ( | |||||||||||||||||||||||||||
| Other(1) | ( | ( | ( | |||||||||||||||||||||||||||||
| Balance, December 31, 2023 | ||||||||||||||||||||||||||||||||
| Capitalization | ||||||||||||||||||||||||||||||||
| Amortization expense | ( | ( | ( | ( | ( | |||||||||||||||||||||||||||
| Other(2)(3) | ( | ( | ( | |||||||||||||||||||||||||||||
| Balance, December 31, 2024 | ||||||||||||||||||||||||||||||||
| Capitalization | ||||||||||||||||||||||||||||||||
| Amortization expense | ( | ( | ( | ( | ( | |||||||||||||||||||||||||||
| Other | ( | ( | ||||||||||||||||||||||||||||||
| Balance, December 31, 2025 | $ | $ | $ | $ | $ | |||||||||||||||||||||||||||
(1) Includes the impact of the reinsurance agreement with AuguStar. See Note 12 for additional information.
(2) Includes the impacts of the Universal Life reinsurance transaction with PAR U and PURE. See Note 12 for additional information.
(3) Includes the impacts of the Term Life reinsurance transaction with PARCC. See Note 12 for additional information.
Deferred Reinsurance Losses
The following table shows a rollforward for the lines of business that contain DRL balances, along with a reconciliation to the Company's total DRL balance:
| Variable Annuities | Term Life | Variable / Universal Life | Total | ||||||||||||||||||||
| (in thousands) | |||||||||||||||||||||||
| Balance, December 31, 2022 | $ | $ | $ | $ | |||||||||||||||||||
| Amortization | ( | ( | ( | ||||||||||||||||||||
| Other | ( | ( | |||||||||||||||||||||
| Balance, December 31, 2023 | |||||||||||||||||||||||
| Amortization | ( | ( | ( | ( | |||||||||||||||||||
| Other(1)(2) | |||||||||||||||||||||||
| Balance, December 31, 2024 | |||||||||||||||||||||||
| Amortization | ( | ( | ( | ( | |||||||||||||||||||
| Other | |||||||||||||||||||||||
| Balance, December 31, 2025 | $ | $ | $ | $ | |||||||||||||||||||
(1) Includes $979 million DRL related to the reinsurance transaction with Wilton Re. See Note 12 for additional information.
(2) Includes $351 million DRL related to the reinsurance transaction with PARCC. See Note 12 for additional information.
64
PRUCO LIFE INSURANCE COMPANY
Notes to Consolidated Financial Statements—(Continued)
Deferred Reinsurance Gains
The following table shows a rollforward for the lines of business that contain DRG balances, along with a reconciliation to the Company's total DRG balance:
| Fixed Annuities | Variable Annuities | Variable / Universal Life | International | Total | |||||||||||||||||||||||||
| (in thousands) | |||||||||||||||||||||||||||||
| Balance, December 31, 2022 | $ | $ | $ | $ | $ | ||||||||||||||||||||||||
| Amortization | ( | ( | ( | ( | |||||||||||||||||||||||||
| Other(1) | ( | ||||||||||||||||||||||||||||
| Balance, December 31, 2023 | |||||||||||||||||||||||||||||
| Amortization | ( | ( | ( | ( | |||||||||||||||||||||||||
| Other(2)(3) | ( | ( | |||||||||||||||||||||||||||
| Balance, December 31, 2024 | |||||||||||||||||||||||||||||
| Amortization | ( | ( | ( | ( | ( | ||||||||||||||||||||||||
| Other(4) | ( | ( | |||||||||||||||||||||||||||
| Balance, December 31, 2025 | $ | $ | $ | $ | $ | ||||||||||||||||||||||||
(1) Includes the impact of the reinsurance agreement with AuguStar. See Note 12 for additional information.
(2) Includes the impact of the Universal Life reinsurance transaction with PAR U, PURE and Prudential Insurance effective January 1, 2024, including $1,207 million of DRG, partially offset by a $116 million write-off of the DRG that was recognized with the previous reinsurance agreement. See Note 12 for additional information.
(3) Includes the impact of the Universal Life reinsurance transaction with PAR U and Prudential Insurance effective October 2024, including $798 million DRG, partially offset by a $94 million write-off of the DRG that was recognized with the previous reinsurance agreement. See Note 12 for additional information.
(4) Includes the impact of recognizing the previously existing DRG, attributable to the recapture of certain YRT transactions from Prudential Insurance effective October 1, 2025. See Note 12 for additional information.
Deferred Sales Inducements
The following table shows a rollforward of DSI balances for variable annuity products, which is the only line of business that contains a DSI balance, along with a reconciliation to the Company's total DSI balance:
| Variable Annuities | |||||
| (in thousands) | |||||
| Balance, December 31, 2022 | $ | ||||
| Capitalization | |||||
| Amortization expense | ( | ||||
| Other | |||||
| Balance, December 31, 2023 | |||||
| Capitalization | |||||
| Amortization expense | ( | ||||
| Balance, December 31, 2024 | |||||
| Capitalization | |||||
| Amortization expense | ( | ||||
| Other | |||||
| Balance, December 31, 2025 | $ | ||||
65
PRUCO LIFE INSURANCE COMPANY
Notes to Consolidated Financial Statements—(Continued)
8. SEPARATE ACCOUNTS
The Company issues variable annuity and variable life insurance contracts through its separate accounts for which investment income and investment gains and losses accrue directly to, and investment risk is borne by, the contractholder. Most variable annuity and variable life insurance contracts are offered with both separate and general account options. See Note 10 for additional information.
The assets supporting the variable portion of variable annuity and variable life insurance contracts are carried at fair value and reported as “Separate account assets” with an equivalent amount reported as “Separate account liabilities”. The liabilities related to the net amount at risk are reflected within "Future policy benefits" or "Market risk benefit liabilities" (or "assets", if applicable). Amounts assessed against the contractholders for mortality, administration, and other services are included within revenue in “Policy charges and fee income” and changes in liabilities for minimum guarantees are generally included in “Policyholders’ benefits” or “Change in value of market risk benefits, net of related hedging gains (losses)”.
Separate Account Assets
The aggregate fair value of assets, by major investment asset category, supporting separate accounts is as follows:
| December 31, 2025 | December 31, 2024 | ||||||||||
| (in thousands) | |||||||||||
| Asset Type: | |||||||||||
| U.S. Treasury securities and obligations of U.S. government authorities and agencies | $ | $ | |||||||||
| Obligations of U.S. states and their political subdivisions authorities | |||||||||||
| U.S. corporate securities | |||||||||||
| Foreign corporate securities | |||||||||||
| Asset-backed securities | |||||||||||
| Mortgage-backed securities | |||||||||||
| Mutual funds: | |||||||||||
| Equity | |||||||||||
| Fixed Income | |||||||||||
| Other | |||||||||||
| Equity securities | |||||||||||
| Other invested assets | |||||||||||
| Short-term investments | |||||||||||
| Cash and cash equivalents | |||||||||||
| Total | $ | $ | |||||||||
For the periods ended December 31, 2025, 2024, and 2023, there were no no
66
PRUCO LIFE INSURANCE COMPANY
Notes to Consolidated Financial Statements—(Continued)
Separate Account Liabilities
The balances of and changes in separate account liabilities as of and for the periods indicated are as follows:
| Year Ended December 31, 2025 | |||||||||||||||||
| Variable Annuities | Variable Life | Total | |||||||||||||||
| (in thousands) | |||||||||||||||||
| Balance, beginning of period | $ | $ | $ | ||||||||||||||
| Deposits | |||||||||||||||||
| Investment performance | |||||||||||||||||
| Policy charges | ( | ( | ( | ||||||||||||||
| Surrenders and withdrawals | ( | ( | ( | ||||||||||||||
| Benefit payments | ( | ( | ( | ||||||||||||||
| Net transfers (to) from general account | ( | ( | |||||||||||||||
| Other | |||||||||||||||||
| Balance, end of period | $ | $ | $ | ||||||||||||||
| Cash surrender value(1) | $ | $ | $ | ||||||||||||||
| Year Ended December 31, 2024 | |||||||||||||||||
| Variable Annuities | Variable Life | Total | |||||||||||||||
| (in thousands) | |||||||||||||||||
| Balance, beginning of period | $ | $ | $ | ||||||||||||||
| Deposits | |||||||||||||||||
| Investment performance | |||||||||||||||||
| Policy charges | ( | ( | ( | ||||||||||||||
| Surrenders and withdrawals | ( | ( | ( | ||||||||||||||
| Benefit payments | ( | ( | ( | ||||||||||||||
| Net transfers (to) from general account | ( | ( | ( | ||||||||||||||
| Other | |||||||||||||||||
| Balance, end of period | $ | $ | $ | ||||||||||||||
| Cash surrender value(1) | $ | $ | $ | ||||||||||||||
67
PRUCO LIFE INSURANCE COMPANY
Notes to Consolidated Financial Statements—(Continued)
| Year Ended December 31, 2023 | |||||||||||||||||
| Variable Annuities | Variable Life | Total | |||||||||||||||
| (in thousands) | |||||||||||||||||
| Balance, beginning of period | $ | $ | $ | ||||||||||||||
| Deposits | |||||||||||||||||
| Investment performance | |||||||||||||||||
| Policy charges | ( | ( | ( | ||||||||||||||
| Surrenders and withdrawals | ( | ( | ( | ||||||||||||||
| Benefit payments | ( | ( | ( | ||||||||||||||
| Net transfers (to) from general account(2) | ( | ( | ( | ||||||||||||||
| Other | |||||||||||||||||
| Balance, end of period | $ | $ | $ | ||||||||||||||
| Cash surrender value(1) | $ | $ | $ | ||||||||||||||
(1) Represents the amount of the contractholder's account balances distributable at the balance sheet date less certain surrender charges.
(2) Variable life includes $900 million of funding for a policy loan to an affiliated irrevocable trust. See Note 16 for additional information.
9. LIABILITY FOR FUTURE POLICY BENEFITS
Liability for future policy benefits primarily consists of the following sub-components, which are discussed in greater detail below.
•Benefit reserves;
•Deferred profit liability; and
•Additional insurance reserves
In 2025, the Company recognized a favorable impact to net income attributable to its annual reviews and update of assumptions and other refinements for liability for future policy benefits. The impact was favorable for direct and assumed benefit reserves and DPL, net of the impact of flooring these liabilities at zero for each issue year cohort, primarily due to updates to mortality assumptions in individual life insurance. Additionally, there was a favorable impact for direct and assumed AIR, primarily due to offsetting impacts from updated policyholder behavior assumptions and mortality assumptions on universal life policies.
In 2024, the Company recognized an impact to net income attributable to our annual reviews and update of assumptions and other refinements for liability for future policy benefits. Overall impact is immaterial for direct and assumed benefit reserves and DPL, net of the impact of flooring these liabilities at zero for each issue year cohort. Additionally, for direct and assumed AIR, the Company recognized an unfavorable impact primarily due to updates to policyholder behavior assumptions on universal life policies with secondary guarantees.
In 2023, the Company recognized an impact to net income attributable to the annual reviews and update of assumptions and other refinements for liability for future policy benefits. Overall impact is immaterial for direct and assumed benefit reserves and DPL, net of the impact of flooring these liabilities at zero for each issue year cohort. Additionally, for direct and assumed AIR, the Company recognized an unfavorable impact primarily due to unfavorable model refinements, partially offset by updates to economic assumptions, including expected future rates of returns on universal life policies with secondary guarantees.
68
PRUCO LIFE INSURANCE COMPANY
Notes to Consolidated Financial Statements—(Continued)
Benefit Reserves
The balances of and changes in benefit reserves as of and for the periods indicated consist of the three tables presented below: present value of expected net premiums rollforward, present value of expected future policy benefits rollforward, and net liability for future policy benefits.
| Year Ended December 31, 2025 | |||||||||||||||||
| Present Value of Expected Net Premiums | |||||||||||||||||
| Term Life | Fixed Annuities | Total | |||||||||||||||
| (in thousands) | |||||||||||||||||
| Balance, beginning of period | $ | $ | $ | ||||||||||||||
| Effect of cumulative changes in discount rate assumptions, beginning of period | |||||||||||||||||
| Balance at original discount rate, beginning of period | |||||||||||||||||
| Effect of assumption update | ( | ( | |||||||||||||||
| Effect of actual variances from expected experience and other activity | ( | ( | |||||||||||||||
| Adjusted balance, beginning of period | |||||||||||||||||
| Issuances | |||||||||||||||||
| Net premiums / considerations collected | ( | ( | ( | ||||||||||||||
| Interest accrual | |||||||||||||||||
| Other adjustments(1) | ( | ( | |||||||||||||||
| Balance at original discount rate, end of period | |||||||||||||||||
| Effect of cumulative changes in discount rate assumptions, end of period | ( | ( | |||||||||||||||
| Balance, end of period | $ | $ | $ | ||||||||||||||
| Year Ended December 31, 2025 | |||||||||||||||||
| Present Value of Expected Future Policy Benefits | |||||||||||||||||
| Term Life | Fixed Annuities | Total | |||||||||||||||
| (in thousands) | |||||||||||||||||
| Balance, beginning of period | $ | $ | $ | ||||||||||||||
| Effect of cumulative changes in discount rate assumptions, beginning of period | |||||||||||||||||
| Balance at original discount rate, beginning of period | |||||||||||||||||
| Effect of assumption update | ( | ( | |||||||||||||||
| Effect of actual variances from expected experience and other activity | ( | ( | |||||||||||||||
| Adjusted balance, beginning of period | |||||||||||||||||
| Issuances | |||||||||||||||||
| Interest accrual | |||||||||||||||||
| Benefit payments | ( | ( | ( | ||||||||||||||
| Other adjustments(1) | ( | ||||||||||||||||
| Balance at original discount rate, end of period | |||||||||||||||||
| Effect of cumulative changes in discount rate assumptions, end of period | ( | ( | ( | ||||||||||||||
| Balance, end of period | $ | $ | $ | ||||||||||||||
| Other, end of period | |||||||||||||||||
| Total balance, end of period | $ | ||||||||||||||||
69
PRUCO LIFE INSURANCE COMPANY
Notes to Consolidated Financial Statements—(Continued)
(1) Includes the impact of recognizing the recapture of certain YRT transactions from Prudential Insurance effective October 1, 2025. See Note 12 for additional information.
| Year Ended December 31, 2025 | |||||||||||||||||
| Net Liability for Future Policy Benefits (Benefit Reserves) | |||||||||||||||||
| Term Life | Fixed Annuities | Total | |||||||||||||||
| (in thousands) | |||||||||||||||||
| Balance, end of period, pre-flooring | $ | $ | $ | ||||||||||||||
| Flooring impact, end of period | |||||||||||||||||
| Balance, end of period, post-flooring | |||||||||||||||||
| Less: Reinsurance recoverables | |||||||||||||||||
| Balance after reinsurance recoverables, end of period, post-flooring | $ | $ | $ | ||||||||||||||
| Year Ended December 31, 2024 | |||||||||||||||||
| Present Value of Expected Net Premiums | |||||||||||||||||
| Term Life | Fixed Annuities | Total | |||||||||||||||
| (in thousands) | |||||||||||||||||
| Balance, beginning of period | $ | $ | $ | ||||||||||||||
| Effect of cumulative changes in discount rate assumptions, beginning of period | |||||||||||||||||
| Balance at original discount rate, beginning of period | |||||||||||||||||
| Effect of assumption update | |||||||||||||||||
| Effect of actual variances from expected experience and other activity | ( | ( | |||||||||||||||
| Adjusted balance, beginning of period | |||||||||||||||||
| Issuances | |||||||||||||||||
| Net premiums / considerations collected | ( | ( | ( | ||||||||||||||
| Interest accrual | |||||||||||||||||
| Other adjustments | |||||||||||||||||
| Balance at original discount rate, end of period | |||||||||||||||||
| Effect of cumulative changes in discount rate assumptions, end of period | ( | ( | |||||||||||||||
| Balance, end of period | $ | $ | $ | ||||||||||||||
70
PRUCO LIFE INSURANCE COMPANY
Notes to Consolidated Financial Statements—(Continued)
| Year Ended December 31, 2024 | |||||||||||||||||
| Present Value of Expected Future Policy Benefits | |||||||||||||||||
| Term Life | Fixed Annuities | Total | |||||||||||||||
| (in thousands) | |||||||||||||||||
| Balance, beginning of period | $ | $ | $ | ||||||||||||||
| Effect of cumulative changes in discount rate assumptions, beginning of period | |||||||||||||||||
| Balance at original discount rate, beginning of period | |||||||||||||||||
| Effect of assumption update | ( | ||||||||||||||||
| Effect of actual variances from expected experience and other activity | ( | ( | |||||||||||||||
| Adjusted balance, beginning of period | |||||||||||||||||
| Issuances | |||||||||||||||||
| Interest accrual | |||||||||||||||||
| Benefit payments | ( | ( | ( | ||||||||||||||
| Other adjustments | ( | ||||||||||||||||
| Balance at original discount rate, end of period | |||||||||||||||||
| Effect of cumulative changes in discount rate assumptions, end of period | ( | ( | ( | ||||||||||||||
| Balance, end of period | $ | $ | $ | ||||||||||||||
| Other, end of period | |||||||||||||||||
| Total balance, end of period | $ | ||||||||||||||||
| Year Ended December 31, 2024 | |||||||||||||||||
| Net Liability for Future Policy Benefits (Benefit Reserves) | |||||||||||||||||
| Term Life | Fixed Annuities | Total | |||||||||||||||
| (in thousands) | |||||||||||||||||
| Balance, end of period, pre-flooring | $ | $ | $ | ||||||||||||||
| Flooring impact, end of period | |||||||||||||||||
| Balance, end of period, post-flooring | |||||||||||||||||
| Less: Reinsurance recoverables | |||||||||||||||||
| Balance after reinsurance recoverables, end of period, post-flooring | $ | $ | $ | ||||||||||||||
| Year Ended December 31, 2023 | |||||||||||||||||
| Present Value of Expected Net Premiums | |||||||||||||||||
| Term Life | Fixed Annuities | Total | |||||||||||||||
| (in thousands) | |||||||||||||||||
| Balance, beginning of period | $ | $ | $ | ||||||||||||||
| Effect of cumulative changes in discount rate assumptions, beginning of period | |||||||||||||||||
| Balance at original discount rate, beginning of period | |||||||||||||||||
| Effect of assumption update | ( | ( | |||||||||||||||
| Effect of actual variances from expected experience and other activity | ( | ( | ( | ||||||||||||||
| Adjusted balance, beginning of period | ( | ||||||||||||||||
| Issuances | |||||||||||||||||
| Net premiums / considerations collected | ( | ( | ( | ||||||||||||||
| Interest accrual | |||||||||||||||||
| Balance at original discount rate, end of period | |||||||||||||||||
| Effect of cumulative changes in discount rate assumptions, end of period | ( | ( | |||||||||||||||
| Balance, end of period | $ | $ | $ | ||||||||||||||
71
PRUCO LIFE INSURANCE COMPANY
Notes to Consolidated Financial Statements—(Continued)
| Year Ended December 31, 2023 | |||||||||||||||||
| Present Value of Expected Future Policy Benefits | |||||||||||||||||
| Term Life | Fixed Annuities | Total | |||||||||||||||
| (in thousands) | |||||||||||||||||
| Balance, beginning of period | $ | $ | $ | ||||||||||||||
| Effect of cumulative changes in discount rate assumptions, beginning of period | |||||||||||||||||
| Balance at original discount rate, beginning of period | |||||||||||||||||
| Effect of assumption update | ( | ( | |||||||||||||||
| Effect of actual variances from expected experience and other activity | ( | ( | |||||||||||||||
| Adjusted balance, beginning of period | |||||||||||||||||
| Issuances | |||||||||||||||||
| Interest accrual | |||||||||||||||||
| Benefit payments | ( | ( | ( | ||||||||||||||
| Other adjustments | ( | ||||||||||||||||
| Balance at original discount rate, end of period | |||||||||||||||||
| Effect of cumulative changes in discount rate assumptions, end of period | ( | ( | ( | ||||||||||||||
| Balance, end of period | $ | $ | $ | ||||||||||||||
| Other, end of period | |||||||||||||||||
| Total balance, end of period | $ | ||||||||||||||||
| Year Ended December 31, 2023 | |||||||||||||||||
| Net Liability for Future Policy Benefits (Benefit Reserves) | |||||||||||||||||
| Term Life | Fixed Annuities | Total | |||||||||||||||
| (in thousands) | |||||||||||||||||
| Balance, end of period, pre-flooring | $ | $ | $ | ||||||||||||||
| Flooring impact, end of period | |||||||||||||||||
| Balance, end of period, post-flooring | |||||||||||||||||
| Less: Reinsurance recoverables | |||||||||||||||||
| Balance after reinsurance recoverables, end of period, post-flooring | $ | $ | $ | ||||||||||||||
The following tables provide supplemental information related to the balances of and changes in benefit reserves included in the disaggregated tables above, on a gross (direct and assumed) basis, as of and for the periods indicated:
| Year Ended December 31, 2025 | |||||||||||||||||
| Term Life | Fixed Annuities | ||||||||||||||||
| ($ in thousands) | |||||||||||||||||
| Undiscounted expected future gross premiums | $ | $ | |||||||||||||||
| Discounted expected future gross premiums (at original discount rate) | $ | $ | |||||||||||||||
| Discounted expected future gross premiums (at current discount rate) | $ | $ | |||||||||||||||
| Undiscounted expected future benefits and expenses | $ | $ | |||||||||||||||
| Weighted-average duration of the liability in years (at original discount rate) | |||||||||||||||||
| Weighted-average duration of the liability in years (at current discount rate) | |||||||||||||||||
| Weighted-average interest rate (at original discount rate) | % | % | |||||||||||||||
| Weighted-average interest rate (at current discount rate) | % | % | |||||||||||||||
72
PRUCO LIFE INSURANCE COMPANY
Notes to Consolidated Financial Statements—(Continued)
| Year Ended December 31, 2024 | |||||||||||||||||
| Term Life | Fixed Annuities | ||||||||||||||||
| ($ in thousands) | |||||||||||||||||
| Undiscounted expected future gross premiums | $ | $ | |||||||||||||||
| Discounted expected future gross premiums (at original discount rate) | $ | $ | |||||||||||||||
| Discounted expected future gross premiums (at current discount rate) | $ | $ | |||||||||||||||
| Undiscounted expected future benefits and expenses | $ | $ | |||||||||||||||
| Weighted-average duration of the liability in years (at original discount rate) | |||||||||||||||||
| Weighted-average duration of the liability in years (at current discount rate) | |||||||||||||||||
| Weighted-average interest rate (at original discount rate) | % | % | |||||||||||||||
| Weighted-average interest rate (at current discount rate) | % | % | |||||||||||||||
| Year Ended December 31, 2023 | |||||||||||||||||
| Term Life | Fixed Annuities | ||||||||||||||||
| ($ in thousands) | |||||||||||||||||
| Undiscounted expected future gross premiums | $ | $ | |||||||||||||||
| Discounted expected future gross premiums (at original discount rate) | $ | $ | |||||||||||||||
| Discounted expected future gross premiums (at current discount rate) | $ | $ | |||||||||||||||
| Undiscounted expected future benefits and expenses | $ | $ | |||||||||||||||
| Weighted-average duration of the liability in years (at original discount rate) | |||||||||||||||||
| Weighted-average duration of the liability in years (at current discount rate) | |||||||||||||||||
| Weighted-average interest rate (at original discount rate) | % | % | |||||||||||||||
| Weighted-average interest rate (at current discount rate) | % | % | |||||||||||||||
For additional information regarding observable market information and the techniques used to determine the interest rate assumptions seen above, see Note 2.
For non-participating traditional and limited-payment products, if a cohort is in a loss position where the liability for future policy benefits plus the present value of expected future gross premiums are determined to be insufficient to provide for the present value of expected future policy benefits and non-level claim settlement expenses, then the liability for future policy benefits is adjusted at that time, and thereafter such that all changes, both favorable and unfavorable, in expected benefits resulting from both actual experience deviations and changes in future assumptions are recognized immediately as a gain or loss, respectively.
In 2025, there was an immaterial impact to net income for non-participating traditional and limited-payment products, where net premiums exceeded gross premiums for certain issue-year cohorts.
In 2024, there was a $29 million gain in net income for non-participating traditional and limited-payment products, where net premiums exceeded gross premiums for certain issue-year cohorts, which was offset by a $28 million charge, reflecting the impact of ceded reinsurance on the affected cohorts.
In 2023, there was a $31 million gain in net income for non-participating traditional and limited-payment products, where net premiums exceeded gross premiums for certain issue-year cohorts, which was offset by a $30 million charge, reflecting the impact of ceded reinsurance on the affected cohorts.
73
PRUCO LIFE INSURANCE COMPANY
Notes to Consolidated Financial Statements—(Continued)
Deferred Profit Liability
The balances of and changes in DPL for the years ended December 31, are as follows:
| 2025 | 2024 | 2023 | |||||||||||||||
| Fixed Annuities | |||||||||||||||||
| (in thousands) | |||||||||||||||||
| Balance, beginning of period, post-flooring | $ | $ | $ | ||||||||||||||
| Effect of assumption update | ( | ||||||||||||||||
| Effect of actual variances from expected experience and other activity | ( | ( | |||||||||||||||
| Adjusted balance, beginning of period | |||||||||||||||||
| Profits deferred | |||||||||||||||||
| Interest accrual | |||||||||||||||||
| Amortization | ( | ( | ( | ||||||||||||||
| Other adjustments | ( | ( | ( | ||||||||||||||
| Balance, end of period, post-flooring | |||||||||||||||||
| Less: Reinsurance recoverables | |||||||||||||||||
| Balance after reinsurance recoverables, end of period | $ | $ | $ | ||||||||||||||
Additional Insurance Reserves
AIR represents the additional liability for annuitization, death, or other insurance benefits, including guaranteed minimum death benefits ("GMDB") and guaranteed lifetime withdrawal benefit ("GLWB") contract features, that are above and beyond the contractholder's account balance for certain long-duration life and annuity contracts.
The following table shows a rollforward of AIR balances for variable and universal life and fixed annuities products, for the periods indicated, along with a reconciliation to the Company's total AIR balance:
| Year Ended December 31, 2025 | |||||||||||||||||
| Variable / Universal Life | Fixed Annuities | Total | |||||||||||||||
| (in thousands) | |||||||||||||||||
| Balance, including amounts in AOCI, beginning of period, post-flooring | $ | $ | $ | ||||||||||||||
| Flooring impact and amounts in AOCI | |||||||||||||||||
| Balance, excluding amounts in AOCI, beginning of period, pre-flooring | |||||||||||||||||
| Effect of assumption update | ( | ( | |||||||||||||||
| Effect of actual variances from expected experience and other activity | |||||||||||||||||
| Adjusted balance, beginning of period | |||||||||||||||||
| Assessments collected(1) | |||||||||||||||||
| Interest accrual | |||||||||||||||||
| Benefits paid | ( | ( | |||||||||||||||
| Other adjustments(2) | |||||||||||||||||
| Balance, excluding amounts in AOCI, end of period, pre-flooring | |||||||||||||||||
| Flooring impact and amounts in AOCI | ( | ( | ( | ||||||||||||||
| Balance, including amounts in AOCI, end of period, post-flooring | |||||||||||||||||
| Less: Reinsurance recoverables | |||||||||||||||||
| Balance after reinsurance recoverables, including amounts in AOCI, end of period | $ | $ | |||||||||||||||
| Other | |||||||||||||||||
| Total balance after reinsurance recoverables | $ | ||||||||||||||||
74
PRUCO LIFE INSURANCE COMPANY
Notes to Consolidated Financial Statements—(Continued)
| Year Ended December 31, 2024 | |||||||||||||||||
| Variable / Universal Life | Fixed Annuities | Total | |||||||||||||||
| (in thousands) | |||||||||||||||||
| Balance, including amounts in AOCI, beginning of period, post-flooring | $ | $ | $ | ||||||||||||||
| Flooring impact and amounts in AOCI | |||||||||||||||||
| Balance, excluding amounts in AOCI, beginning of period, pre-flooring | |||||||||||||||||
| Effect of assumption update | |||||||||||||||||
| Effect of actual variances from expected experience and other activity | |||||||||||||||||
| Adjusted balance, beginning of period | |||||||||||||||||
| Assessments collected(1) | |||||||||||||||||
| Interest accrual | |||||||||||||||||
| Benefits paid | ( | ( | |||||||||||||||
| Balance, excluding amounts in AOCI, end of period, pre-flooring | |||||||||||||||||
| Flooring impact and amounts in AOCI | ( | ( | |||||||||||||||
| Balance, including amounts in AOCI, end of period, post-flooring | |||||||||||||||||
| Less: Reinsurance recoverables | |||||||||||||||||
| Balance after reinsurance recoverables, including amounts in AOCI, end of period | $ | $ | |||||||||||||||
| Other | |||||||||||||||||
| Total balance after reinsurance recoverables | $ | ||||||||||||||||
| Year Ended December 31, 2023 | |||||||||||||||||
| Variable / Universal Life | Fixed Annuities | Total | |||||||||||||||
| (in thousands) | |||||||||||||||||
| Balance, including amounts in AOCI, beginning of period, post-flooring | $ | $ | $ | ||||||||||||||
| Flooring impact and amounts in AOCI | |||||||||||||||||
| Balance, excluding amounts in AOCI, beginning of period, pre-flooring | |||||||||||||||||
| Effect of assumption update | |||||||||||||||||
| Effect of actual variances from expected experience and other activity | |||||||||||||||||
| Adjusted balance, beginning of period | |||||||||||||||||
| Assessments collected(1) | |||||||||||||||||
| Interest accrual | |||||||||||||||||
| Benefits paid | ( | ( | |||||||||||||||
| Balance, excluding amounts in AOCI, end of period, pre-flooring | |||||||||||||||||
| Flooring impact and amounts in AOCI | ( | ( | |||||||||||||||
| Balance, including amounts in AOCI, end of period, post-flooring | |||||||||||||||||
| Less: Reinsurance recoverables | |||||||||||||||||
| Balance after reinsurance recoverables, including amounts in AOCI, end of period | $ | $ | |||||||||||||||
| Other | |||||||||||||||||
| Total balance after reinsurance recoverables | $ | ||||||||||||||||
(1) Represents the portion of gross assessments required to fund the future policy benefits.
(2) Includes the impact of recognizing the recapture of certain YRT transactions from Prudential Insurance effective October 1, 2025. See Note 12 for additional information.
75
PRUCO LIFE INSURANCE COMPANY
Notes to Consolidated Financial Statements—(Continued)
| Year Ended December 31, 2025 | |||||||||||
| Variable / Universal Life | Fixed Annuities | ||||||||||
| Weighted-average duration of the liability in years (at original discount rate) | |||||||||||
| Weighted-average interest rate (at original discount rate) | % | % | |||||||||
| Year Ended December 31, 2024 | |||||||||||
| Variable / Universal Life | Fixed Annuities | ||||||||||
| Weighted-average duration of the liability in years (at original discount rate) | N/A | ||||||||||
| Weighted-average interest rate (at original discount rate) | % | N/A | |||||||||
| Year Ended December 31, 2023 | |||||||||||
| Variable / Universal Life | Fixed Annuities | ||||||||||
| Weighted-average duration of the liability in years (at original discount rate) | N/A | ||||||||||
| Weighted-average interest rate (at original discount rate) | % | N/A | |||||||||
Future Policy Benefits Reconciliation
The following table presents the reconciliation of the ending balances from the above rollforwards, benefit reserves, DPL, and AIR, including other liabilities, gross of related reinsurance recoverables, to the total liability for future policy benefits as reported on the Company's Consolidated Statements of Financial Position for the years ended December 31,:
| 2025 | 2024 | 2023 | |||||||||||||||
| (in thousands) | |||||||||||||||||
| Benefit reserves, end of period, post-flooring | $ | $ | $ | ||||||||||||||
| Deferred profit liability, end of period, post-flooring | |||||||||||||||||
| Additional insurance reserves, including amounts in AOCI, end of period, post-flooring | |||||||||||||||||
| Subtotal of amounts disclosed above | |||||||||||||||||
| Other Future policy benefits reserves(1) | |||||||||||||||||
| Total Future policy benefits | $ | $ | $ | ||||||||||||||
(1)Primarily represents balances for which disaggregated rollforward disclosures are not required, including unpaid claims and claims expenses, and incurred but not reported and in course of settlement claim liabilities.
Revenue and Interest Expense
The following tables present revenue and interest expense related to benefit reserves, DPL, and AIR, as well as related revenue and interest expense not presented in the above supplemental tables, in the Company's Consolidated Statement of Operations for the periods indicated:
| Year Ended December 31, 2025 | |||||||||||||||||||||||
| Revenues(1) | |||||||||||||||||||||||
| Term Life | Variable / Universal Life | Fixed Annuities | Total | ||||||||||||||||||||
| (in thousands) | |||||||||||||||||||||||
| Benefit reserves | $ | $ | $ | $ | |||||||||||||||||||
| Deferred profit liability | ( | ( | |||||||||||||||||||||
| Additional insurance reserves | |||||||||||||||||||||||
| Total | $ | $ | $ | $ | |||||||||||||||||||
76
PRUCO LIFE INSURANCE COMPANY
Notes to Consolidated Financial Statements—(Continued)
| Year Ended December 31, 2024 | |||||||||||||||||||||||
| Revenues(1) | |||||||||||||||||||||||
| Term Life | Variable / Universal Life | Fixed Annuities | Total | ||||||||||||||||||||
| (in thousands) | |||||||||||||||||||||||
| Benefit reserves | $ | $ | $ | $ | |||||||||||||||||||
| Deferred profit liability | ( | ( | |||||||||||||||||||||
| Additional insurance reserves | |||||||||||||||||||||||
| Total | $ | $ | $ | $ | |||||||||||||||||||
| Year Ended December 31, 2023 | |||||||||||||||||||||||
| Revenues(1) | |||||||||||||||||||||||
| Term Life | Variable / Universal Life | Fixed Annuities | Total | ||||||||||||||||||||
| (in thousands) | |||||||||||||||||||||||
| Benefit reserves | $ | $ | $ | $ | |||||||||||||||||||
| Deferred profit liability | |||||||||||||||||||||||
| Additional insurance reserves | |||||||||||||||||||||||
| Total | $ | $ | $ | $ | |||||||||||||||||||
(1)Represents gross premiums for benefit reserves; revenue for DPL and gross assessments for AIR.
| Year Ended December 31, 2025 | |||||||||||||||||||||||
| Interest Expense | |||||||||||||||||||||||
| Term Life | Variable / Universal Life | Fixed Annuities | Total | ||||||||||||||||||||
| (in thousands) | |||||||||||||||||||||||
| Benefit reserves | $ | $ | $ | $ | |||||||||||||||||||
| Deferred profit liability | |||||||||||||||||||||||
| Additional insurance reserves | |||||||||||||||||||||||
| Total | $ | $ | $ | $ | |||||||||||||||||||
| Year Ended December 31, 2024 | |||||||||||||||||||||||
| Interest Expense | |||||||||||||||||||||||
| Term Life | Variable / Universal Life | Fixed Annuities | Total | ||||||||||||||||||||
| (in thousands) | |||||||||||||||||||||||
| Benefit reserves | $ | $ | $ | $ | |||||||||||||||||||
| Deferred profit liability | |||||||||||||||||||||||
| Additional insurance reserves | |||||||||||||||||||||||
| Total | $ | $ | $ | $ | |||||||||||||||||||
| Year Ended December 31, 2023 | |||||||||||||||||||||||
| Interest Expense | |||||||||||||||||||||||
| Term Life | Variable / Universal Life | Fixed Annuities | Total | ||||||||||||||||||||
| (in thousands) | |||||||||||||||||||||||
| Benefit reserves | $ | $ | $ | $ | |||||||||||||||||||
| Deferred profit liability | |||||||||||||||||||||||
| Additional insurance reserves | |||||||||||||||||||||||
| Total | $ | $ | $ | $ | |||||||||||||||||||
77
PRUCO LIFE INSURANCE COMPANY
Notes to Consolidated Financial Statements—(Continued)
10. POLICYHOLDERS' ACCOUNT BALANCES
The balances of and changes in policyholders' account balances as of and for the periods ended are as follows:
| Year Ended December 31, 2025 | |||||||||||||||||||||||||||||||||||
| Fixed Annuities | Variable Annuities | Variable / Universal Life | Total | ||||||||||||||||||||||||||||||||
| ($ in thousands) | |||||||||||||||||||||||||||||||||||
| Balance, beginning of period | $ | $ | $ | $ | |||||||||||||||||||||||||||||||
| Deposits | |||||||||||||||||||||||||||||||||||
| Interest credited | |||||||||||||||||||||||||||||||||||
| Policy charges | ( | ( | ( | ( | |||||||||||||||||||||||||||||||
| Surrenders and withdrawals | ( | ( | ( | ( | |||||||||||||||||||||||||||||||
| Benefit payments | ( | ( | ( | ( | |||||||||||||||||||||||||||||||
| Net transfers (to) from separate account | ( | ||||||||||||||||||||||||||||||||||
| Change in market value and other adjustments(1) | |||||||||||||||||||||||||||||||||||
| Balance, end of period | $ | $ | $ | $ | |||||||||||||||||||||||||||||||
| Unearned revenue reserve | |||||||||||||||||||||||||||||||||||
| Other | |||||||||||||||||||||||||||||||||||
| Total Policyholders' account balance | $ | ||||||||||||||||||||||||||||||||||
| Weighted-average crediting rate | % | % | % | % | |||||||||||||||||||||||||||||||
| Net amount at risk(3) | $ | $ | $ | $ | |||||||||||||||||||||||||||||||
| Cash surrender value(4) | $ | $ | $ | $ | |||||||||||||||||||||||||||||||
78
PRUCO LIFE INSURANCE COMPANY
Notes to Consolidated Financial Statements—(Continued)
| Year Ended December 31, 2024 | |||||||||||||||||||||||||||||||||||
| Fixed Annuities | Variable Annuities | Variable / Universal Life | Total | ||||||||||||||||||||||||||||||||
| ($ in thousands) | |||||||||||||||||||||||||||||||||||
| Balance, beginning of period | $ | $ | $ | $ | |||||||||||||||||||||||||||||||
| Deposits | |||||||||||||||||||||||||||||||||||
| Interest credited | |||||||||||||||||||||||||||||||||||
| Policy charges | ( | ( | ( | ( | |||||||||||||||||||||||||||||||
| Surrenders and withdrawals | ( | ( | ( | ( | |||||||||||||||||||||||||||||||
| Benefit payments | ( | ( | ( | ( | |||||||||||||||||||||||||||||||
| Net transfers (to) from separate account | |||||||||||||||||||||||||||||||||||
| Change in market value and other adjustments(1) | |||||||||||||||||||||||||||||||||||
| Balance, end of period | $ | $ | $ | $ | |||||||||||||||||||||||||||||||
| Unearned revenue reserve | |||||||||||||||||||||||||||||||||||
| Other | |||||||||||||||||||||||||||||||||||
| Total Policyholders' account balance | $ | ||||||||||||||||||||||||||||||||||
| Weighted-average crediting rate | % | % | % | % | |||||||||||||||||||||||||||||||
| Net amount at risk(3) | $ | $ | $ | $ | |||||||||||||||||||||||||||||||
| Cash surrender value(4) | $ | $ | $ | $ | |||||||||||||||||||||||||||||||
| Year Ended December 31, 2023 | |||||||||||||||||||||||||||||||||||
| Fixed Annuities | Variable Annuities | Variable / Universal Life | Total | ||||||||||||||||||||||||||||||||
| ($ in thousands) | |||||||||||||||||||||||||||||||||||
| Balance, beginning of period | $ | $ | $ | $ | |||||||||||||||||||||||||||||||
| Deposits | |||||||||||||||||||||||||||||||||||
| Interest credited | |||||||||||||||||||||||||||||||||||
| Policy charges | ( | ( | ( | ( | |||||||||||||||||||||||||||||||
| Surrenders and withdrawals | ( | ( | ( | ( | |||||||||||||||||||||||||||||||
| Benefit payments | ( | ( | ( | ( | |||||||||||||||||||||||||||||||
| Net transfers (to) from separate account(2) | |||||||||||||||||||||||||||||||||||
| Change in market value and other adjustments(1) | |||||||||||||||||||||||||||||||||||
| Balance, end of period | $ | $ | $ | $ | |||||||||||||||||||||||||||||||
| Unearned revenue reserve | |||||||||||||||||||||||||||||||||||
| Other | |||||||||||||||||||||||||||||||||||
| Total Policyholders' account balance | $ | ||||||||||||||||||||||||||||||||||
| Weighted-average crediting rate | % | % | % | % | |||||||||||||||||||||||||||||||
| Net amount at risk(3) | $ | $ | $ | $ | |||||||||||||||||||||||||||||||
| Cash surrender value(4) | $ | $ | $ | $ | |||||||||||||||||||||||||||||||
(1) Primarily relates to changes in the value of embedded derivative instruments associated with the indexed options of certain products.
(2) Variable life includes $900 million of funding for a policy loan to an affiliated irrevocable trust. See Note 16 for additional information.
(3) The net amount at risk calculation includes both general and separate account balances.
(4) Represents the amount of the contractholder's account balances distributable at the balance sheet date less certain surrender charges.
The Company issues variable life and universal life insurance contracts which may also include a “no-lapse guarantee” where the Company contractually guarantees to the contractholder a death benefit even when the account value drops to zero, as long as the “no-lapse guarantee” premium is paid.
79
PRUCO LIFE INSURANCE COMPANY
Notes to Consolidated Financial Statements—(Continued)
The net amount at risk is generally defined as the current death benefit in excess of the current account balance at the balance sheet date. The Company’s primary risk exposures for these contracts relates to actual deviations from, or changes to, the assumptions used in the original pricing of these products, including contractholder mortality, contract lapses, and premium pattern, as well as interest rate and equity market returns.
The Company also issues annuity contracts that provide certain death benefit and/or living benefit guarantees and are accounted for as MRBs. See Note 11 for additional information, including the net amount at risk associated with these guarantees.
The balance of account values by range of guaranteed minimum crediting rates and the related range of difference, in basis points ("bps"), between rates being credited to policyholders and the respective guaranteed minimums are as follows:
| December 31, 2025 | ||||||||||||||||||||||||||||||||
| Range of Guaranteed Minimum Crediting Rate(1) | At guaranteed minimum | Greater than | Total | |||||||||||||||||||||||||||||
| (in thousands) | ||||||||||||||||||||||||||||||||
| Fixed Annuities | ||||||||||||||||||||||||||||||||
Less than | $ | $ | $ | $ | $ | |||||||||||||||||||||||||||
Greater than | ||||||||||||||||||||||||||||||||
| Total | $ | $ | $ | $ | $ | |||||||||||||||||||||||||||
| Variable Annuities | ||||||||||||||||||||||||||||||||
Less than | $ | $ | $ | $ | $ | |||||||||||||||||||||||||||
Greater than | ||||||||||||||||||||||||||||||||
| Total | $ | $ | $ | $ | $ | |||||||||||||||||||||||||||
| Variable / Universal Life | ||||||||||||||||||||||||||||||||
Less than | $ | $ | $ | $ | $ | |||||||||||||||||||||||||||
Greater than | ||||||||||||||||||||||||||||||||
| Total | $ | $ | $ | $ | $ | |||||||||||||||||||||||||||
80
PRUCO LIFE INSURANCE COMPANY
Notes to Consolidated Financial Statements—(Continued)
| December 31, 2024 | ||||||||||||||||||||||||||||||||
| Range of Guaranteed Minimum Crediting Rate(1) | At guaranteed minimum | Greater than | Total | |||||||||||||||||||||||||||||
| (in thousands) | ||||||||||||||||||||||||||||||||
| Fixed Annuities | ||||||||||||||||||||||||||||||||
Less than | $ | $ | $ | $ | $ | |||||||||||||||||||||||||||
Greater than | ||||||||||||||||||||||||||||||||
| Total | $ | $ | $ | $ | $ | |||||||||||||||||||||||||||
| Variable Annuities | ||||||||||||||||||||||||||||||||
Less than | $ | $ | $ | $ | $ | |||||||||||||||||||||||||||
Greater than | ||||||||||||||||||||||||||||||||
| Total | $ | $ | $ | $ | $ | |||||||||||||||||||||||||||
| Variable / Universal Life | ||||||||||||||||||||||||||||||||
Less than | $ | $ | $ | $ | $ | |||||||||||||||||||||||||||
Greater than | ||||||||||||||||||||||||||||||||
| Total | $ | $ | $ | $ | $ | |||||||||||||||||||||||||||
81
PRUCO LIFE INSURANCE COMPANY
Notes to Consolidated Financial Statements—(Continued)
| December 31, 2023 | ||||||||||||||||||||||||||||||||
| Range of Guaranteed Minimum Crediting Rate(1) | At guaranteed minimum | Greater than | Total | |||||||||||||||||||||||||||||
| (in thousands) | ||||||||||||||||||||||||||||||||
| Fixed Annuities | ||||||||||||||||||||||||||||||||
Less than | $ | $ | $ | $ | $ | |||||||||||||||||||||||||||
Greater than | ||||||||||||||||||||||||||||||||
| Total | $ | $ | $ | $ | $ | |||||||||||||||||||||||||||
| Variable Annuities | ||||||||||||||||||||||||||||||||
Less than | $ | $ | $ | $ | $ | |||||||||||||||||||||||||||
Greater than | ||||||||||||||||||||||||||||||||
| Total | $ | $ | $ | $ | $ | |||||||||||||||||||||||||||
| Variable / Universal Life | ||||||||||||||||||||||||||||||||
Less than | $ | $ | $ | $ | $ | |||||||||||||||||||||||||||
Greater than | ||||||||||||||||||||||||||||||||
| Total | $ | $ | $ | $ | $ | |||||||||||||||||||||||||||
(1) Excludes contracts without minimum guaranteed crediting rates, such as funds with indexed-linked crediting options.
Unearned Revenue Reserve
The balances of and changes in URR as of and for the periods ended are as follows:
| Years Ended December 31, | |||||||||||||||||
| 2025 | 2024 | 2023 | |||||||||||||||
| Variable / Universal Life | |||||||||||||||||
| (in thousands) | |||||||||||||||||
| Balance, beginning of period | $ | $ | $ | ||||||||||||||
| Unearned revenue | |||||||||||||||||
| Amortization expense | ( | ( | ( | ||||||||||||||
| Other adjustments | ( | ( | |||||||||||||||
| Balance, end of period | $ | $ | $ | ||||||||||||||
82
PRUCO LIFE INSURANCE COMPANY
Notes to Consolidated Financial Statements—(Continued)
11. MARKET RISK BENEFITS
The following tables show a rollforward of MRB balances for variable and fixed annuity products, along with a reconciliation to the Company’s total net MRB positions as of the following dates:
| Year Ended December 31, 2025 | |||||||||||||||||||||||
| Variable Annuities | Fixed Annuities | Less: Reinsured Market Risk Benefits | Total, Net of Reinsurance | ||||||||||||||||||||
| (in thousands) | |||||||||||||||||||||||
| Balance, beginning of period | $ | $ | $ | ( | $ | ||||||||||||||||||
| Effect of cumulative changes in non-performance risk | |||||||||||||||||||||||
| Balance, beginning of period, before effect of changes in non-performance risk | ( | ||||||||||||||||||||||
| Attributed fees collected | ( | ||||||||||||||||||||||
| Claims paid | ( | ( | |||||||||||||||||||||
| Interest accrual | ( | ||||||||||||||||||||||
| Actual in force different from expected | ( | ( | |||||||||||||||||||||
| Effect of changes in interest rates | ( | ( | ( | ||||||||||||||||||||
| Effect of changes in equity markets | ( | ( | ( | ||||||||||||||||||||
| Effect of assumption update and other refinements | ( | ||||||||||||||||||||||
| Issuances | ( | ||||||||||||||||||||||
| Other adjustments | ( | ||||||||||||||||||||||
| Effect of changes in current period counterparty non-performance risk | ( | ( | |||||||||||||||||||||
| Balance, end of period, before effect of changes in non-performance risk | ( | ||||||||||||||||||||||
| Effect of cumulative changes in non-performance risk | ( | ( | |||||||||||||||||||||
| Balance, end of period | $ | $ | $ | ( | $ | ||||||||||||||||||
83
PRUCO LIFE INSURANCE COMPANY
Notes to Consolidated Financial Statements—(Continued)
| Year Ended December 31, 2024 | |||||||||||||||||||||||
| Variable Annuities | Fixed Annuities | Less: Reinsured Market Risk Benefits | Total, Net of Reinsurance | ||||||||||||||||||||
| (in thousands) | |||||||||||||||||||||||
| Balance, beginning of period | $ | $ | $ | ( | $ | ||||||||||||||||||
| Effect of cumulative changes in non-performance risk | |||||||||||||||||||||||
| Balance, beginning of period, before effect of changes in non-performance risk | ( | ||||||||||||||||||||||
| Attributed fees collected | ( | ||||||||||||||||||||||
| Claims paid | ( | ( | |||||||||||||||||||||
| Interest accrual | ( | ||||||||||||||||||||||
| Actual in force different from expected | ( | ||||||||||||||||||||||
| Effect of changes in interest rates | ( | ( | |||||||||||||||||||||
| Effect of changes in equity markets | ( | ( | |||||||||||||||||||||
| Effect of assumption update and other refinements(1) | |||||||||||||||||||||||
| Issuances | ( | ||||||||||||||||||||||
| Other adjustments(1) | ( | ( | |||||||||||||||||||||
| Effect of changes in current period counterparty non-performance risk | ( | ( | |||||||||||||||||||||
| Balance, end of period, before effect of changes in non-performance risk | ( | ||||||||||||||||||||||
| Effect of cumulative changes in non-performance risk | ( | ( | |||||||||||||||||||||
| Balance, end of period | $ | $ | $ | ( | $ | ||||||||||||||||||
84
PRUCO LIFE INSURANCE COMPANY
Notes to Consolidated Financial Statements—(Continued)
| Year Ended December 31, 2023 | |||||||||||||||||||||||
| Variable Annuities | Fixed Annuities | Less: Reinsured Market Risk Benefits | Total, Net of Reinsurance | ||||||||||||||||||||
| (in thousands) | |||||||||||||||||||||||
| Balance, beginning of period | $ | $ | $ | ( | $ | ||||||||||||||||||
| Effect of cumulative changes in non-performance risk | |||||||||||||||||||||||
| Balance, beginning of period, before effect of changes in non-performance risk | ( | ||||||||||||||||||||||
| Attributed fees collected | ( | ||||||||||||||||||||||
| Claims paid | ( | ( | |||||||||||||||||||||
| Interest accrual | ( | ||||||||||||||||||||||
| Actual in force different from expected | ( | ||||||||||||||||||||||
| Effect of changes in interest rates | ( | ( | |||||||||||||||||||||
| Effect of changes in equity markets | ( | ( | |||||||||||||||||||||
| Effect of assumption update and other refinements(1) | ( | ||||||||||||||||||||||
| Issuances | |||||||||||||||||||||||
| Other adjustments(1)(2) | ( | ( | |||||||||||||||||||||
| Effect of changes in current period counterparty non-performance risk | ( | ( | |||||||||||||||||||||
| Balance, end of period, before effect of changes in non-performance risk | ( | ||||||||||||||||||||||
| Effect of cumulative changes in non-performance risk | ( | ( | |||||||||||||||||||||
| Balance, end of period | $ | $ | $ | ( | $ | ||||||||||||||||||
(1) Prior period amounts have been updated to conform to current presentation.
(2) Other adjustments for December 31, 2023 primarily includes $638 million related to the reinsurance transaction with AuguStar. See Note 12 for additional information.
In 2025, 2024, and 2023, the Company recognized an unfavorable impact to net income attributable to the actuarial assumption update for direct and assumed MRBs, primarily due to updates to policyholder behavior assumptions.
The Company issues certain variable annuity insurance contracts where the Company contractually guarantees to the contractholder a return of no less than (1) total deposits made to the contract adjusted for any partial withdrawals plus a minimum return, and/or (2) the highest anniversary contract value on a specified date adjusted for any withdrawals. These guarantees include benefits that are payable in the event of death, annuitization or at specified dates during the accumulation period and withdrawal and income benefits payable during specified periods.
The Company also issues indexed annuity contracts for which the return is tied to the return of specific indices where the Company contractually guarantees to the contractholder a return of no less than total deposits made to the contract adjusted for any partial withdrawals upon death. In certain of these indexed annuity contracts, the Company also contractually guarantees to the contractholder withdrawal benefits payable during specific periods.
For guarantees of benefits that are payable in the event of death, the net amount at risk is generally defined as the current guaranteed minimum death benefit in excess of the current account balance at the balance sheet date. The Company’s primary risk exposures for these contracts relates to actual deviations from, or changes to, the assumptions used in the original pricing of these products, including fixed income and equity market returns, contract lapses and contractholder mortality.
For guarantees of benefits that are payable at annuitization, the net amount at risk is generally defined as the present value of the minimum guaranteed annuity payments available to the contractholder determined in accordance with the terms of the contract in excess of the current account balance. The Company’s primary risk exposures for these contracts relates to actual deviations from, or changes to, the assumptions used in the original pricing of these products, including fixed income and equity market returns, timing of annuitization, contract lapses and contractholder mortality.
85
PRUCO LIFE INSURANCE COMPANY
Notes to Consolidated Financial Statements—(Continued)
For guarantees of benefits that are payable at withdrawal, the net amount at risk is generally defined as the present value of the minimum guaranteed withdrawal payments available to the contractholder determined in accordance with the terms of the contract in excess of the current account balance.
For guarantees of accumulation balances, the net amount at risk is generally defined as the guaranteed minimum accumulation balance minus the current account balance. The Company’s primary risk exposures for these contracts relates to actual deviations from, or changes to, the assumptions used in the original pricing of these products, including equity market returns, interest rates, market volatility and contractholder behavior.
The following tables present accompanying information to the rollforward table above.
| December 31, 2025 | |||||||||||
| Variable Annuities | Fixed Annuities | ||||||||||
| ($ in thousands) | |||||||||||
| Net amount at risk(1) | $ | $ | |||||||||
| Weighted-average attained age of contractholders | |||||||||||
| December 31, 2024 | |||||||||||
| Variable Annuities | Fixed Annuities | ||||||||||
| ($ in thousands) | |||||||||||
| Net amount at risk(1) | $ | N/A | |||||||||
| Weighted-average attained age of contractholders | N/A | ||||||||||
| December 31, 2023 | |||||||||||
| Variable Annuities | Fixed Annuities | ||||||||||
| ($ in thousands) | |||||||||||
| Net amount at risk(1) | $ | N/A | |||||||||
| Weighted-average attained age of contractholders | N/A | ||||||||||
(1) For contracts with multiple benefit features, the highest net amount at risk for each contract is included.
The tables below reconciles MRB asset and liability positions as of the following dates:
| December 31, 2025 | |||||||||||||||||
| Variable Annuities | Fixed Annuities | Total | |||||||||||||||
| (in thousands) | |||||||||||||||||
| Direct and assumed | $ | $ | $ | ||||||||||||||
| Ceded | |||||||||||||||||
| Total market risk benefit assets | $ | $ | $ | ||||||||||||||
| Direct and assumed | $ | $ | $ | ||||||||||||||
| Ceded | |||||||||||||||||
| Total market risk benefit liabilities | $ | $ | $ | ||||||||||||||
| Net liability | $ | $ | $ | ||||||||||||||
86
PRUCO LIFE INSURANCE COMPANY
Notes to Consolidated Financial Statements—(Continued)
| December 31, 2024 | |||||||||||||||||
| Variable Annuities | Fixed Annuities | Total | |||||||||||||||
| (in thousands) | |||||||||||||||||
| Direct and assumed | $ | $ | $ | ||||||||||||||
| Ceded | |||||||||||||||||
| Total market risk benefit assets | $ | $ | $ | ||||||||||||||
| Direct and assumed | $ | $ | $ | ||||||||||||||
| Ceded | |||||||||||||||||
| Total market risk benefit liabilities | $ | $ | $ | ||||||||||||||
| Net liability | $ | $ | $ | ||||||||||||||
| December 31, 2023 | |||||||||||||||||
| Variable Annuities | Fixed Annuities | Total | |||||||||||||||
| (in thousands) | |||||||||||||||||
| Direct and assumed | $ | $ | $ | ||||||||||||||
| Ceded | |||||||||||||||||
| Total market risk benefit assets | $ | $ | $ | ||||||||||||||
| Direct and assumed | $ | $ | $ | ||||||||||||||
| Ceded | |||||||||||||||||
| Total market risk benefit liabilities | $ | $ | $ | ||||||||||||||
| Net liability | $ | $ | $ | ||||||||||||||
87
PRUCO LIFE INSURANCE COMPANY
Notes to Consolidated Financial Statements—(Continued)
12. REINSURANCE
The Company participates in reinsurance with its affiliates Prudential Arizona Reinsurance Captive Company (“PARCC”), PAR U, PURE, Lotus Reinsurance Company Ltd. (“Lotus Re”), The Prudential Life Insurance Company, Ltd. (“Prudential of Japan”), prior to January 1, 2024 with its affiliates Prudential Universal Reinsurance Company (“PURC”) and Gibraltar Universal Life Reinsurance Company (“GUL Re”), and prior to October 1, 2024 with its affiliates Prudential Arizona Reinsurance Term Company (“PAR Term”), Prudential Term Reinsurance Company (“Term Re”) and Dryden Arizona Reinsurance Term Company (“DART”). The Company also participates in reinsurance with its parent company Prudential Insurance, as well as third-parties. The reinsurance agreements provide risk diversification and additional capacity for future growth, limit the maximum net loss potential, manage statutory capital, and facilitate the Company's capital market hedging program. Life reinsurance is accomplished through various plans of reinsurance, primarily YRT and coinsurance. Reinsurance ceded arrangements do not discharge the Company as the primary insurer. Ceded balances would represent a liability of the Company in the event the reinsurers were unable to meet their obligations to the Company under the terms of the reinsurance agreements. The Company believes a material reinsurance liability resulting from such inability of reinsurers to meet their obligations is unlikely.
Effective October 2024, the Company entered into an agreement with Wilton Reassurance Company and Wilton Reinsurance Bermuda Limited (collectively, “Wilton Re”) to coinsure a closed block of guaranteed universal life (“GUL”) policies, resulting in a DRL of $979 million. To effectuate this transaction the Company recaptured all risks associated with the subject GUL policies from PAR U and subsequently established YRT reinsurance for the subject GUL business with Prudential Insurance. As a result of these transactions, the Company recognized a $270 million pre-tax recapture gain and a $798 million DRG, respectively. The DRL and DRG are amortized into income over the remaining life of the reinsured policies. Effective October 1, 2025, the Company recaptured the YRT treaties with Prudential Insurance and subsequently established YRT reinsurance for the business with third-party reinsurers. The Company immediately recognized a $768 million gain from the recognition of the existing DRG from the previous YRT transaction with Prudential Insurance.
Effective January 2024, the Company entered into an agreement with Somerset Reinsurance Ltd. (“Somerset Re”) to coinsure a closed block of GUL policies to PURE, a wholly-owned subsidiary of Prudential Insurance, with retrocession by PURE of such liabilities on a modified coinsurance basis, to Somerset Re. This transaction is effective as of January 1, 2024, whereby, the Company recaptured all risks associated with the subject GUL policies from PAR U, PURC and GUL Re and subsequently established YRT reinsurance for the subject GUL business with Prudential Insurance. As a result of these transactions, the Company recognized a $990 million pre-tax recapture loss and a $1,207 million DRG, respectively. The DRG is amortized into income over the estimated remaining life of the reinsured policies. Effective October 1, 2025, the Company recaptured certain YRT treaties with Prudential Insurance and subsequently established YRT reinsurance for the business with third-party reinsurers. The Company immediately recognized a $629 million gain from the recognition of the existing DRG from the previous YRT transaction with Prudential Insurance.
Reserves related to reinsured long-duration contracts are accounted for using assumptions consistent with those used to account for the underlying contracts. Amounts recoverable from reinsurers for long-duration reinsurance arrangements are estimated in a manner consistent with the claim liabilities and policy benefits associated with the reinsured policies. Reinsurance policy charges and fee income ceded for universal life and variable annuity products are accounted for as a reduction of policy charges and fee income. Reinsurance premiums ceded for term insurance products are accounted for as a reduction of premiums.
Reinsurance agreements that do not expose the Company to a reasonable possibility of a significant loss from insurance risk are recorded using the deposit method of accounting. The deposit assets on reinsurance are recorded within “Reinsurance recoverables and deposit receivables” and the corresponding funds withheld liability for assets retained under these reinsurance agreements are recorded within “Reinsurance and funds withheld payables”. Balances associated with these agreements are included in the tables below.
“Change in value of market risk benefits, net of related hedging gains (losses)” includes the impact of reinsurance agreements, particularly reinsurance agreements involving living benefit guarantees. The Company has entered into reinsurance agreements to transfer the risk related to the living benefit guarantees on variable annuities within the PLNJ business to Prudential Insurance. These reinsurance agreements are MRBs and have been accounted for in the same manner.
88
PRUCO LIFE INSURANCE COMPANY
Notes to Consolidated Financial Statements—(Continued)
Reinsurance amounts included in the Company’s Consolidated Statements of Financial Position as of December 31, were as follows:
| 2025 | 2024 | ||||||||||
| (in thousands) | |||||||||||
| Reinsurance recoverables and deposit receivables | $ | $ | |||||||||
| Policy loans | ( | ( | |||||||||
| Deferred policy acquisition costs | ( | ( | |||||||||
| Deferred sales inducements | ( | ( | |||||||||
| Market risk benefit assets | |||||||||||
| Other assets | |||||||||||
| Policyholders’ account balances | |||||||||||
| Future policy benefits | |||||||||||
| Market risk benefit liabilities | |||||||||||
| Reinsurance and funds withheld payables | |||||||||||
| Other liabilities | |||||||||||
Unaffiliated reinsurance amounts included in the table above and in the Company's Consolidated Statements of Financial Position as of December 31, were as follows:
| 2025 | 2024 | ||||||||||
| (in thousands) | |||||||||||
| Policy loans | $ | ( | $ | ( | |||||||
| Deferred policy acquisition costs | ( | ( | |||||||||
| Market risk benefit assets | |||||||||||
| Other assets | |||||||||||
| Policyholders’ account balances | |||||||||||
| Future policy benefits | ( | ||||||||||
| Market risk benefit liabilities | |||||||||||
| Reinsurance and funds withheld payables | |||||||||||
| Other liabilities | |||||||||||
89
PRUCO LIFE INSURANCE COMPANY
Notes to Consolidated Financial Statements—(Continued)
Reinsurance recoverables and deposit receivables by counterparty as of December 31, were as follows:
| 2025 | 2024 | ||||||||||
| (in thousands) | |||||||||||
| Affiliated: | |||||||||||
| PAR U | $ | $ | |||||||||
| PURE | |||||||||||
| PARCC | |||||||||||
| Lotus Re | |||||||||||
| Prudential Insurance | |||||||||||
| Prudential of Japan | |||||||||||
| Total affiliated | |||||||||||
| Unaffiliated: | |||||||||||
| Wilton Re | |||||||||||
| Somerset Re | |||||||||||
| FLIAC | |||||||||||
| Resolution Re | |||||||||||
| Prismic Re | |||||||||||
| Other(1) | |||||||||||
| Total unaffiliated | |||||||||||
| Total reinsurance recoverables and deposit receivables | $ | $ | |||||||||
(1) Four major reinsurance companies account for approximately 56 % of Other as of December 31, 2025.
Reinsurance amounts, included in the Company’s Consolidated Statements of Operations and Comprehensive Income (Loss) for the years ended December 31, were as follows:
| 2025 | 2024 | 2023 | |||||||||||||||
| (in thousands) | |||||||||||||||||
| Premiums: | |||||||||||||||||
| Direct | $ | $ | $ | ||||||||||||||
| Assumed | ( | ||||||||||||||||
| Ceded | ( | ( | ( | ||||||||||||||
| Net premiums | $ | $ | $ | ||||||||||||||
| Policy charges and fee income: | |||||||||||||||||
| Direct | $ | $ | $ | ||||||||||||||
| Assumed | |||||||||||||||||
| Ceded | ( | ( | |||||||||||||||
| Net policy charges and fee income | $ | $ | $ | ||||||||||||||
90
PRUCO LIFE INSURANCE COMPANY
Notes to Consolidated Financial Statements—(Continued)
| 2025 | 2024 | 2023 | |||||||||||||||
| (in thousands) | |||||||||||||||||
| Net investment income: | |||||||||||||||||
| Direct | $ | $ | $ | ||||||||||||||
| Assumed | |||||||||||||||||
| Ceded | ( | ( | ( | ||||||||||||||
| Net investment income(1) | $ | $ | $ | ||||||||||||||
| Asset administration fees: | |||||||||||||||||
| Direct | $ | $ | $ | ||||||||||||||
| Ceded | ( | ( | ( | ||||||||||||||
| Net asset administration fees | $ | $ | $ | ||||||||||||||
| Other income (loss): | |||||||||||||||||
| Direct | $ | $ | $ | ||||||||||||||
| Assumed | ( | ||||||||||||||||
| Ceded | |||||||||||||||||
| Net other income (loss)(1) | $ | $ | $ | ||||||||||||||
| Realized investment gains (losses), net: | |||||||||||||||||
| Direct | $ | ( | $ | $ | ( | ||||||||||||
| Assumed | |||||||||||||||||
| Ceded | ( | ( | ( | ||||||||||||||
| Realized investment gains (losses), net(1) | $ | ( | $ | $ | ( | ||||||||||||
| Change in value of market risk benefits, net of related hedging gains (losses): | |||||||||||||||||
| Direct | $ | ( | $ | ( | $ | ||||||||||||
| Assumed | ( | ||||||||||||||||
| Ceded | ( | ( | ( | ||||||||||||||
| Net change in value of market risk benefits, net of related hedging gains (losses) | $ | ( | $ | ( | $ | ( | |||||||||||
| Policyholders’ benefits (including change in reserves): | |||||||||||||||||
| Direct | $ | $ | $ | ||||||||||||||
| Assumed | |||||||||||||||||
| Ceded | ( | ( | |||||||||||||||
| Net policyholders’ benefits (including change in reserves)(1) | $ | $ | $ | ||||||||||||||
| Change in estimates of liability for future policy benefits: | |||||||||||||||||
| Direct | $ | ( | $ | $ | ( | ||||||||||||
| Assumed | ( | ||||||||||||||||
| Ceded | ( | ||||||||||||||||
| Net change in estimates of liability for future policy benefits | $ | ( | $ | ( | $ | ||||||||||||
| Interest credited to policyholders’ account balances: | |||||||||||||||||
| Direct | $ | $ | $ | ||||||||||||||
| Assumed | |||||||||||||||||
| Ceded | ( | ( | ( | ||||||||||||||
| Net interest credited to policyholders’ account balances | $ | $ | $ | ||||||||||||||
| Reinsurance expense allowances and general and administrative expenses, net of capitalization and amortization | $ | ( | $ | ( | $ | ( | |||||||||||
(1)Amounts include reinsurance agreements using the deposit method of accounting.
91
PRUCO LIFE INSURANCE COMPANY
Notes to Consolidated Financial Statements—(Continued)
Unaffiliated reinsurance assumed and ceded amounts included in the table above and in the Company's Consolidated Statements of Operations and Comprehensive Income (Loss) for the years ended December 31, were as follows:
| 2025 | 2024 | 2023 | |||||||||||||||
| (in thousands) | |||||||||||||||||
| Premiums: | |||||||||||||||||
| Assumed | $ | $ | $ | ( | |||||||||||||
| Ceded | ( | ( | ( | ||||||||||||||
| Policy charges and fee income: | |||||||||||||||||
| Assumed | |||||||||||||||||
| Ceded | ( | ( | ( | ||||||||||||||
| Net investment income(1): | |||||||||||||||||
| Ceded | ( | ( | |||||||||||||||
| Asset administration fees: | |||||||||||||||||
| Ceded | ( | ( | ( | ||||||||||||||
| Other income (loss)(1): | |||||||||||||||||
| Assumed | ( | ||||||||||||||||
| Ceded | |||||||||||||||||
| Realized investment gains (losses), net(1): | |||||||||||||||||
| Assumed | |||||||||||||||||
| Ceded | ( | ( | ( | ||||||||||||||
| Change in value of market risk benefits, net of related hedging gains (losses): | |||||||||||||||||
| Assumed | ( | ||||||||||||||||
| Ceded | ( | ( | |||||||||||||||
| Policyholders' benefits (including change in reserves)(1): | |||||||||||||||||
| Assumed | ( | ||||||||||||||||
| Ceded | ( | ( | ( | ||||||||||||||
| Change in estimates of liability for future policy benefits: | |||||||||||||||||
| Assumed | |||||||||||||||||
| Ceded | ( | ( | |||||||||||||||
| Interest credited to policyholders' account balances: | |||||||||||||||||
| Assumed | |||||||||||||||||
| Ceded | ( | ( | |||||||||||||||
(1)Amounts include reinsurance agreements using the deposit method of accounting.
92
PRUCO LIFE INSURANCE COMPANY
Notes to Consolidated Financial Statements—(Continued)
The gross and net amounts of life insurance face amount in force as of December 31, were as follows:
| 2025 | 2024 | 2023 | |||||||||||||||
| (in thousands) | |||||||||||||||||
| Direct gross life insurance face amount in force | $ | $ | $ | ||||||||||||||
| Assumed gross life insurance face amount in force | |||||||||||||||||
| Reinsurance ceded | ( | ( | ( | ||||||||||||||
| Net life insurance face amount in force | $ | $ | $ | ||||||||||||||
Significant Affiliated Reinsurance Agreements
PAR U
Pruco Life reinsures 70 % of the risks associated with Universal Protector policies having no-lapse guarantees as well as certain other universal life policies, with effective dates prior to January 1, 2011.
Effective July 1, 2012, PLNJ reinsures 95 % of the risks associated with Universal Protector policies having no-lapse guarantees as well as certain other universal life policies, with effective dates through December 31, 2019, excluding those policies that are subject to principle-based reserving.
On January 2, 2013, Pruco Life began to assume GUL business from Prudential Insurance in connection with the acquisition of the Hartford Life Business. The GUL business assumed from Prudential Insurance was subsequently retroceded to PAR U.
Effective January 1, 2024, Pruco Life recaptured the policies equal to 70 % of the risks associated with Universal Protector policies having no-lapse guarantees as well as certain other universal life policies, with effective dates prior to January 1, 2011. Effective January 1, 2024, Pruco Life reinsures 25 % of the risks associated with universal life policies with effective dates prior to January 1, 2015 and 100 % of the risks associated with universal life policies with effective dates beginning January 1, 2015.
Effective January 1, 2024, PLNJ recaptured the policies previously reinsured by PAR U with effective dates prior to January 1, 2015. Effective January 1, 2024, PLNJ reinsures 100 % of the risks associated with universal life policies, with effective dates from January 1, 2015 to December 31, 2019.
Effective October 1, 2024, Pruco Life recaptured the remaining portion of the policies equal to 25 % of the risks associated with universal life policies with effective dates prior to January 1, 2015 and 100 % of the risks associated with universal life policies with effective dates beginning January 1, 2015. As a result of the recapture, the Company recognized a $270 million pre-tax recapture gain, as discussed above, which includes the recognition of a prior $94 million DRG related to the previous reinsurance agreement. Following the result of this recapture, Pruco Life only cedes the GUL business in connection with the Hartford Life Business to PAR U as of December 31, 2024.
Effective October 1, 2024, PLNJ recaptured 100 % of the risks associated with the remaining universal life policies, with effective dates from January 1, 2015 to December 31, 2019. As a result of the recapture, the Company recognized a $29 million pre-tax recapture loss which is part of the $270 million pre-tax recapture gain discussed above. The loss includes the recognition of a prior $8 million DRG related to the previous reinsurance agreement. Following the result of this recapture, PLNJ no longer cedes to PAR U as of December 31, 2024.
On March 28, 2024, PURC and GUL Re merged into PAR U.
PURE
Effective January 1, 2024, Pruco Life reinsures 75 % of the risks associated with Universal Protector policies having no-lapse guarantees as well as certain other universal life policies, with effective dates prior to January 1, 2015.
Effective January 1, 2024, PLNJ reinsures 100 % of the risks associated with Universal Protector policies having no-lapse guarantees as well as certain other universal life policies, with effective dates prior to January 1, 2015.
93
PRUCO LIFE INSURANCE COMPANY
Notes to Consolidated Financial Statements—(Continued)
PURC
Pruco Life reinsures 70 % of the risks associated with its Universal Protector policies having no-lapse guarantees as well as certain other universal life policies, with effective dates from January 1, 2011 through December 31, 2013, with PURC and 95 % of the risks associated with Universal Protector policies having no-lapse guarantees, as well as certain other universal life policies, with effective dates from January 1, 2014 through December 31, 2016.
Effective January 1, 2024, the Company recaptured the policies previously reinsured by PURC. As a result of the recapture, the Company recorded a write-off of $116 million of DRG that was recognized with the previous reinsurance agreement.
On March 28, 2024, PURC merged into PAR U.
PARCC
Prior to July 1, 2019, the Company reinsured 90 % of the risks under its term life insurance policies, with effective dates prior to January 1, 2010 through an automatic coinsurance agreement with PARCC. Effective July 1, 2019, the Company amended the coinsurance agreement to increase the percentage from 90 % to 100 % of the policy risk amount reinsured. The amended agreement does not impact contracts issued by PLNJ, which remain at the original percentage.
Effective October 1, 2024, the Company revised the existing coinsurance terms with PARCC, increasing the quota share of reinsured policies to 100 % which includes policies which were previously reinsured to PAR Term, Term Re and DART. As a result of the revised terms, the Company recognized a $351 million DRL that is amortized into income over the estimated remaining life of the reinsured policies.
On November 20, 2024, PAR Term, Term Re and DART merged into PARCC.
GUL Re
Effective January 1, 2017, Pruco Life entered into an automatic coinsurance agreement with GUL Re to reinsure 95 % of the risks associated with Universal Protector policies having no-lapse guarantees, as well as certain other universal life policies, with effective dates on or after January 1, 2017 through December 31, 2019, excluding those policies that are subject to principle-based reserving.
Effective July 1, 2017, Pruco Life amended this agreement to include 30 % of Universal Protector policies having no-lapse guarantees as well as certain other universal life policies with effective dates prior to January 1, 2014.
Effective January 1, 2024, the Company recaptured the policies previously reinsured by GUL Re.
On March 28, 2024, GUL Re merged into PAR U.
PAR Term
Prior to July 1, 2019, the Company reinsures 95 % of the risks under its term life insurance policies with effective dates January 1, 2010 through December 31, 2013, through an automatic coinsurance agreement with PAR Term. Effective July 1, 2019, the Company amended the coinsurance agreement to increase the percentage from 95 % to 100 % of the policy risk amount reinsured. The amended agreement does not impact contracts issued by PLNJ, which remain at the original percentage.
On November 20, 2024, PAR Term merged into PARCC.
Term Re
The Company reinsures 95 % of the risks under its term life insurance policies, with effective dates on or after January 1, 2014 through December 31, 2017, through an automatic coinsurance agreement with Term Re.
On November 20, 2024, Term Re merged into PARCC.
On November 20, 2024, Term Re merged into PARCC.
94
PRUCO LIFE INSURANCE COMPANY
Notes to Consolidated Financial Statements—(Continued)
Prudential Insurance
The Company has a YRT reinsurance agreement with Prudential Insurance and reinsures the majority of all mortality risks not otherwise reinsured. This agreement was terminated for new business effective January 1, 2020, with certain new business (primarily universal life policies) terminated as early as 2017. The Company now reinsures a portion of the mortality risk directly to third-party reinsurers and retains all of the non-reinsured portion of the mortality risk. Effective July 1, 2019, certain term life insurance policies were recaptured and subsequently reinsured to PARCC and PAR Term as noted above. As of January 1, 2022, most of the variable life insurance policies were recaptured resulting in a $305 million loss recorded through “Policy charges and fee income”. Those policies were then reinsured to Lotus Re as mentioned below. Effective January 1, 2024, the Company recaptured all GUL policies with Prudential Insurance and subsequently entered into a YRT reinsurance agreement with Prudential Insurance to reinsure the mortality risk for the totality of GUL policies reinsured to PURE. Effective October 1, 2024, the Company recaptured the term business from Prudential Insurance, and revised the existing coinsurance terms with PARCC to reflect revised quota share. As a result of the recapture, the Company recognized a $3 million pre-tax recapture loss. Additionally, effective October 1, 2024, the Company entered into a YRT reinsurance agreement with Prudential Insurance to reinsure the mortality risk of recaptured GUL policies from PAR U.
Effective October 1, 2025, Prudential Insurance novated several unaffiliated YRT treaties to Pruco Life. To effectuate the novation of YRT treaties, Pruco Life entered into certain new YRT pass-through agreements with Prudential Insurance and recaptured certain YRT treaties it had ceded to Prudential Insurance, including those related to reinsurance transactions effective January 2024 and October 2024 with Somerset Re and Wilton Re, respectively.
Effective October 1, 2025, Prudential Insurance novated several unaffiliated YRT treaties to Pruco Life. To effectuate the novation of YRT treaties, Pruco Life entered into certain new YRT pass-through agreements with Prudential Insurance and recaptured certain YRT treaties it had ceded to Prudential Insurance, including those related to reinsurance transactions effective January 2024 and October 2024 with Somerset Re and Wilton Re, respectively.
On January 2, 2013, Pruco Life began to assume GUL business from Prudential Insurance in connection with the acquisition of the Hartford Financial Services Group, Inc. (“Hartford Financial”). The GUL business assumed from Prudential Insurance was subsequently retroceded to PAR U. In May 2018, Hartford Financial sold a group of operating subsidiaries, which includes two of Prudential Insurance's counterparties to these reinsurance arrangements. There was no impact to the terms, rights or obligations of Prudential Insurance, or operation of these reinsurance arrangements, as a result of this change in control of such counterparties. Similarly, there was no impact to the Company's reinsurance arrangements with respect to such GUL business as a result of this change in control. In January 2021, there was a definitive agreement announced to subsequently sell the two counterparties mentioned above, which were then acquired by Sixth Street in July 2021. There was no impact to the terms, rights or obligations of the Company, or operation of these reinsurance arrangements, as a result of this change in control of such counterparties.
The Company has reinsured a group annuity contract with Prudential Insurance, in consideration for a single premium payment by the Company, providing reinsurance equal to 100 % of payments due under the contract.
Effective April 1, 2016, PLNJ entered into a reinsurance agreement to reinsure its variable annuity base contracts, along with the living benefit guarantees to Prudential Insurance. This reinsurance agreement covers new and in force business. Effective February 1, 2023, PLNJ began selling indexed variable annuities products, which is reinsured to Prudential Insurance through the existing reinsurance agreement. The reinsurance of the indexed variable annuities transfers all significant risks, including mortality risk, embedded in the reinsured contracts to Prudential Insurance. As a result of the agreement, reinsurance payables includes the ceded modified coinsurance arrangement, which reflects the value of the invested assets retained by the Company and the associated asset returns.
Lotus Re
Effective October 1, 2021, the Company entered into an automatic coinsurance agreement with Lotus Re to reinsure $32 million of liabilities associated with the risks associated with a portion of its variable life policies in the extended term policy status.
Effective January 1, 2022 the Company recaptured the risks that were previously ceded to Lotus Re from October 1, 2021 through December 31, 2021. Immediately thereafter, the Company entered into a reinsurance agreement with Lotus Re to cede 100 % of the risks associated with a closed block of variable life business on a coinsurance and modified coinsurance basis including policies in the extended term policy status. The amount of the net liabilities associated with the transaction for coinsurance and modified coinsurance were $1,387 million and $14,037 million, respectively. As part of the consideration, the Company also ceded to Lotus Re $855 million of policy loan assets associated with the reinsured policies while receiving $820 million in cash from Lotus Re. As a result, the Company recorded a $1,352 million deferred gain, which is recognized over the remaining life of the underlying policies. In tandem with the transaction, effective January 1, 2022, Lotus Re established an automatic YRT agreement with the Company to cede back a portion of the mortality risks associated with the reinsured policies for the purposes of the Company maintaining YRT reinsurance with external counterparties.
95
PRUCO LIFE INSURANCE COMPANY
Notes to Consolidated Financial Statements—(Continued)
Effective December 15, 2024, the Company entered into a reinsurance agreement with Lotus Re to cede 100 % of the risks associated with certain fixed rated annuities and fixed indexed annuities contracts issued on or after the effective date of the agreement on a coinsurance basis. The deposit receivables were $1,311 million and $52 million as of December 31, 2025 and December 31, 2024, respectively.
DART
Effective January 1, 2018, the Company entered into an automatic coinsurance agreement with DART to reinsure 95 % of the risks associated with its term life insurance policies with effective dates on or after January 1, 2018 through December 31, 2019, excluding those policies that are subject to principle-based reserving.
On November 20, 2024, DART merged into PARCC.
Prudential of Japan
Prudential of Japan
Effective January 2025, the Company entered into an agreement with Prudential of Japan to reinsure GMDB associated with yen-denominated variable whole life policies. As a result of this transaction, the Company assumed $5 million of GMDB liabilities and recognized a $14 million DRG at inception. The DRG is amortized into income over the estimated remaining life of the reinsured policies.
Significant Third-Party Reinsurance Arrangements
AuguStar Life Insurance Company (Formerly Known as The Ohio National Life Insurance Company)
Effective April 1, 2023, the Company entered into an agreement with AuguStar, an affiliate of Constellation Insurance Holdings, Inc., to reinsure approximately $10 billion of account values of PDI traditional variable annuity contracts with guaranteed living benefits. This block represents approximately 10 % of the Company’s remaining legacy in force traditional variable annuity block by account value. The Company ceded 100 % of separate account liabilities under modified coinsurance and 100 % of general account liabilities under coinsurance of its PDI traditional variable annuity contracts. The general account liabilities associated with PDI's guaranteed living and death benefits and the corresponding reinsurance of those liabilities are accounted for as MRBs. As a result of the transaction, the Company recognized a $277 million DRG at inception that is amortized into income over the estimated remaining life of the reinsured policies.
FLIAC
Effective December 1, 2021, the Company entered into a reinsurance agreement with Prudential Annuities Life Assurance Corporation (“PALAC”), a previously wholly-owned subsidiary of Prudential Financial sold in April 2022, and now known as FLIAC, under which the Company assumed all of FLIAC's indexed variable annuities under modified coinsurance. The reinsurance of the indexed variable annuities transfers all significant risks, including mortality risk, embedded in the reinsured contracts to the Company. As a result of the agreement, “Reinsurance recoverables and deposit receivables” includes the assumed modified coinsurance receivable, which reflects the value of the invested assets retained by FLIAC and the associated asset returns. The Company also assumed via coinsurance all of FLIAC’s fixed indexed annuities and fixed annuities with a guaranteed lifetime withdrawal income feature which are accounted for under the deposit method of accounting. The reinsurance agreement offers the policyholders the opportunity to novate their contracts from FLIAC to the Company and any such novated contracts shall cease to be reinsured under this agreement. Reinsurance recoverables and deposit receivables were $1,351 million and $1,395 million as of December 31, 2025 and 2024, respectively.
Somerset Re
Effective October 1, 2021, the Company entered into a reinsurance agreement with Somerset Re to coinsure business, on a quota share funds withheld basis, related to fixed indexed annuities. Under the reinsurance agreement, the Company cedes to Somerset Re its quota share of the insurance liabilities with respect to the reinsured contracts. The deposit assets on reinsurance totaled $2,491 million and $2,582 million at December 31, 2025 and 2024, respectively. The funds withheld payables totaled $2,602 million and $2,434 million at December 31, 2025 and 2024, respectively.
96
PRUCO LIFE INSURANCE COMPANY
Notes to Consolidated Financial Statements—(Continued)
Union Hamilton
Between April 1, 2015 and December 31, 2016, the Company, excluding its subsidiary, reinsured approximately 50 % of the new business related to “highest daily” living benefits rider guarantees on HDI v.3.0 product, available with Prudential Premier® Retirement Variable Annuity, to Union Hamilton. This reinsurance remains in force for the duration of the underlying annuity contracts. New sales of HDI v.3.0 subsequent to December 31, 2016 are not covered by this external reinsurance agreement. As of December 31, 2025, $1.6 billion of HDI v.3.0 account values are reinsured to Union Hamilton.
Wilton Re
Effective October 1, 2024, the Company entered into a reinsurance agreement with Wilton Re to coinsure a closed block of GUL policies. Reinsurance recoverables were $8,013 million and $7,478 million as of December 31, 2025 and 2024, respectively.
Resolution Re
Effective July 1, 2025, the Company entered into a reinsurance agreement with Resolution Re, Ltd. ("Resolution Re") to cede risks associated with certain fixed rate annuity contracts and indexed annuity contracts issued on or after the effective date of the agreement on a quota share funds withheld basis. The deposit assets on reinsurance totaled $849 million at December 31, 2025. The funds withheld payables totaled $852 million at December 31, 2025.
Prismic Re
13. INCOME TAXES
The following schedule discloses significant components of income tax expense (benefit) for each year presented:
| Years Ended December 31, | ||||||||||||||||||||
| 2025 | 2024 | 2023 | ||||||||||||||||||
| (in thousands) | ||||||||||||||||||||
| Current tax expense (benefit): | ||||||||||||||||||||
| U.S. federal | $ | $ | $ | |||||||||||||||||
| State and local | ||||||||||||||||||||
| Total | ||||||||||||||||||||
| Deferred tax expense (benefit): | ||||||||||||||||||||
| U.S. federal | ( | ( | ||||||||||||||||||
| State and local | ||||||||||||||||||||
| Total | ( | ( | ||||||||||||||||||
| Total income tax expense (benefit) on income (loss) before equity in earnings of operating joint ventures | ||||||||||||||||||||
| Income tax expense (benefit) on equity in earnings of operating joint ventures | ( | ( | ||||||||||||||||||
| Income tax expense (benefit) reported in equity related to: | ||||||||||||||||||||
| Other comprehensive income (loss) | ( | ( | ||||||||||||||||||
| Total income tax expense (benefit) | $ | $ | ( | $ | ||||||||||||||||
Reconciliation of Expected Tax at Statutory Rates to Reported Income Tax Expense (Benefit)
The differences between income taxes expected at the U.S. federal statutory income tax rate of 21
97
PRUCO LIFE INSURANCE COMPANY
Notes to Consolidated Financial Statements—(Continued)
| Year Ended December 31, 2025 | ||||||||||||||
| ($ in thousands) | ||||||||||||||
| $ | % | |||||||||||||
| State taxes (net of federal benefit) | % | |||||||||||||
| Tax credits | ( | ( | % | |||||||||||
| Nontaxable or nondeductible items | ( | ( | % | |||||||||||
| Other reconciling items | % | |||||||||||||
| Foreign tax effects | ( | ( | % | |||||||||||
| Total | $ | % | ||||||||||||
The differences between income taxes expected at the U.S. federal statutory income tax rate of 21
| Years Ended December 31, | ||||||||||||||||||||
| 2024 | 2023 | |||||||||||||||||||
| ($ in thousands) | ||||||||||||||||||||
| Expected federal income tax expense (benefit) | $ | $ | ||||||||||||||||||
| Non-taxable investment income | ( | ( | ||||||||||||||||||
| Tax credits | ( | ( | ||||||||||||||||||
| State taxes (net of federal benefit) | ||||||||||||||||||||
| Other | ( | ( | ||||||||||||||||||
| Reported income tax expense (benefit) | $ | $ | ||||||||||||||||||
| Effective tax rate | % | % | ||||||||||||||||||
The following is a description of items that had a significant impact on the difference between the Company’s statutory U.S. federal income tax rate of 21 % applicable for 2025, 2024, and 2023, and the Company’s effective tax rate during the periods presented:
Non-Taxable Investment Income. The U.S. Dividends Received Deduction (“DRD”) reduces the amount of dividend income subject to U.S. tax and is included in the non-taxable investment income shown in the table above. More specifically, the U.S. DRD constitutes $35 million of the total $37 million of 2025 non-taxable investment income, $41 million of the total $43 million of 2024 non-taxable investment income, and $40 million of the total $43 million of 2023 non-taxable investment income. The DRD for the current period was estimated using information from 2024, current year investment results, and current year’s equity market performance. The actual current year DRD can vary based on factors such as, but not limited to, changes in the amount of dividends received that are eligible for the DRD, changes in the amount of distributions received from fund investments, changes in the account balances of variable life and annuity contracts, and the Company’s taxable income before the DRD.
Tax Credits. These amounts primarily represent tax credits relating to foreign taxes withheld on the Company’s separate account investments.
State and Local Income Taxes. State income tax in Illinois represents the majority of the State and local income tax category. Note that in most jurisdictions, the Company’s insurance operations are subject to state premium taxes in lieu of state income taxes. Premium taxes are recorded as a general expense.
Other. This line item represents reconciling items that are individually less than 5 % of the computed expected federal income tax expense (benefit) and have therefore been aggregated for purposes of this reconciliation in accordance with relevant disclosure guidance.
98
PRUCO LIFE INSURANCE COMPANY
Notes to Consolidated Financial Statements—(Continued)
Schedule of Deferred Tax Assets and Deferred Tax Liabilities
| December 31, | ||||||||||||||
| 2025 | 2024 | |||||||||||||
| (in thousands) | ||||||||||||||
| Deferred tax assets: | ||||||||||||||
| Insurance reserves | $ | $ | ||||||||||||
| Investments | ||||||||||||||
| Net unrealized loss on securities | ||||||||||||||
| Other | ||||||||||||||
| Deferred tax assets | ||||||||||||||
| Deferred tax liabilities: | ||||||||||||||
| Deferred policy acquisition cost | ||||||||||||||
| Deferred sales inducements | ||||||||||||||
| Other | ||||||||||||||
| Deferred tax liabilities | ||||||||||||||
| Net deferred tax asset (liability) | $ | $ | ||||||||||||
The application of U.S. GAAP requires the Company to evaluate the recoverability of deferred tax assets and establish a valuation allowance if necessary to reduce the deferred tax asset to an amount that is more likely than not expected to be realized. Considerable judgment is required in determining whether a valuation allowance is necessary, and if so, the amount of such valuation allowance. In evaluating the need for a valuation allowance, the Company considers many factors, including: (1) the nature of the deferred tax assets and liabilities; (2) whether they are ordinary or capital; (3) in which tax jurisdictions they were generated and the timing of their reversal; (4) taxable income in prior carryback years as well as projected taxable earnings exclusive of reversing temporary differences and carryforwards; (5) the length of time that carryovers can be utilized in the various taxing jurisdictions; (6) any unique tax rules that would impact the utilization of the deferred tax assets; and (7) any tax planning strategies that the Company would employ to avoid a tax benefit from expiring unused. Although realization is not assured, management believes it is more likely than not that the deferred tax assets, net of valuation allowances, will be realized.
Changes in market conditions, including the significant rise in interest rates since the beginning of 2022, resulted in the recording of deferred tax assets related to net unrealized tax capital losses in the Company. When assessing recoverability of these deferred tax assets, the Company considers its ability and intent to hold the underlying securities to recovery in value, if necessary, as well as other factors as noted above. As of December 31, 2025, based on all available evidence, including capital loss carryback capacity, the Company concluded that the deferred tax assets related to the unrealized tax capital losses on the available-for-sale securities portfolios are, more likely than not, expected to be realized.
The Company had no
The Company’s “Income (loss) from operations before income taxes and equity in earnings of operating joint venture” includes income from domestic operations of $2,267 million, $973 million and $478 million for the years ended December 31, 2025, 2024, and 2023, respectively.
Income Taxes Paid
Income taxes paid during the year are disclosed in the table below and include tax installments made for the current year as well as tax payments and refunds related to prior periods.
| December 31, | |||||||||||
| 2025 | |||||||||||
| (in thousands) | |||||||||||
| Federal | $ | ||||||||||
| State | |||||||||||
| Foreign | |||||||||||
| Total | $ | ||||||||||
99
PRUCO LIFE INSURANCE COMPANY
Notes to Consolidated Financial Statements—(Continued)
Tax Audit and Unrecognized Tax Benefits
The Company’s liability for income taxes includes the liability for unrecognized tax benefits and interest that relate to tax years still subject to review by the IRS or other taxing authorities. The completion of review or the expiration of the Federal statute of limitations for a given audit period could result in an adjustment to the liability for income taxes.
The Company had no
The Company classifies all interest and penalties related to tax uncertainties as income tax expense (benefit). The Company did not recognize tax related interest and penalties.
At December 31, 2025, the Company remains subject to examination in the U.S. for tax years 2014 through 2025.
The Company participates in the IRS’s Compliance Assurance Program. Under this program, the IRS assigns an examination team to review completed transactions as they occur in order to reach agreement with the Company on how they should be reported in the relevant tax returns. If disagreements arise, accelerated resolutions programs are available to resolve the disagreements in a timely manner.
14. EQUITY
Accumulated Other Comprehensive Income (Loss)
AOCI represents the cumulative OCI items that are reported separate from net income and detailed on the Consolidated Statements of Operations and Comprehensive Income (Loss). Net unrealized investment gains (losses) are described in further detail in Note 2, Note 9 (Interest rate remeasurement of future policy benefits) and Note 11 (Gain (loss) from changes in non-performance risk on market risk benefits). The balance of and changes in each component of AOCI as of and for the years ended December 31, are as follows:
| Accumulated Other Comprehensive Income (Loss) | ||||||||||||||||||||||||||||||||
| Foreign Currency Translation Adjustment | Net Unrealized Investment Gains (Losses)(1) | Interest Rate Remeasurement of Future Policy Benefits | Gain (Loss) from Changes in Non-Performance Risk on Market Risk Benefits | Total Accumulated Other Comprehensive Income (Loss) | ||||||||||||||||||||||||||||
| (in thousands) | ||||||||||||||||||||||||||||||||
| Balance, December 31, 2022 | $ | ( | $ | ( | $ | $ | $ | ( | ||||||||||||||||||||||||
| Change in OCI before reclassifications | ( | ( | ( | |||||||||||||||||||||||||||||
| Amounts reclassified from AOCI | ||||||||||||||||||||||||||||||||
| Income tax benefit (expense) | ( | ( | ||||||||||||||||||||||||||||||
| Balance, December 31, 2023 | ( | ( | ( | |||||||||||||||||||||||||||||
| Change in OCI before reclassifications | ( | ( | ( | ( | ||||||||||||||||||||||||||||
| Amounts reclassified from AOCI | ||||||||||||||||||||||||||||||||
| Income tax benefit (expense) | ( | |||||||||||||||||||||||||||||||
| Balance, December 31, 2024 | ( | ( | ( | |||||||||||||||||||||||||||||
| Change in OCI before reclassifications | ( | ( | ||||||||||||||||||||||||||||||
| Amounts reclassified from AOCI | ||||||||||||||||||||||||||||||||
| Income tax benefit (expense) | ( | ( | ( | |||||||||||||||||||||||||||||
| Balance, December 31, 2025 | $ | ( | $ | ( | $ | $ | $ | |||||||||||||||||||||||||
(1)Includes cash flow hedges of $(133 ) million, $111 million, and $12 million as of December 31, 2025, 2024, and 2023, respectively.
100
PRUCO LIFE INSURANCE COMPANY
Notes to Consolidated Financial Statements—(Continued)
Reclassifications out of Accumulated Other Comprehensive Income (Loss)
| Years Ended December 31, | ||||||||||||||||||||
| 2025 | 2024 | 2023 | ||||||||||||||||||
| (in thousands) | ||||||||||||||||||||
| Amounts reclassified from AOCI(1)(2): | ||||||||||||||||||||
| Net unrealized investment gains (losses): | ||||||||||||||||||||
| Cash flow hedges—Currency/Interest rate(3) | $ | ( | $ | $ | ||||||||||||||||
| Net unrealized investment gains (losses) on available-for-sale securities | ( | ( | ( | |||||||||||||||||
| Total net unrealized investment gains (losses)(4) | ( | ( | ( | |||||||||||||||||
| Total reclassifications for the period | $ | ( | $ | ( | $ | ( | ||||||||||||||
(1)All amounts are shown before tax.
(2)Positive amounts indicate gains/benefits reclassified out of AOCI. Negative amounts indicate losses/costs reclassified out of AOCI.
(3)See Note 5 for additional information on cash flow hedges.
(4)See table below for additional information on unrealized investment gains (losses), including the impact on future policy benefits and policyholders’ account balances.
101
PRUCO LIFE INSURANCE COMPANY
Notes to Consolidated Financial Statements—(Continued)
Net Unrealized Investment Gains (Losses)
Net unrealized investment gains (losses) on available-for-sale fixed maturity securities and certain other invested assets and other assets are included in the Company’s Consolidated Statements of Financial Position as a component of AOCI. Changes in these amounts include reclassification adjustments to exclude from OCI those items that are included as part of “Net income (loss)” for a period that had been part of OCI in earlier periods. The amounts for the periods indicated below, split between amounts related to net unrealized investment gains (losses) on available-for-sale fixed maturity securities on which an allowance for credit losses has been recognized, and all other net unrealized investment gains (losses), are as follows:
| Net Unrealized Investment Gains (Losses) on Available-for-Sale Fixed Maturity Securities on Which an Allowance for Credit Losses has been Recognized | Net Unrealized Gains (Losses) on All Other Investments(1) | Other Costs(2) | Future Policy Benefits, Policyholders' Account Balances and Reinsurance Payables | Income Tax Benefit (Expense) | Accumulated Other Comprehensive Income (Loss) Related to Net Unrealized Investment Gains (Losses) | |||||||||||||||||||||||||||||||||
| (in thousands) | ||||||||||||||||||||||||||||||||||||||
| Balance, December 31, 2022 | $ | $ | ( | $ | ( | $ | $ | $ | ( | |||||||||||||||||||||||||||||
| Net investment gains (losses) on investments arising during the period | ( | ( | ||||||||||||||||||||||||||||||||||||
| Reclassification adjustment for (gains) losses included in net income | ( | ( | ||||||||||||||||||||||||||||||||||||
| Reclassification due to allowance for credit losses recorded during the period | ( | |||||||||||||||||||||||||||||||||||||
| Impact of net unrealized investment (gains) losses | ( | ( | ||||||||||||||||||||||||||||||||||||
| Balance, December 31, 2023 | ( | ( | ( | |||||||||||||||||||||||||||||||||||
| Net investment gains (losses) on investments arising during the period | ( | ( | ( | |||||||||||||||||||||||||||||||||||
| Reclassification adjustment for (gains) losses included in net income | ( | ( | ||||||||||||||||||||||||||||||||||||
| Reclassification due to allowance for credit losses recorded during the period | ( | |||||||||||||||||||||||||||||||||||||
| Impact of net unrealized investment (gains) losses | ( | ( | ||||||||||||||||||||||||||||||||||||
| Balance, December 31, 2024 | ( | ( | ( | |||||||||||||||||||||||||||||||||||
| Net investment gains (losses) on investments arising during the period | ( | ( | ||||||||||||||||||||||||||||||||||||
| Reclassification adjustment for (gains) losses included in net income | ( | ( | ||||||||||||||||||||||||||||||||||||
| Reclassification due to allowance for credit losses recorded during the period | ( | |||||||||||||||||||||||||||||||||||||
| Impact of net unrealized investment (gains) losses | ( | ( | ||||||||||||||||||||||||||||||||||||
| Balance, December 31, 2025 | $ | ( | $ | ( | $ | ( | $ | $ | $ | ( | ||||||||||||||||||||||||||||
(1)Includes cash flow hedges. See Note 5 for information on cash flow hedges.
(2)"Other costs" primarily includes reinsurance recoverables and DRL.
Noncontrolling Interests
For certain subsidiaries, the Company owns a controlling interest that is less than 100 % ownership of the subsidiary but must consolidate 100% of the subsidiary’s financial statements in accordance with U.S. GAAP. Noncontrolling interests represent the portion of equity ownership in a consolidated subsidiary that is not attributable to the Company.
102
PRUCO LIFE INSURANCE COMPANY
Notes to Consolidated Financial Statements—(Continued)
15. STATUTORY NET INCOME AND SURPLUS AND DIVIDEND RESTRICTIONS
The Company is required to prepare statutory financial statements in accordance with accounting practices prescribed or permitted by the Arizona Department of Insurance ("AZDOI"). It's subsidiary PLNJ is required to prepare statutory financial statements in accordance with accounting practices prescribed or permitted by the New Jersey Department of Insurance and Banking. Statutory accounting practices primarily differ from U.S. GAAP by charging policy acquisition costs to expense as incurred, establishing future policy benefit liabilities using different actuarial assumptions as well as valuing investments and certain assets and accounting for deferred taxes on a different basis.
The following table summarizes certain statutory financial information for the Company, including its subsidiary PLNJ, for the periods indicated:
| Years Ended December 31, | ||||||||||||||||||||
| 2025 | 2024 | 2023 | ||||||||||||||||||
| (in millions) | ||||||||||||||||||||
| Statutory net income (loss) | $ | $ | ( | $ | ||||||||||||||||
| Statutory capital and surplus | ||||||||||||||||||||
The Company does not utilize prescribed or permitted practices that vary materially from the statutory accounting practices prescribed by the NAIC.
The Company is subject to Arizona law, which limits the amount of dividends that insurance companies can pay to stockholders without approval of the AZDOI. The maximum dividend, which may be paid in any twelve-month period without notification or approval, is limited to the lesser of 10 % of statutory surplus as of December 31 of the preceding year or the net gain from operations of the preceding calendar year. Cash dividends may only be paid out of surplus derived from realized net profits. The Company must obtain approval from AZDOI prior to paying a dividend if the dividend, together with other dividend distributions made within the preceding twelve months, would exceed the lesser of 10 % of statutory surplus or net gain from operations. Based on these limitations, there is a capacity to pay a dividend of $582 million in 2026 without prior approval. There was no return of capital in 2025. The Company did not
16. RELATED PARTY TRANSACTIONS
The Company has extensive transactions and relationships with Prudential Insurance and other affiliates. Although we seek to ensure that these transactions and relationships are fair and reasonable, it is possible that the terms of these transactions are not the same as those that would result from transactions among unrelated parties.
Expense Charges and Allocations
The majority of the Company’s expenses are allocations or charges from Prudential Insurance or other affiliates. These expenses can be grouped into general and administrative expenses and agency distribution expenses.
The Company’s general and administrative expenses are charged to the Company using allocation methodologies based on business production processes. Management believes that the methodology is reasonable and reflects costs incurred by Prudential Insurance to process transactions on behalf of the Company. The Company operates under service and lease agreements whereby services of officers and employees, supplies, use of equipment and office space are provided by Prudential Insurance. The Company reviews its allocation methodology periodically which it may adjust accordingly. General and administrative expenses include allocations of stock compensation expenses related to a stock-based awards program and a deferred compensation program issued by Prudential Financial. The expense charged to the Company for the stock-based awards program was $1 5 million, $6 million and $5 million for the years ended December 31, 2025, 2024, and 2023, respectively.
The Company is charged for its share of employee benefit expenses. These expenses include costs for funded and non-funded, non-contributory defined benefit pension plans. Some of these benefits are based on final earnings and length of service while others are based on an account balance, which takes into consideration age, service and earnings during a career. The Company’s share of net expense for the pension plans was $14 million, $11 million and $13 million for the years ended December 31, 2025, 2024, and 2023, respectively.
103
PRUCO LIFE INSURANCE COMPANY
Notes to Consolidated Financial Statements—(Continued)
The Company is also charged for its share of the costs associated with welfare plans issued by Prudential Insurance. These expenses include costs related to medical, dental, life insurance and disability. The Company's share of net expense for the welfare plans was $19 million, $18 million and $14 million for the years ended December 31, 2025, 2024, and 2023, respectively.
Prudential Insurance sponsors voluntary savings plans for its employee 401(k) plans. The plans provide for salary reduction contributions by employees and matching contributions by the Company of up to 4 % of annual salary. The Company’s expense for its share of the voluntary savings plan was $9 million, $8 million and $7 million for the years ended December 31, 2025, 2024, and 2023, respectively.
The Company is charged distribution expenses from Prudential’s proprietary nationwide advice organization, “Prudential Advisors” through a transfer pricing agreement, which is intended to reflect a market-based pricing arrangement. Prudential Advisors distributes Prudential life insurance, annuities, and investment products with proprietary and non-proprietary product options. In November 2024, the Company, along with three other affiliated entities, entered into several agreements with a third-party, LPL Financial Holdings Inc. (“LPL”). Under these agreements, the Company pays distribution expenses to LPL, of which 98 % are returned to Prudential Advisors. Distribution expenses paid by the Company to LPL and subsequently returned to Prudential Advisors were $473 million and $56 million for the years ended December 31, 2025, and 2024, respectively.
The Company pays commissions and certain other fees to Prudential Annuities Distributors, Inc. (“PAD”) in consideration for PAD’s marketing and underwriting of the Company’s annuity products. Commissions and fees are paid by PAD to broker-dealers who sell the Company’s annuity products. Commissions and fees paid by the Company to PAD were $760 million, $820 million and $587 million for the years ended December 31, 2025, 2024, and 2023, respectively.
The Company is charged for its share of corporate expenses incurred by Prudential Financial to benefit its businesses, such as advertising, executive oversight, external affairs and philanthropic activity. The Company’s share of corporate expenses was $105 million, $131 million and $144 million for the years ended December 31, 2025, 2024, and 2023, respectively.
Corporate-Owned Life Insurance
The Company has sold five Corporate Owned Life Insurance (“COLI”) policies to Prudential Insurance, and one to Prudential Financial. The cash surrender value included in separate accounts for these COLI policies was $5,098 million and $4,657 million as of December 31, 2025 and 2024, respectively. Fees related to these COLI policies were $59 million, $55 million and $50 million for the years ended December 31, 2025, 2024, and 2023, respectively. The Company reinsures the risk associated with these COLI policies to an affiliate reinsurer as part of a broader program related to variable insurance policies.
In May 2023, the Company funded a policy loan from the Prudential Financial COLI policy noted above in an amount of $900 million to an affiliated irrevocable trust, commonly referred to as a “rabbi trust”, which Prudential Financial created to support certain non-qualified retirement plans. The outstanding balance of the policy loan with the rabbi trust was $888 million and $897 million as of December 31, 2025 and 2024, respectively. Interest income related to the policy loan was $41 million, $42 million and $26 million for the years ended December 31, 2025, 2024, and 2023, respectively.
Affiliated Investment Management Expenses
In accordance with an agreement with PGIM, Inc. ("PGIM"), the Company pays investment management expenses to PGIM who acts as investment manager to certain Company general account and separate account assets. Investment management expenses paid to PGIM related to this agreement were $91 million, $69 million and $53 million for the years ended December 31, 2025, 2024, and 2023, respectively. These expenses are recorded as “Net investment income” in the Consolidated Statements of Operations and Comprehensive Income (Loss).
Derivative Trades
In its ordinary course of business, the Company enters into OTC derivative contracts with an affiliate, PGF. For these OTC derivative contracts, PGF has a substantially equal and offsetting position with an external counterparty. See Note 5 for additional information.
The interest income to the Company from PGF related to affiliated cash collateral was $417 million, $490 million and $499 million for the years ended December 31, 2025, 2024, and 2023, respectively, and are included in "Other income (loss)".
104
PRUCO LIFE INSURANCE COMPANY
Notes to Consolidated Financial Statements—(Continued)
Joint Ventures
The Company has made investments in joint ventures with certain subsidiaries of Prudential Financial. "Other invested assets" includes $1,852 million and $1,100 million of investments in joint ventures as of December 31, 2025 and 2024, respectively. "Net investment income" related to these ventures includes gains of $168 million, $68 million and $5 million for the years ended December 31, 2025, 2024, and 2023, respectively.
Affiliated Asset Administration Fee Income
The Company has a revenue sharing agreement with AST Investment Services, Inc. ("ASTISI") and PGIM Investments LLC ("PGIM Investments") whereby the Company receives fee income based on policyholders' separate account balances invested in the Advanced Series Trust. Income received from ASTISI and PGIM Investments related to this agreement was $247 million, $271 million and $274 million for the years ended December 31, 2025, 2024, and 2023, respectively. These revenues are recorded as “Asset administration fees” in the Consolidated Statements of Operations and Comprehensive Income (Loss).
Affiliated Notes Receivable
Affiliated notes receivable included in “Receivables from parent and affiliates” at December 31, was as follows:
| Maturity Dates | Interest Rates | 2025 | 2024 | ||||||||||||||||||||||||||||||||
| (in thousands) | |||||||||||||||||||||||||||||||||||
| U.S. dollar fixed rate notes | 2026 | - | 2038 | - | % | $ | $ | ||||||||||||||||||||||||||||
| Total notes receivable - affiliated(1) | $ | $ | |||||||||||||||||||||||||||||||||
(1)All notes receivable may be called for prepayment prior to the respective maturity dates under specified circumstances.
The affiliated notes receivable shown above are classified as available-for-sale securities and other trading assets carried at fair value. The Company monitors the internal and external credit ratings of these loans and loan performance. The Company also considers any guarantees made by Prudential Insurance for loans due from affiliates.
Accrued interest receivable related to these loans was $3 million and $1 million at December 31, 2025 and 2024, respectively, and is included in “Other assets”. Revenues related to these loans were $8 million, $3 million and $3 million for the years ended December 31, 2025, 2024, and 2023, respectively, and are included in “Other income (loss)”.
Affiliated Commercial Mortgage Loan
The affiliated commercial mortgage loan included in "Commercial mortgage and other loans" at December 31, 2025 and 2024 was $0
The commercial mortgage loan is carried at unpaid principal balance, net of unamortized deferred loan origination fees and expenses, and net of an allowance for losses. The Company reviews the performance and credit quality of the commercial mortgage loan on an on-going basis.
105
PRUCO LIFE INSURANCE COMPANY
Notes to Consolidated Financial Statements—(Continued)
Affiliated Asset Transfers
The Company participates in affiliated asset trades with parent and sister companies. Book and market value differences for trades with a parent and sister are recognized within "Additional paid-in capital" ("APIC") and "Realized investment gains (losses), net", respectively. The table below shows affiliated asset trades for the years ended December 31, 2025 and 2024.
| Affiliate | Date | Transaction | Security Type | Fair Value | Book Value | APIC, Net of Tax Increase/ (Decrease) | Realized Investment Gain/(Loss) | |||||||||||||||||||||||||||||||||||||
| (in thousands) | ||||||||||||||||||||||||||||||||||||||||||||
| PAR U | January 2024 | Transfer in | Fixed Maturities | $ | $ | $ | $ | |||||||||||||||||||||||||||||||||||||
| PAR U | January 2024 | Transfer in | Fixed Maturities | $ | $ | $ | $ | |||||||||||||||||||||||||||||||||||||
| PURC | January 2024 | Transfer in | Fixed Maturities | $ | $ | $ | $ | |||||||||||||||||||||||||||||||||||||
| GUL Re | January 2024 | Transfer in | Fixed Maturities | $ | $ | $ | $ | |||||||||||||||||||||||||||||||||||||
| GUL Re | January 2024 | Transfer in | Equities | $ | $ | $ | $ | |||||||||||||||||||||||||||||||||||||
| PURE | January 2024 | Transfer out | Fixed Maturities | $ | $ | $ | $ | |||||||||||||||||||||||||||||||||||||
| PURE | January 2024 | Transfer out | Fixed Maturities | $ | $ | $ | $ | |||||||||||||||||||||||||||||||||||||
| PURE | January 2024 | Transfer out | Fixed Maturities | $ | $ | $ | $ | |||||||||||||||||||||||||||||||||||||
| PURE | January 2024 | Transfer out | Fixed Maturities | $ | $ | $ | $ | |||||||||||||||||||||||||||||||||||||
| PURE | January 2024 | Transfer out | Equities | $ | $ | $ | $ | |||||||||||||||||||||||||||||||||||||
| Ironbound | January 2024 | Purchase | Other Invested Assets | $ | $ | $ | $ | |||||||||||||||||||||||||||||||||||||
| Windhill CLO 1, Ltd. | February 2024 | Sale | Fixed Maturities | $ | $ | $ | $ | ( | ||||||||||||||||||||||||||||||||||||
| Windhill CLO 2, Ltd. | February 2024 | Sale | Fixed Maturities | $ | $ | $ | $ | ( | ||||||||||||||||||||||||||||||||||||
| PAR Term | February 2024 | Purchase | Fixed Maturities | $ | $ | $ | $ | |||||||||||||||||||||||||||||||||||||
| Windhill CLO 1, Ltd. | March 2024 | Sale | Fixed Maturities | $ | $ | $ | $ | ( | ||||||||||||||||||||||||||||||||||||
| Windhill CLO 2, Ltd. | March 2024 | Sale | Fixed Maturities | $ | $ | $ | $ | ( | ||||||||||||||||||||||||||||||||||||
| Prudential Insurance | March 2024 | Purchase | Fixed Maturities | $ | $ | $ | $ | |||||||||||||||||||||||||||||||||||||
| PAR U | March 2024 | Transfer in | Other Invested Assets | $ | $ | $ | $ | |||||||||||||||||||||||||||||||||||||
| PURE | March 2024 | Transfer out | Other Invested Assets | $ | $ | $ | $ | |||||||||||||||||||||||||||||||||||||
| Windhill CLO 1, Ltd. | April 2024 | Sale | Fixed Maturities | $ | $ | $ | $ | ( | ||||||||||||||||||||||||||||||||||||
| Windhill CLO 2, Ltd. | May 2024 | Sale | Fixed Maturities | $ | $ | $ | $ | ( | ||||||||||||||||||||||||||||||||||||
| Windhill CLO 1, Ltd. | June 2024 | Sale | Fixed Maturities | $ | $ | $ | $ | ( | ||||||||||||||||||||||||||||||||||||
| Windhill CLO 2, Ltd. | June 2024 | Sale | Fixed Maturities | $ | $ | $ | $ | ( | ||||||||||||||||||||||||||||||||||||
| PAR U | June 2024 | Transfer in | Other Invested Assets | $ | $ | $ | $ | |||||||||||||||||||||||||||||||||||||
| PURE | June 2024 | Transfer out | Other Invested Assets | $ | $ | $ | $ | |||||||||||||||||||||||||||||||||||||
106
PRUCO LIFE INSURANCE COMPANY
Notes to Consolidated Financial Statements—(Continued)
| Affiliate | Date | Transaction | Security Type | Fair Value | Book Value | APIC, Net of Tax Increase/ (Decrease) | Realized Investment Gain/(Loss) | |||||||||||||||||||||||||||||||||||||
| PAR U | June 2024 | Purchase | Commercial Mortgage and Other Loans | $ | $ | $ | $ | |||||||||||||||||||||||||||||||||||||
| Windhill CLO 2, Ltd. | July 2024 | Sale | Fixed Maturities | $ | $ | $ | $ | ( | ||||||||||||||||||||||||||||||||||||
| Windhill CLO 2, Ltd. | July 2024 | Sale | Fixed Maturities | $ | $ | $ | $ | ( | ||||||||||||||||||||||||||||||||||||
| Windhill CLO 1, Ltd. | July 2024 | Sale | Fixed Maturities | $ | $ | $ | $ | ( | ||||||||||||||||||||||||||||||||||||
| PAR U | July 2024 | Purchase | Fixed Maturities | $ | $ | $ | $ | |||||||||||||||||||||||||||||||||||||
| Prudential Insurance | July 2024 | Purchase | Fixed Maturities | $ | $ | $ | $ | |||||||||||||||||||||||||||||||||||||
| PAR U | July 2024 | Purchase | Fixed Maturities | $ | $ | $ | $ | |||||||||||||||||||||||||||||||||||||
| PAR U | July 2024 | Purchase | Derivatives | $ | $ | $ | $ | |||||||||||||||||||||||||||||||||||||
| Windhill CLO 2, Ltd. | August 2024 | Sale | Fixed Maturities | $ | $ | $ | $ | ( | ||||||||||||||||||||||||||||||||||||
| Windhill CLO 1, Ltd. | August 2024 | Sale | Fixed Maturities | $ | $ | $ | $ | ( | ||||||||||||||||||||||||||||||||||||
| PAR U | August 2024 | Purchase | Fixed Maturities | $ | $ | $ | $ | |||||||||||||||||||||||||||||||||||||
| PAR U | August 2024 | Purchase | Fixed Maturities | $ | $ | $ | $ | |||||||||||||||||||||||||||||||||||||
| Prudential Insurance | August 2024 | Purchase | Fixed Maturities | $ | $ | $ | ( | $ | ||||||||||||||||||||||||||||||||||||
| Windhill CLO 2, Ltd. | September 2024 | Sale | Fixed Maturities | $ | $ | $ | $ | |||||||||||||||||||||||||||||||||||||
| Windhill CLO 2, Ltd. | September 2024 | Sale | Fixed Maturities | $ | $ | $ | $ | ( | ||||||||||||||||||||||||||||||||||||
| Prudential Insurance | September 2024 | Purchase | Fixed Maturities | $ | $ | $ | ( | $ | ||||||||||||||||||||||||||||||||||||
| Hirakata | October 2024 | Purchase | Fixed Maturities | $ | $ | $ | $ | |||||||||||||||||||||||||||||||||||||
| Hirakata | October 2024 | Purchase | Fixed Maturities | $ | $ | $ | $ | |||||||||||||||||||||||||||||||||||||
| PAR U | October 2024 | Transfer in | Fixed Maturities | $ | $ | $ | $ | |||||||||||||||||||||||||||||||||||||
| Windhill CLO 3, Ltd. | October 2024 | Sale | Fixed Maturities | $ | $ | $ | $ | ( | ||||||||||||||||||||||||||||||||||||
| Windhill CLO 2, Ltd. | October 2024 | Sale | Fixed Maturities | $ | $ | $ | $ | ( | ||||||||||||||||||||||||||||||||||||
| Windhill CLO 2, Ltd. | October 2024 | Sale | Fixed Maturities | $ | $ | $ | $ | ( | ||||||||||||||||||||||||||||||||||||
| Windhill CLO 1, Ltd. | October 2024 | Sale | Fixed Maturities | $ | $ | $ | $ | ( | ||||||||||||||||||||||||||||||||||||
| PAR U | October 2024 | Transfer in | Equities | $ | $ | $ | $ | |||||||||||||||||||||||||||||||||||||
| Windhill CLO 3, Ltd. | November 2024 | Sale | Fixed Maturities | $ | $ | $ | $ | ( | ||||||||||||||||||||||||||||||||||||
| Windhill CLO 3, Ltd. | December 2024 | Sale | Fixed Maturities | $ | $ | $ | $ | ( | ||||||||||||||||||||||||||||||||||||
| Windhill CLO 3, Ltd. | December 2024 | Sale | Short-term Investments | $ | $ | $ | $ | ( | ||||||||||||||||||||||||||||||||||||
| Prudential Insurance | December 2024 | Contributed Capital | Equities | $ | $ | $ | $ | |||||||||||||||||||||||||||||||||||||
107
PRUCO LIFE INSURANCE COMPANY
Notes to Consolidated Financial Statements—(Continued)
| Affiliate | Date | Transaction | Security Type | Fair Value | Book Value | APIC, Net of Tax Increase/ (Decrease) | Realized Investment Gain/(Loss) | |||||||||||||||||||||||||||||||||||||
| Windhill CLO 2, Ltd. | January 2025 | Sale | Fixed Maturities | $ | $ | $ | $ | ( | ||||||||||||||||||||||||||||||||||||
| Windhill CLO 3, Ltd. | January 2025 | Sale | Fixed Maturities | $ | $ | $ | $ | ( | ||||||||||||||||||||||||||||||||||||
| Windhill CLO 1, Ltd. | January 2025 | Sale | Fixed Maturities | $ | $ | $ | $ | ( | ||||||||||||||||||||||||||||||||||||
| PAR U | February 2025 | Purchase | Derivatives | $ | $ | $ | $ | |||||||||||||||||||||||||||||||||||||
| Windhill CLO 2, Ltd. | February 2025 | Sale | Fixed Maturities | $ | $ | $ | $ | ( | ||||||||||||||||||||||||||||||||||||
| Windhill CLO 3, Ltd. | February 2025 | Sale | Fixed Maturities | $ | $ | $ | $ | ( | ||||||||||||||||||||||||||||||||||||
| Windhill CLO 1, Ltd. | February 2025 | Sale | Fixed Maturities | $ | $ | $ | $ | ( | ||||||||||||||||||||||||||||||||||||
| Prudential Insurance | February 2025 | Purchase | Fixed Maturities | $ | $ | $ | $ | |||||||||||||||||||||||||||||||||||||
| Prudential Insurance | March 2025 | Purchase | Fixed Maturities | $ | $ | $ | $ | |||||||||||||||||||||||||||||||||||||
| Windhill CLO 3, Ltd. | March 2025 | Sale | Fixed Maturities | $ | $ | $ | $ | ( | ||||||||||||||||||||||||||||||||||||
| Windhill CLO 1, Ltd. | March 2025 | Sale | Fixed Maturities | $ | $ | $ | $ | ( | ||||||||||||||||||||||||||||||||||||
| Windhill CLO 1, Ltd. | March 2025 | Sale | Fixed Maturities | $ | $ | $ | $ | ( | ||||||||||||||||||||||||||||||||||||
| Windhill CLO 1, Ltd. | March 2025 | Purchase | Fixed Maturities | $ | $ | $ | $ | |||||||||||||||||||||||||||||||||||||
| Windhill CLO 1, Ltd. | April 2025 | Sale | Fixed Maturities | $ | $ | $ | $ | ( | ||||||||||||||||||||||||||||||||||||
| Windhill CLO 2, Ltd. | April 2025 | Sale | Fixed Maturities | $ | $ | $ | $ | ( | ||||||||||||||||||||||||||||||||||||
| Windhill CLO 3, Ltd. | April 2025 | Sale | Fixed Maturities | $ | $ | $ | $ | ( | ||||||||||||||||||||||||||||||||||||
| Windhill CLO 1, Ltd. | April 2025 | Purchase | Fixed Maturities | $ | $ | $ | $ | |||||||||||||||||||||||||||||||||||||
| Prudential Insurance | April 2025 | Purchase | Fixed Maturities | $ | $ | $ | $ | |||||||||||||||||||||||||||||||||||||
| Windhill CLO 1, Ltd. | May 2025 | Sale | Fixed Maturities | $ | $ | $ | $ | ( | ||||||||||||||||||||||||||||||||||||
| Windhill CLO 2, Ltd. | May 2025 | Sale | Fixed Maturities | $ | $ | $ | $ | ( | ||||||||||||||||||||||||||||||||||||
| Windhill CLO 4, Ltd. | May 2025 | Sale | Fixed Maturities | $ | $ | $ | $ | ( | ||||||||||||||||||||||||||||||||||||
| Prudential Insurance | May 2025 | Purchase | Fixed Maturities | $ | $ | $ | ( | $ | ||||||||||||||||||||||||||||||||||||
| PARCC | May 2025 | Purchase | Fixed Maturities | $ | $ | $ | $ | |||||||||||||||||||||||||||||||||||||
| Prudential Insurance | May 2025 | Contributed Capital | Other Invested Assets | $ | $ | $ | $ | |||||||||||||||||||||||||||||||||||||
| Windhill CLO 2, Ltd. | June 2025 | Sale | Fixed Maturities | $ | $ | $ | $ | |||||||||||||||||||||||||||||||||||||
| Windhill CLO 3, Ltd. | June 2025 | Sale | Fixed Maturities | $ | $ | $ | $ | |||||||||||||||||||||||||||||||||||||
| Windhill CLO 4, Ltd. | June 2025 | Sale | Fixed Maturities | $ | $ | $ | $ | ( | ||||||||||||||||||||||||||||||||||||
| Windhill CLO 1, Ltd. | July 2025 | Sale | Fixed Maturities | $ | $ | $ | $ | ( | ||||||||||||||||||||||||||||||||||||
108
PRUCO LIFE INSURANCE COMPANY
Notes to Consolidated Financial Statements—(Continued)
| Affiliate | Date | Transaction | Security Type | Fair Value | Book Value | APIC, Net of Tax Increase/ (Decrease) | Realized Investment Gain/(Loss) | |||||||||||||||||||||||||||||||||||||
| Windhill CLO 2, Ltd. | July 2025 | Sale | Fixed Maturities | $ | $ | $ | $ | |||||||||||||||||||||||||||||||||||||
| Windhill CLO 3, Ltd. | July 2025 | Sale | Fixed Maturities | $ | $ | $ | $ | ( | ||||||||||||||||||||||||||||||||||||
| Windhill CLO 4, Ltd. | July 2025 | Sale | Fixed Maturities | $ | $ | $ | $ | ( | ||||||||||||||||||||||||||||||||||||
| Windhill CLO 1, Ltd. | August 2025 | Sale | Fixed Maturities | $ | $ | $ | $ | ( | ||||||||||||||||||||||||||||||||||||
| Windhill CLO 2, Ltd. | August 2025 | Sale | Fixed Maturities | $ | $ | $ | $ | |||||||||||||||||||||||||||||||||||||
| Windhill CLO 3, Ltd. | August 2025 | Sale | Fixed Maturities | $ | $ | $ | $ | |||||||||||||||||||||||||||||||||||||
| Prudential Insurance | August 2025 | Purchase | Fixed Maturities | $ | $ | $ | ( | $ | ||||||||||||||||||||||||||||||||||||
| Windhill CLO 1, Ltd. | September 2025 | Sale | Fixed Maturities | $ | $ | $ | $ | ( | ||||||||||||||||||||||||||||||||||||
| Windhill CLO 2, Ltd. | September 2025 | Sale | Fixed Maturities | $ | $ | $ | $ | ( | ||||||||||||||||||||||||||||||||||||
| Windhill CLO 3, Ltd. | September 2025 | Sale | Short-term Investments | $ | $ | $ | $ | |||||||||||||||||||||||||||||||||||||
| Windhill CLO 4, Ltd. | September 2025 | Sale | Fixed Maturities | $ | $ | $ | $ | ( | ||||||||||||||||||||||||||||||||||||
| PGIM Strategic Investments Inc | September 2025 | Sale | Other Invested Assets | $ | $ | $ | $ | |||||||||||||||||||||||||||||||||||||
| Windhill CLO 2, Ltd. | October 2025 | Sale | Fixed Maturities | $ | $ | $ | $ | ( | ||||||||||||||||||||||||||||||||||||
| Windhill CLO 3, Ltd. | October 2025 | Sale | Fixed Maturities | $ | $ | $ | $ | ( | ||||||||||||||||||||||||||||||||||||
| Windhill CLO 4, Ltd. | October 2025 | Sale | Fixed Maturities | $ | $ | $ | $ | ( | ||||||||||||||||||||||||||||||||||||
| Windhill CLO 5, Ltd. | November 2025 | Sale | Fixed Maturities | $ | $ | $ | $ | ( | ||||||||||||||||||||||||||||||||||||
| Prudential Insurance | November 2025 | Sale | Commercial Mortgage and Other Loans | $ | $ | $ | $ | |||||||||||||||||||||||||||||||||||||
| Prudential Insurance | November 2025 | Sale | Fixed Maturities | $ | $ | $ | $ | |||||||||||||||||||||||||||||||||||||
| Prudential Insurance | November 2025 | Sale | Fixed Maturities | $ | $ | $ | ( | $ | ||||||||||||||||||||||||||||||||||||
| Prudential Insurance | November 2025 | Purchase | Fixed Maturities | $ | $ | $ | $ | |||||||||||||||||||||||||||||||||||||
| Prudential Insurance | December 2025 | Purchase | Fixed Maturities | $ | $ | $ | $ | |||||||||||||||||||||||||||||||||||||
| Prudential Insurance | December 2025 | Purchase | Fixed Maturities | $ | $ | $ | $ | ( | ||||||||||||||||||||||||||||||||||||
| Windhill CLO 1, Ltd. | December 2025 | Purchase | Fixed Maturities | $ | $ | $ | $ | |||||||||||||||||||||||||||||||||||||
| Windhill CLO 1, Ltd. | December 2025 | Sale | Fixed Maturities | $ | $ | $ | $ | ( | ||||||||||||||||||||||||||||||||||||
| Windhill CLO 2, Ltd. | December 2025 | Sale | Fixed Maturities | $ | $ | $ | $ | ( | ||||||||||||||||||||||||||||||||||||
| Windhill CLO 3, Ltd. | December 2025 | Sale | Fixed Maturities | $ | $ | $ | $ | ( | ||||||||||||||||||||||||||||||||||||
| Windhill CLO 3, Ltd. | December 2025 | Sale | Short-term Investments | $ | $ | $ | $ | |||||||||||||||||||||||||||||||||||||
| Windhill CLO 4, Ltd. | December 2025 | Sale | Fixed Maturities | $ | $ | $ | $ | ( | ||||||||||||||||||||||||||||||||||||
109
PRUCO LIFE INSURANCE COMPANY
Notes to Consolidated Financial Statements—(Continued)
| Affiliate | Date | Transaction | Security Type | Fair Value | Book Value | APIC, Net of Tax Increase/ (Decrease) | Realized Investment Gain/(Loss) | |||||||||||||||||||||||||||||||||||||
| Windhill CLO 5, Ltd. | December 2025 | Sale | Fixed Maturities | $ | $ | $ | $ | ( | ||||||||||||||||||||||||||||||||||||
| Passaic Fund LLC | December 2025 | Sale | Other Invested Assets | $ | $ | $ | $ | |||||||||||||||||||||||||||||||||||||
Debt Agreements
The Company is authorized to borrow funds up to $7 billion from affiliates to meet its capital and other funding needs. There was no
The total interest expense to the Company related to affiliated loans and cash collateral with PGF was $16 million, $39 million and $17 million for the years ended December 31, 2025, 2024, and 2023, respectively.
Contributed Capital and Dividends
In February 2026, the Company received a capital contribution of $300 million from Prudential Insurance. In February, May, August and December 2025, the Company received capital contributions from Prudential Insurance in the amounts of $220 million, $216 million, $17 million and $400 million, respectively, with the May contribution including $208 million in invested assets. In December 2024, the Company received capital contributions in the amount of $416 million from Prudential Insurance in the form of invested assets. In February and December 2023, the Company received capital contributions in the amount of $405 million and $7 million, respectively, from Prudential Insurance.
In June 2024, there was a $550 million return of capital to Prudential Insurance. In June, September, and December 2023, there was a $300 million, $650 million, and $450 million return of capital, respectively, to Prudential Insurance.
In 2025, 2024, and 2023, the Company did not
Reinsurance with Affiliates
As discussed in Note 12, the Company participates in reinsurance transactions with certain affiliates.
17. COMMITMENTS AND CONTINGENT LIABILITIES
Commitments
The Company has made commitments to fund commercial mortgage and agricultural property loans. As of December 31, 2025 and 2024, the outstanding balances on these commitments were $85 million and $230 million, respectively. These amounts include unfunded commitments that are not unconditionally cancellable. For related credit exposure, there was an allowance for credit losses of $0.5 million and $0.3 million as of December 31, 2025 and 2024, respectively, which is a change of $0.2 million and $0.0 million for the years ended December 31, 2025 and 2024, respectively. The Company also made commitments to purchase or fund investments, mostly fund investments and private fixed maturities, some of which are contingent upon events or circumstances not under the Company’s control, including those at the discretion of the Company’s counterparties. The Company anticipates a portion of these commitments will ultimately be funded from its separate accounts. As of December 31, 2025 and 2024, $2,142 million and $1,359 million, respectively, of these commitments were outstanding. These amounts include unfunded commitments that are not unconditionally cancellable. There were no
110
PRUCO LIFE INSURANCE COMPANY
Notes to Consolidated Financial Statements—(Continued)
Guarantees
In July 2017, Pruco Life formed a joint venture with CT Corp to provide life insurance solutions in Indonesia. Pruco Life owns a 49 % interest in the joint venture and has entered into a shareholders agreement with CT Corp that sets out their respective rights and obligations with respect to the joint venture. Among other things, the shareholders agreement obligates Pruco Life and CT Corp to provide capital to the joint venture, as necessary to comply with applicable law or to maintain a specified minimum amount of capital in the joint venture. This obligation is not limited to a maximum amount. Pruco Life does not expect to make any payments on this guarantee and is not carrying any liabilities associated with the guarantee.
Since 2001, Pruco Life entered into an arrangement with Prudential of Taiwan. In June 2021, PIIH completed the sale of Prudential of Taiwan. As a result of the sale, Pruco Life has a financial guarantee to stand ready to perform in an event that both Prudential of Taiwan and the Buyer default and fail to perform their obligations to make payments to the policyholders. Pruco Life has a liability of $31 million and $32 million as of December 31, 2025 and 2024, respectively, which represents the fair value of the guarantee and is amortized in revenue over a period which approximates the life of the underlying insurance in force. Since this obligation is not subject to limitations, it is not possible to determine the maximum potential amount due under this guarantee.
Guarantees of Asset Values
| December 31, | ||||||||||||||
| 2025 | 2024 | |||||||||||||
| (in thousands) | ||||||||||||||
| Guaranteed value of third-parties assets | $ | $ | ||||||||||||
| Fair value of collateral supporting these assets | $ | $ | ||||||||||||
| Asset (liability) associated with guarantee, carried at fair value | $ | $ | ||||||||||||
Certain contracts underwritten by Pruco Life include guarantees related to financial assets owned by the guaranteed party. These contracts are accounted for as derivatives and carried at fair value. The collateral supporting these guarantees is not reflected on the Consolidated Statements of Financial Position.
Contingent Liabilities
On an ongoing basis, the Company and its regulators review its operations including, but not limited to, sales and other customer interface procedures and practices, and procedures for meeting obligations to its customers and other parties. These reviews may result in the modification or enhancement of processes or the imposition of other action plans, including concerning management oversight, sales and other customer interface procedures and practices, and the timing or computation of payments to customers and other parties. In certain cases, if appropriate, the Company may offer customers or other parties remediation and may incur charges, including the cost of such remediation, administrative costs and regulatory fines.
The Company is subject to the laws and regulations of states and other jurisdictions concerning the identification, reporting and escheatment of unclaimed or abandoned funds, and is subject to audit and examination for compliance with these requirements
.
It is possible that the results of operations or the cash flows of the Company in a particular quarterly or annual period could be materially affected as a result of payments in connection with the matters discussed above or other matters depending, in part, upon the results of operations or cash flows for such period. Management believes, however, that ultimate payments in connection with these matters, after consideration of applicable reserves and rights to indemnification, should not have a material adverse effect on the Company’s financial position.
111
PRUCO LIFE INSURANCE COMPANY
Notes to Consolidated Financial Statements—(Continued)
Litigation and Regulatory Matters
The Company is subject to legal and regulatory actions in the ordinary course of its business. Pending legal and regulatory actions include proceedings specific to the Company and proceedings generally applicable to business practices in the industry in which it operates. The Company is subject to class action lawsuits and other litigation involving a variety of issues and allegations involving sales practices, claims payments and procedures, premium charges, policy servicing and breach of fiduciary duty to customers. The Company is also subject to litigation arising out of its general business activities, such as its investments, contracts, leases and labor and employment relationships, including claims of discrimination and harassment, and could be exposed to claims or litigation concerning certain business or process patents. In addition, the Company, along with other participants in the businesses in which it engages, may be subject from time to time to investigations, examinations and inquiries, in some cases industry-wide, concerning issues or matters upon which such regulators have determined to focus. In some of the Company’s pending legal and regulatory actions, parties are seeking large and/or indeterminate amounts, including punitive or exemplary damages. The outcome of litigation or a regulatory matter, and the amount or range of potential loss at any particular time, is often inherently uncertain.
The Company establishes accruals for litigation and regulatory matters when it is probable that a loss has been incurred and the amount of that loss can be reasonably estimated. For litigation and regulatory matters where a loss may be reasonably possible, but not probable, or is probable but not reasonably estimable, no accrual is established, but the matter, if material, is disclosed. The Company estimates that as of December 31, 2025, the aggregate range of reasonably possible losses in excess of accruals established for those litigation and regulatory matters for which such an estimate currently can be made is less than $100 million. This estimate is not an indication of expected loss, if any, or the Company's maximum possible loss exposure on such matters. The Company reviews relevant information with respect to its litigation and regulatory matters on a quarterly and annual basis and updates its accruals, disclosures and estimates of reasonably possible loss based on such reviews.
Individual Annuities and Individual Life
California Advocates for Nursing Home Reform v. The Prudential Insurance Company of America and Pruco Life Insurance Company, et al.
In January 2024, a putative class action complaint entitled California Advocates for Nursing Home Reform v. The Prudential Insurance Company of America and Pruco Life Insurance Company, et al., was filed in California Superior Court, Alameda County, alleging that the Company has failed to comply with California laws requiring that life insurance policies issued or delivered in California: (i) provide for a contractual 60-day grace period pre-lapse during which a policy must stay in force; (ii) provide policyholders and designees with notice of payment default within 30 days and a 30-day advance written notice of pending lapse; and (iii) notify policyholders annually of their right to designate additional recipients for lapse notices. The complaint asserts claims for violation of California’s Unfair Competition law ("UCL") and seeks unspecified damages along with declaratory and injunctive relief. In February 2024, defendants removed the action from California state court to the United States District Court for the Northern District of California. Plaintiff filed a motion to remand the action to the California Superior Court, Alameda County, and in December 2024, the motion was granted. In April 2025, Plaintiff filed a First Amended Complaint removing allegations related to the Unclaimed Life Insurance and Annuities Act, and the Defendant filed a demurrer seeking to dismiss the Amended Complaint. In October 2025, the Court issued an Order: (i) sustaining Defendant’s demurrer as to Plaintiff’s declaratory relief claim, and (ii) denying the demurrer as to the UCL claim.
Summary
The Company’s litigation and regulatory matters are subject to many uncertainties, and given their complexity and scope, their outcome cannot be predicted. It is possible that the Company’s results of operations or cash flows in a particular quarterly or annual period could be materially affected by an ultimate unfavorable resolution of pending litigation and regulatory matters depending, in part, upon the results of operations or cash flows for such period. In light of the unpredictability of the Company’s litigation and regulatory matters, it is also possible that in certain cases an ultimate unfavorable resolution of one or more pending litigation or regulatory matters could have a material adverse effect on the Company’s financial statements. Management believes, however, that, based on information currently known to it, the ultimate outcome of all pending litigation and regulatory matters, after consideration of applicable reserves and rights to indemnification, is not likely to have a material adverse effect on the Company’s financial statements.
112
PRUCO LIFE INSURANCE COMPANY
Schedule I
Summary of Investments Other Than Investments in Related Parties
December 31, 2025
(in thousands)
| Type of Investment | Amortized Cost or Cost | Fair Value | Amount Shown in the Balance Sheet | |||||||||||||||||
| Fixed maturities, available-for-sale: | ||||||||||||||||||||
| Bonds: | ||||||||||||||||||||
| U.S. Treasury securities and obligations of U.S. government authorities and agencies | $ | $ | $ | |||||||||||||||||
| Obligations of U.S. states and their political subdivisions | ||||||||||||||||||||
| Foreign governments | ||||||||||||||||||||
| Asset-backed securities | ||||||||||||||||||||
| Commercial mortgage-backed securities | ||||||||||||||||||||
| Residential mortgage-backed securities | ||||||||||||||||||||
| Public utilities | ||||||||||||||||||||
| All other corporate bonds | ||||||||||||||||||||
| Redeemable preferred stock | ||||||||||||||||||||
| Total fixed maturities, available-for-sale | $ | $ | $ | |||||||||||||||||
| Equity securities: | ||||||||||||||||||||
| Common stocks: | ||||||||||||||||||||
| Other common stocks | $ | $ | $ | |||||||||||||||||
| Mutual funds | ||||||||||||||||||||
| Non-redeemable preferred stocks | ||||||||||||||||||||
| Total equity securities, at fair value | $ | $ | $ | |||||||||||||||||
| Fixed maturities, trading | $ | $ | $ | |||||||||||||||||
| Commercial mortgage and other loans | ||||||||||||||||||||
| Policy loans | ||||||||||||||||||||
| Short-term investments | ||||||||||||||||||||
| Other invested assets | ||||||||||||||||||||
| Total investments | $ | $ | ||||||||||||||||||
113
PRUCO LIFE INSURANCE COMPANY
Schedule II
Condensed Financial Information of Registrant
Condensed Statements of Financial Position
December 31, 2025 and 2024
(in thousands, except share amounts)
| December 31, 2025 | December 31, 2024 | |||||||||||||
| ASSETS | ||||||||||||||
Fixed maturities, available-for-sale, at fair value (allowance for credit losses: 2025 – $ | $ | $ | ||||||||||||
Fixed maturities, trading, at fair value (amortized cost: 2025 – $ | ||||||||||||||
Equity securities, at fair value (cost: 2025 – $ | ||||||||||||||
| Policy loans | ||||||||||||||
Short-term investments (net of allowance for credit losses: 2025 – $ | ||||||||||||||
Commercial mortgage and other loans (net of $ | ||||||||||||||
Other invested assets (includes $ | ||||||||||||||
| Total investments | ||||||||||||||
| Cash and cash equivalents(1) | ||||||||||||||
| Deferred policy acquisition costs | ||||||||||||||
| Accrued investment income(1) | ||||||||||||||
Reinsurance recoverables and deposit receivables (net of $ | ||||||||||||||
| Investment in subsidiaries | ||||||||||||||
| Receivables from parent and affiliates | ||||||||||||||
| Deferred sales inducements | ||||||||||||||
| Income tax assets(1) | ||||||||||||||
| Market risk benefit assets | ||||||||||||||
| Other assets(1) | ||||||||||||||
| Separate account assets | ||||||||||||||
| TOTAL ASSETS | $ | $ | ||||||||||||
| LIABILITIES AND EQUITY | ||||||||||||||
| LIABILITIES | ||||||||||||||
| Policyholders’ account balances | $ | $ | ||||||||||||
| Future policy benefits | ||||||||||||||
| Market risk benefit liabilities | ||||||||||||||
| Cash collateral for loaned securities | ||||||||||||||
Reinsurance and funds withheld payables (includes $ | ||||||||||||||
| Payables to parent and affiliates(1) | ||||||||||||||
| Other liabilities(1) | ||||||||||||||
| Separate account liabilities | ||||||||||||||
| Total liabilities | ||||||||||||||
| EQUITY | ||||||||||||||
Common stock ($ | ||||||||||||||
| Additional paid-in capital | ||||||||||||||
| Retained earnings / (accumulated deficit) | ||||||||||||||
| Accumulated other comprehensive income (loss) | ( | |||||||||||||
| Total equity | ||||||||||||||
| TOTAL LIABILITIES AND EQUITY | $ | $ | ||||||||||||
(1) See Note 4 to the Consolidated Financial Statements for details of balances associated with variable interest entities.
See Notes to Condensed Financial Information of Registrant
114
PRUCO LIFE INSURANCE COMPANY
Schedule II
Condensed Financial Information of Registrant
Condensed Statements of Operations and Comprehensive Income (Loss)
Years Ended December 31, 2025, 2024, and 2023
(in thousands)
| 2025 | 2024 | 2023 | ||||||||||||||||||
| REVENUES | ||||||||||||||||||||
Premiums (includes $ | $ | $ | $ | |||||||||||||||||
| Policy charges and fee income | ||||||||||||||||||||
| Net investment income | ||||||||||||||||||||
| Asset administration fees | ||||||||||||||||||||
| Other income (loss) | ||||||||||||||||||||
| Realized investment gains (losses), net | ( | ( | ||||||||||||||||||
| Change in value of market risk benefits, net of related hedging gains (losses) | ( | ( | ( | |||||||||||||||||
| TOTAL REVENUES | ||||||||||||||||||||
| BENEFITS AND EXPENSES | ||||||||||||||||||||
| Policyholders’ benefits | ||||||||||||||||||||
| Change in estimates of liability for future policy benefits | ( | ( | ||||||||||||||||||
| Interest credited to policyholders’ account balances | ||||||||||||||||||||
| Amortization of deferred policy acquisition costs | ( | |||||||||||||||||||
| General, administrative and other expenses | ||||||||||||||||||||
| TOTAL BENEFITS AND EXPENSES | ||||||||||||||||||||
| INCOME (LOSS) FROM OPERATIONS BEFORE INCOME TAXES AND EQUITY IN EARNINGS OF SUBSIDIARIES AND OPERATING JOINT VENTURE | ||||||||||||||||||||
| Income tax expense (benefit) | ||||||||||||||||||||
| INCOME (LOSS) FROM OPERATIONS BEFORE EQUITY IN EARNINGS OF SUBSIDIARIES AND OPERATING JOINT VENTURE | ||||||||||||||||||||
| Equity in earnings of subsidiaries | ( | |||||||||||||||||||
| Equity in earnings of operating joint venture, net of taxes | ( | ( | ( | |||||||||||||||||
| NET INCOME (LOSS) | $ | $ | $ | |||||||||||||||||
| Other comprehensive income (loss), before tax: | ||||||||||||||||||||
| Net unrealized investment gains (losses) | ( | |||||||||||||||||||
| Interest rate remeasurement of future policy benefits | ( | ( | ||||||||||||||||||
| Gain (loss) from changes in non-performance risk on market risk benefits | ( | ( | ( | |||||||||||||||||
| Other | ( | ( | ||||||||||||||||||
| Total | ( | ( | ||||||||||||||||||
| Less: Income tax expense (benefit) related to other comprehensive income (loss) | ( | ( | ||||||||||||||||||
| Other comprehensive income (loss), net of taxes | ( | ( | ||||||||||||||||||
| Total comprehensive income (loss) | $ | $ | $ | |||||||||||||||||
See Notes to Condensed Financial Information of Registrant
115
PRUCO LIFE INSURANCE COMPANY
Schedule II
Condensed Financial Information of Registrant
Condensed Statements of Cash Flows
Years Ended December 31, 2025, 2024, and 2023
(in thousands)
| 2025 | 2024 | 2023 | ||||||||||||||||||
| CASH FLOWS FROM OPERATING ACTIVITIES: | ||||||||||||||||||||
| Net cash flows from (used in) operating activities | $ | $ | $ | |||||||||||||||||
| CASH FLOWS FROM INVESTING ACTIVITIES: | ||||||||||||||||||||
| Proceeds from the sale/maturity/prepayment of: | ||||||||||||||||||||
| Fixed maturities, available-for-sale | ||||||||||||||||||||
| Fixed maturities, trading | ||||||||||||||||||||
| Equity securities | ||||||||||||||||||||
| Policy loans | ||||||||||||||||||||
| Ceded policy loans | ( | ( | ( | |||||||||||||||||
| Short-term investments | ||||||||||||||||||||
| Commercial mortgage and other loans | ||||||||||||||||||||
| Other invested assets | ||||||||||||||||||||
| Notes receivable from parent and affiliates | ||||||||||||||||||||
| Payments for the purchase/origination of: | ||||||||||||||||||||
| Fixed maturities, available-for-sale | ( | ( | ( | |||||||||||||||||
| Fixed maturities, trading | ( | ( | ( | |||||||||||||||||
| Equity securities | ( | ( | ( | |||||||||||||||||
| Policy loans | ( | ( | ( | |||||||||||||||||
| Ceded policy loans | ||||||||||||||||||||
| Short-term investments | ( | ( | ( | |||||||||||||||||
| Commercial mortgage and other loans | ( | ( | ( | |||||||||||||||||
| Other invested assets | ( | ( | ( | |||||||||||||||||
| Notes receivable from parent and affiliates | ( | ( | ( | |||||||||||||||||
| Capital contributions to subsidiaries | ( | ( | ( | |||||||||||||||||
| Return of capital from subsidiaries | ||||||||||||||||||||
| Other, net | ( | ( | ||||||||||||||||||
| Cash flows from (used in) investing activities | ( | ( | ( | |||||||||||||||||
| CASH FLOWS FROM FINANCING ACTIVITIES: | ||||||||||||||||||||
| Policyholders’ account deposits | ||||||||||||||||||||
| Affiliated ceded policyholders’ account deposits | ( | ( | ( | |||||||||||||||||
| Policyholders’ account withdrawals | ( | ( | ( | |||||||||||||||||
| Affiliated ceded policyholders’ account withdrawals | ||||||||||||||||||||
| Contributed capital | ||||||||||||||||||||
| Return of capital | ( | ( | ||||||||||||||||||
| Other, net | ( | ( | ||||||||||||||||||
| Cash flows from (used in) financing activities | ||||||||||||||||||||
| NET INCREASE (DECREASE) IN CASH AND CASH EQUIVALENTS | ( | ( | ||||||||||||||||||
| CASH AND CASH EQUIVALENTS, BEGINNING OF YEAR | ||||||||||||||||||||
| CASH AND CASH EQUIVALENTS, END OF YEAR | $ | $ | $ | |||||||||||||||||
| SUPPLEMENTAL CASH FLOW INFORMATION | ||||||||||||||||||||
| Income taxes paid (refunded), net | $ | $ | $ | |||||||||||||||||
| Interest paid | $ | $ | $ | |||||||||||||||||
116
Significant Non-Cash Transactions
2025
"Cash flows from (used in) operating activities" for the year ended December 31, 2025 excludes certain non-cash activities in the amount of $(1,397 ) million related to the affiliated reinsurance transaction with The Prudential Insurance Company of America ("Prudential Insurance") effective October 1, 2025. See Note 12 for additional information.
2024
"Cash flows from (used in) operating activities" and "Cash flows from (used in) investing activities" for the year ended December 31, 2024, excludes certain non-cash activities in the amount of $(7,469 ) million primarily related to reinsurance recoverables and $6,722 million related to invested asset transfers, respectively. These transactions are associated with the unaffiliated reinsurance agreement with Wilton Reassurance Company and Wilton Reinsurance Bermuda Limited (collectively, "Wilton Re"), effective October 1, 2024. Associated with the transaction with Wilton Re, "Cash flows from (used in) operating activities" and "Cash flows from (used in) investing activities" for the year ended December 31, 2024, exclude largely offsetting affiliated non-cash activities in the amount of $7,190 million, primarily related to reinsurance recoverables and payables, and $(6,722 ) million related to invested asset transfers, respectively. These are related to the recapture of the risks associated with the business that had previously been reinsured with Prudential Arizona Reinsurance Universal Company ("PAR U") as well as assumption of those recaptured by Pruco Life Insurance Company of New Jersey from PAR U. See Note 12 for additional information.
"Cash flows from (used in) operating activities" for the year ended December 31, 2024 excludes certain non-cash activities in the amount of $(78 ) million related to the affiliated reinsurance transaction with Prudential Arizona Reinsurance Captive Company, effective October 1, 2024. See Note 12 for additional information.
"Cash flows from (used in) operating activities" for the year ended December 31, 2024 excludes certain non-cash activities in the amount of $936 million related to the affiliated reinsurance transaction with Prudential Universal Reinsurance Entity Company and The Prudential Insurance Company of America, effective January 1, 2024. See Note 12 for additional information.
"Cash flows from (used in) investing activities" and "Cash flows from (used in) financing activities" for the year ended December 31, 2024 excludes non-cash activities related to invested asset transfers in the amount of $416 million, related to capital contributions the Company received from Prudential Insurance. See Note 16 for additional information.
2023
"Cash flows from (used in) operating activities" for the year ended December 31, 2023 excludes certain non-cash activities in the amount of $475 million related to the novated indexed variable annuities under the reinsurance agreement with Fortitude Life Insurance & Annuity Company (“FLIAC”). See Note 12 for more details regarding this transaction.
See Notes to Condensed Financial Information of Registrant
117
PRUCO LIFE INSURANCE COMPANY
Schedule II
Condensed Financial Information of Registrant
Notes to Condensed Financial Information of Registrant
1.ORGANIZATION AND PRESENTATION
Pruco Life Insurance Company, (“Pruco Life”) is a wholly-owned subsidiary of The Prudential Insurance Company of America, which in turn is a direct wholly-owned subsidiary of Prudential Financial, Inc. Pruco Life is a stock life insurance company organized in 1971 under the laws of the State of Arizona. It is licensed to sell life insurance and annuities in the District of Columbia, Guam and in all states except New York, and sells such products primarily through affiliated and unaffiliated distributors.
The condensed financial information of Pruco Life should be read in conjunction with the consolidated financial statements of Pruco Life and its subsidiaries and the notes thereto (the “Consolidated Financial Statements”). The condensed financial statements of Pruco Life reflect its direct wholly-owned subsidiary and majority-owned subsidiaries using the equity method of accounting.
118
(This page is intentionally left blank.)
(This page is intentionally left blank.)
Index Strategies Available Under Prudential FlexGuard® Life IVUL
All dealers that effect transactions in these securities are required to deliver a prospectus.
You can call us at 800-778-2255 to ask us questions, request information about the Contract, and obtain copies of the SAI or other documents without charge. You can also view the SAI located with the prospectus at www.Prudential.com/eProspectus, or request a copy by writing to us at:
Pruco Life Insurance Company
213 Washington Street
Newark, New Jersey 07102

Registration No. 333-292812
PART II
INFORMATION NOT REQUIRED IN PROSPECTUS
ITEM 13. OTHER EXPENSES OF ISSUANCE AND DISTRIBUTION
The Registrant anticipates that it will incur the following approximate expenses in connection with the issuance and distribution of the securities to be registered.
| Item of Expense | Estimated Expense | |||||||
| Registration fees | $0.00 | |||||||
| Federal taxes | $12,500 per $1 million of premium payments | |||||||
| State taxes | $25,000 per $1 million of premium payments | |||||||
| Printing Costs | $15,000 | |||||||
| Legal Costs | $20,000 | |||||||
| Accounting Costs | $20,000 | |||||||
ITEM 14. INDEMNIFICATION OF DIRECTORS AND OFFICERS
The Registrant, in connection with certain affiliates, maintains various insurance coverages under which the underwriter and certain affiliated persons may be insured against liability which may be incurred in such capacity, subject to the terms, conditions, and exclusions of the insurance contracts.
Arizona, being the state of organization of Pruco Life Insurance Company ("Pruco Life"), permits entities organized under its jurisdiction to indemnify directors and officers with certain limitations. The relevant provisions of Arizona law permitting indemnification can be found in Section 10-850 et seq. of the Arizona Statutes Annotated. The text of Pruco Life's By-law, Article VIII, which relates to indemnification of officers and directors, is incorporated by reference to Exhibit Item 16.(a)(3B) on Form S-1, Registration No. 333-158229, filed March 27, 2009 on behalf of Pruco Life Variable Contract Real Property Account.
Insofar as indemnification for liabilities arising under the Securities Act of 1933 (the "Act") may be permitted to directors, officers and controlling persons of the Registrant pursuant to the foregoing provisions or otherwise, the Registrant has been advised that in the opinion of the Securities and Exchange Commission such indemnification is against public policy as expressed in the Act and is, therefore, unenforceable. In the event that a claim for indemnification against such liabilities (other than the payment by the Registrant of expenses incurred or paid by a director, officer or controlling person of the Registrant in the successful defense of any action, suit or proceeding) is asserted by such director, officer or controlling person in connection with the securities being registered, the Registrant will, unless in the opinion of its counsel the matter has been settled by controlling precedent, submit to a court of appropriate jurisdiction the question whether such indemnification by it is against public policy as expressed in the Act and will be governed by the final adjudication of such issue.
ITEM 15. RECENT SALES OF UNREGISTERED SECURITIES
Not Applicable.
ITEM 16. EXHIBITS AND FINANCIAL STATEMENT SCHEDULES
A.Exhibits
| 1 (a) | Incorporated by reference to Post-Effective Amendment No. 1 to Form N-6, Registration No. 333-158634, filed April 14, 2010, on behalf of the Pruco Life Variable Universal Account. | ||||||||||
| 3 (a) | Incorporated by reference to Registration Statement Form S-1, Registration Number 333-158229 filed March 27, 2009 on behalf of Pruco Life Variable Contract Real Property Account. | ||||||||||
| 3 (b) | Incorporated by reference to Registration Statement Form S-1, Registration Number 333-158229 filed March 27, 2009 on behalf of Pruco Life Variable Contract Real Property Account. | ||||||||||
II - 2
| 4 (a) | Incorporated by reference to Post-Effective Amendment No. 8 to Registration Statement Form N-6, Registration Number 333-281814, filed December 20, 2024, on behalf of the Pruco Life Variable Universal Account. | ||||||||||
| 4 (b) | Filed herewith. | ||||||||||
| 4 (c) | Filed herewith. | ||||||||||
| 5 | Filed herewith. | ||||||||||
| 21 | Filed herewith. | ||||||||||
| 23 (a) | Filed herewith. | ||||||||||
| 24 | Filed herewith. | ||||||||||
| 107 | Filed herewith. | ||||||||||
B. Financial Statement Schedules
Required financial statement schedules of Pruco Life Insurance Company are included in Part I of this registration statement.
II - 3
ITEM 17. UNDERTAKINGS
The undersigned registrant hereby undertakes:
(1) To file, during any period in which offers or sales are being made, a post-effective amendment to this registration statement:
(i)To include any prospectus required by Section 10 (a)(3) of the Securities Act of 1933;
(ii)To reflect in the prospectus any facts or events arising after the effective date of the registration statement (or the most recent post-effective amendment thereof) which, individually or in the aggregate, represent a fundamental change in the information set forth in the registration statement. Notwithstanding the foregoing, any increase or decrease in volume of securities offered (if the total dollar value of securities offered would not exceed that which was registered) and any deviation from the low or high end of the estimated maximum offering range may be reflected in the form of prospectus filed with the Commission pursuant to Rule 424(b) if, in the aggregate, the changes in volume and price represent no more than 20% change in the maximum aggregate offering price set forth in the "Calculation of Registration Fee" table in the effective registration statement; and
(iii)To include any material information with respect to the plan of distribution not previously disclosed in the registration statement or any material change to such information in the registration statement.
Provided, however, that paragraphs (a)(1)(i), (ii), and (iii) of this section do not apply if the information required to be included in a post-effective amendment by those paragraphs is contained in reports filed with or furnished to the Commission by the registrant pursuant to section 13 or section 15(d) of the Securities Exchange Act of 1934 (15 U.S.C. 78m or 78o(d)) that are incorporated by reference in the registration statement.
Provided, however, that paragraphs (a)(1)(i), (ii), and (iii) of this section do not apply if the information required to be included in a post-effective amendment by those paragraphs is contained in reports filed with or furnished to the Commission by the registrant pursuant to section 13 or section 15(d) of the Securities Exchange Act of 1934 (15 U.S.C. 78m or 78o(d)) that are incorporated by reference in the registration statement.
(2) That, for the purpose of determining any liability under the Securities Act of 1933, each such post-effective amendment shall be deemed to be a new registration statement relating to the securities offered therein, and the offering of such securities at that time shall be deemed to be the initial bona fide offering thereof.
(3) To remove from registration by means of a post-effective amendment any of the securities being registered which remain unsold at the termination of the offering.
(4) Not applicable.
(5) That, for the purpose of determining liability under the Securities Act of 1933 to any purchaser: each prospectus filed pursuant to Rule 424(b) as part of a registration statement relating to an offering, other than registration statements relying on Rule 430B or other than prospectuses filed in reliance on Rule 430A, shall be deemed to be part of and included in the registration statement as of the date it is first used after effectiveness; provided, however, that no statement made in a registration statement or prospectus that is part of the registration statement or made in a document incorporated or deemed incorporated by reference into the registration statement or prospectus that is part of the registration statement will, as to a purchaser with a time of contract of sale prior to such first use, supersede or modify any statement that was made in the registration statement or prospectus that was part of the registration statement or made in any such document immediately prior to such date of first use.
(6) That, for the purpose of determining liability of the registrant under the Securities Act of 1933 to any purchaser in the initial distribution of the securities:
(a) The undersigned registrant undertakes that in a primary offering of securities of the undersigned registrant pursuant to this registration statement, regardless of the underwriting method used to sell the securities to the purchaser, if the securities are offered or sold to such purchaser by means of any of the following communications, the undersigned registrant will be a seller to the purchaser and will be considered to offer or sell such securities to such purchaser: (i) Any preliminary prospectus or prospectus of the undersigned registrant relating to the offering required to be filed pursuant to Rule 424; (ii) Any free writing prospectus relating to the offering prepared by or on behalf of the undersigned registrant or used or referred to by the undersigned registrant; (iii) The portion of any other free writing prospectus relating to the offering containing material information about the undersigned registrant or its securities provided by or on behalf of the undersigned registrant; and (iv) Any other communication that is an offer in the offering made by the undersigned registrant to the purchaser.
(b) The undersigned registrant hereby undertakes that, for purposes of determining any liability under the Securities Act of 1933, each filing of the registrant's annual report pursuant to section 13(a) or section 15(d) of the Securities Exchange Act of 1934 (and,
II - 4
where applicable, each filing of an employee benefit plan's annual report pursuant to section 15(d) of the Securities Exchange Act of 1934) that is incorporated by reference in the registration statement shall be deemed to be a new registration statement relating to the securities offered therein, and the offering of such securities at that time shall be deemed to be the initial bona fide offering thereof.
(c) – (h) Not Applicable.
II - 5
SIGNATURES
Pursuant to the requirements of the Securities Act of 1933, the registrant has duly caused this registration statement to be signed on its behalf by the undersigned, thereunto duly authorized, in the State of New Jersey, on the 20th day of April, 2026.
Pruco Life Insurance Company | |||||
| (Registrant) | |||||
By: /s/ * Scott E. Gaul Director, President, and Chief Executive Officer | |||||
Pursuant to the requirements of the Securities Act of 1933, this registration statement has been signed below by the following persons in the capacities indicated on this 20th day of April, 2026.
| Signature and Title | ||||||||
| /s/ * | ||||||||
| Reshma V. Abraham | ||||||||
| Director and Vice President | ||||||||
| /s/ * | ||||||||
| Markus Coombs | ||||||||
| Director, Vice President, Chief Financial Officer, and Chief Accounting Officer | ||||||||
| /s/ * | ||||||||
| Alan M. Finkelstein | ||||||||
| Director and Treasurer | ||||||||
| By: | /s/ Christopher J. Madin April 20, 2026 | |||||||
| /s/ * | Christopher J. Madin Date | |||||||
| Scott E. Gaul | (Attorney-in-Fact) | |||||||
| Director, President, and Chief Executive Officer | ||||||||
| /s/ * | ||||||||
| Bradley O. Harris | ||||||||
| Director | ||||||||
| /s/ * | ||||||||
| Salene Hitchcock-Gear | ||||||||
| Director | ||||||||
*Executed by Christopher J. Madin on behalf of those indicated pursuant to Power of Attorney.
II - 6
EXHIBIT INDEX
Item 16.
| Number | Exhibit Description | ||||
| 4 (b) | Application | ||||
| 4 (c) | Supplement to Application | ||||
| (5) | Legal Consent | ||||
| (21) | Subsidiaries of Registrant | ||||
| 23 (a) | Auditor Consent | ||||
| (24) | Powers of Attorney | ||||
| (107) | Filing Fee Table | ||||
II - 7