CONFERENCE CALL SLIDES
Published on
Exhibit 99.1

Prudential Financial, Inc.
Acquisition of CIGNA Retirement Business
Presentation to Investors
November 2003

Forward Looking Statements
Certain of the
statements included in the following presentation constitute forward-looking
statements within the meaning of the U. S. Private Securities Litigation Reform Act of 1995. Words
such as “expects,” “believes,”
“anticipates,” “includes,” “plans,” “assumes,” “estimates,”
“projects,” “intends,” or variations of such words are generally part of forward-looking
statements.
Forward-looking statements are made based on management’s current expectations and beliefs
concerning future developments and their potential effects upon Prudential Financial, Inc. and its
subsidiaries. There can be no assurance that future developments affecting Prudential Financial, Inc.
and its subsidiaries will be those anticipated by management. These forward-looking statements are
not a
guarantee of future performance and involve risks and uncertainties, and there are certain
important factors that could cause actual results to differ, possibly materially, from expectations or
estimates reflected in such forward-looking
statements, including without limitation: general
economic, market and political conditions, including the performance of financial markets, interest
rate fluctuations and the economic environment; various domestic or international military
or terrorist
activities or conflicts; volatility in the securities markets; reestimates of our reserves for future policy
benefits and claims; changes in our assumptions related to deferred policy acquisition costs; our
exposure to
contingent liabilities; catastrophe losses; investment losses and defaults; changes in our
claims-paying or credit ratings; competition in our product lines and for personnel; fluctuations in
foreign currency exchange rates and foreign
securities markets; risks to our international operations;
the impact of changing regulation or accounting practices; the risk that the retirement businesses of
CIGNA and Prudential Financial, Inc. will not be integrated successfully or
that the integration may be
more time consuming or costly than we expect; the risks that expected cost savings from the
transaction may not emerge as anticipated, that customer loss may be more adverse than we expect
and that revenues
following the transaction may be lower than we anticipate; Prudential Financial,
Inc.’s primary reliance, as a holding company, on dividends from its subsidiaries to meet debt
payment obligations and the applicable regulatory
restrictions on the ability of the subsidiaries to pay
such dividends; adverse litigation results; and changes in tax law. Prudential Financial, Inc. does not
intend, and is under no obligation, to update any particular
forward-looking statement included in this
presentation. The information referred to above, as well as the risks of our businesses described in
our Annual Report on Form 10-K for the year ended December 31, 2002, should be
considered by
readers when reviewing forward-looking statements contained in this presentation.

Non – GAAP Measure
In managing our
businesses, we use a non-GAAP measure we call “adjusted operating
income” to measure the performance of our Financial Services Businesses. Our goals for
return on equity (ROE), after-tax earnings and earnings per share
(EPS) contributions are
based on after-tax adjusted operating income and attributed equity of our Financial
Services Businesses. Adjusted operating income, which is not measured in accordance
with generally accepted accounting
principles (GAAP), excludes net realized investment
gains (losses). A significant element of realized losses is impairments and losses from
sales of credit-impaired securities, the timing of which depends largely on market credit
cycles and can vary considerably across periods. The timing of other sales that would
result in gains or losses is largely subject to our discretion and influenced by market
opportunities. The fluctuating effects of
these transactions could distort trends in the
underlying profitability of our businesses. Adjusted operating income also excludes the
results of divested businesses, which are not relevant to our ongoing operations, and
certain other items, described in our Annual Report on Form 10-K. Because we do not
predict future realized investment gains (losses), we cannot provide measures of our goals
based on income from continuing operations of the
Financial Services Businesses, which
is the GAAP measure most comparable to adjusted operating income.
For additional information about adjusted operating income, the comparable GAAP
measure and a reconciliation between the two, please refer to our Annual Report on Form
10-K and our Quarterly Report on Form 10-Q for the quarter ended September 30, 2003 on
the Investor Relations Web site at http://www.investor.prudential.com.
Additional historical information relating to the
Company’s financial performance is also
located on the Investor Relations Web site.

Prudential to acquire
CIGNA
Retirement for $2.1 billion
Expected to close first half, 2004
Major step toward goal of 12% ROE by 2005 (1)
CIGNA Retirement: $50 billion in defined contribution /
defined
benefit assets (2)
CIGNA Retirement will be a subsidiary of Prudential Insurance
(1)
Based on after-tax adjusted operating income
(2)
As of September 30, 2003; includes guaranteed investment contracts and investment advisory accounts
Creates a leading retirement market provider
Acquisition funded with general account assets

Transaction features
No new borrowings or equity issued
Business capitalized with $840 million statutory surplus at closing (1)
Prudential Insurance pro-forma RBC consistent with ratings goal
Modest integration risk
Exposure to pre-close liabilities for industry practices issues limited under risk-sharing agreement ($200 million cap for 4 years)
Indemnification for breaches of representations and warranties
(75% purchase price cap)
(1)
Includes statutory asset valuation reserve.

Financial benefits
Expected 12% - 13% return on equity(1) (2)
Effective capital redeployment enhances overall returns
Targeted $110 million of expense saves (20% of combined
expense base) contribute to expected returns (2) (3)
Dividend capacity of Prudential Insurance enhanced by
$200 million expected annual cash flow (2)
Estimated 2004 EPS contribution of 10
to 15 cents per
common share, after integration costs (4)
Expected to add $150 million of after-tax earnings in 2005(4)
(1)
Based on after-tax adjusted operating income and estimated required equity
(2)
After two year integration period
(3)
Expense save target on pre-tax basis
(4)
Based on after-tax adjusted operating income; assumes closing date of March 31, 2004

Strategic benefits
Doubles our defined contribution record keeping business, increasing
participants from one million to two million
Adds established benefit consultant channel
Adds strong 401(k) and
Taft-Hartley presence to our strengths in
403(b) and 457 market segments
Adds total retirement outsourcing capabilities
Creates a leading retirement market provider
Strong fit with our existing skill sets
Stable value and guaranteed product manufacturing
Broad asset management capabilities
Actuarial risk management capabilities

Retirement
market : Increasingly
important in asset gathering
Market is estimated at $16 trillion, or one-third of
$48 trillion of US individual total wealth
Retirement assets represent the single
largest
component of asset flows in the US marketplace
Retirement market projected to grow to $39 trillion
by 2012 (9% CAGR)

Attractive return on investment
Annual
$ 200
$ 149
9 Months
12 % - 13%
Expected return on
required equity (3)
--
--
--
Purchase Accounting
--
--
--
Integration costs
$ 75
--
--
Cost savings
$ 200
$ 149
Historical basis
After–tax income: (2)
$ 48
$ 50
Account values (1)
After
Integration
period
2002
2003
(1)
At end of period; in billions
(2)
Adjusted operating income basis; excludes realized investment gains and losses
(3)
Based on after-tax adjusted operating income and estimated required equity
CIGNA Retirement
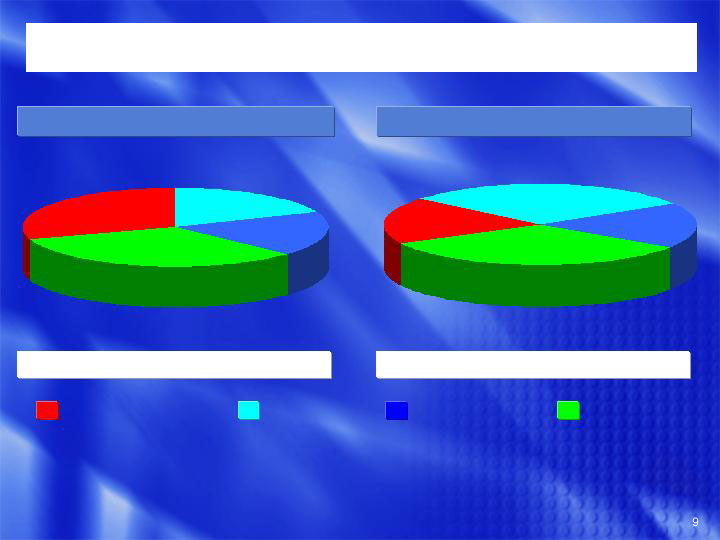
Capital deployment (1)
(1)
$ billions; based on September 30, 2003 data for Financial Services Businesses, excluding FAS 115; “pro-forma”
includes estimated required equity for the combined retirement business
Attributed equity: $18.4 billion
Corporate & Other
Investment
International
Insurance
$ 5.5
$ 3.4
$ 3.4
$ 6.1
$ 3.4
$ 5.5
$ 3.4
$ 6.1
Reported
Pro forma
Attributed equity: $18.4 billion

Scale in businesses we know
September 30, 2003 ($ billions)
$ 117
$ 67
$ 50
Total
61
40
21
Defined Benefit
/
Guaranteed Products (2)
$ 56
$ 27
$ 29
Defined Contribution
Account values:
# 8
# 20
# 16
Ranking (1)
2.2 million
1.1 million
1.1 million
Defined contribution participants
Combined
Prudential
CIGNA
(1)
Based on PlanSponsor Magazine June 2003 survey of defined contribution record keeping assets
(2)
Includes guaranteed investment contracts and investment advisory accounts

$18 billion stable value balances
are major
source of earnings
Low risk profile: about 90% of balances experience-
rated with client sharing investment risk
Rate resets semi-annually on most products
Future crediting rates typically reflect prior experience
Low interest-rate floors
CIGNA stable value characteristics

Assets under management
CIGNA Retirement
Prudential Financial
Combined
As of September 30, 2003
Public Fixed Income
Private Fixed Income
Equity
Mortgages
International
Non proprietary insurance, annuity & other
Real Estate
$ 52 billion AUM
$ 473 billion AUM
$ 421 billion AUM
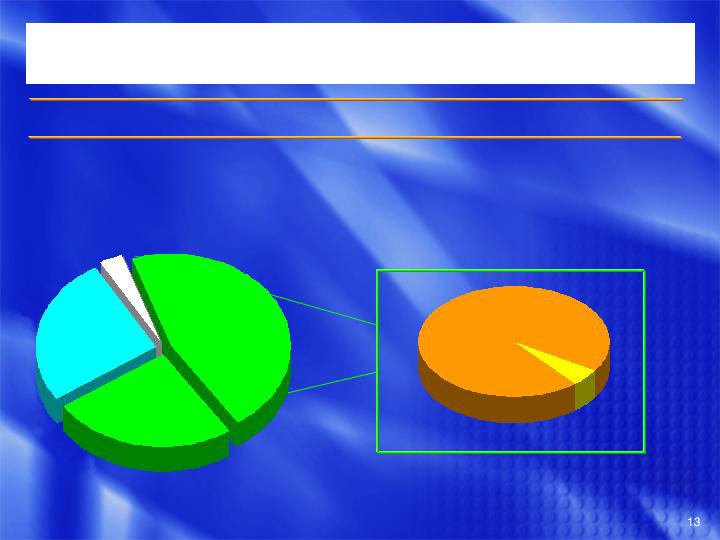
High quality general account
CIGNA Retirement
General Account
$ 23 billion
As of September 30, 2003
CIGNA Public and Private Fixed
Income Portfolio
$ 16 billion
Public Fixed
Income
46%
Private Fixed
Income
24%
Commercial
Mortgages
26%
Real
Estate /
Other
4%
Investment grade
96%
Below investment
grade
4%

Summary
Major step toward goal of 12% ROE by 2005 (1)
Accretive to EPS in 2004; adds $150
million after-
tax earnings in 2005 (1) (2)
Creates a leading retirement market provider
Enhances statutory earnings and cash flow
No impact on share repurchase program “base
case”
(1)
Based on after-tax adjusted operating income
(2)
Assumes closing date of March 31, 2004