SLIDE PRESENTATION OF PRUDENTIAL FINANCIAL, INC.
Published on
Exhibit 99.0
Tokyo Investor Day
September 23, 2004 Tokyo, Japan
Forward Looking Statements and
Non-GAAP Measure
We will make some forward-looking statements in the following presentations. It is possible that actual results may differ materially from the predictions we make today. Additional information regarding factors that could cause such a difference appears in the section titled “Forward-Looking Statements” of our earnings press release for the second quarter of 2004, which can be found on our Web site at www.investor.prudential.com.
In managing our businesses, we use a non-GAAP measure we call “adjusted operating income” to measure the performance of our Financial Services Businesses (FSB). Return on equity for the businesses of the International Insurance and Investments Division is based on equity (excluding unrealized gains/losses on investments) and after-tax adjusted operating income (based on the effective tax rate applicable to adjusted operating income of the FSB as a whole for the period or periods indicated). Adjusted operating income excludes net realized investment gains/losses and related charges and adjustments, and results from divested businesses. Adjusted operating income also excludes discontinued operations, an extraordinary gain in the second quarter of 2004 on an acquisition, and a charge in the first quarter of 2004 for the cumulative effect of an accounting change, which are presented as separate components of net income under GAAP. In the second quarter of 2004, as a result of the acquisition of the retirement business of CIGNA Corporation, the definition of adjusted operating income was modified to exclude recorded changes in asset values that will ultimately inure to contractholders and recorded changes in contractholder liabilities resulting from changes in related asset values. For additional information about adjusted operating income and the comparable GAAP measure please refer to our Annual Report on Form 10-K for 2003 and our Quarterly Report on Form 10-Q for the quarter ended June 30, 2004, on the Investor Relations Web site at http://www.investor.prudential.com.
Additional historical information relating to the Company’s financial performance, including its second quarter 2004 Quarterly Financial Supplement, is also located on the Investor Relations Web site.
Tokyo Investor Day 9.23.04
1
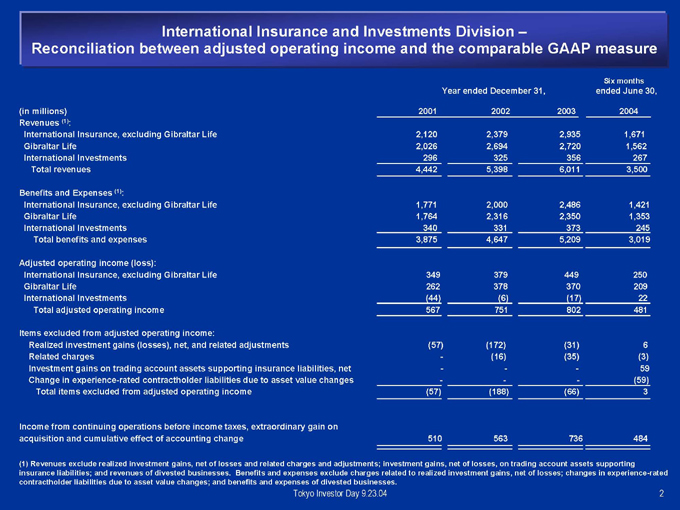
International Insurance and Investments Division –
Reconciliation between adjusted operating income and the comparable GAAP measure
Year ended December 31,
Six months ended June 30,
(in millions) 2001 2002 2003 2004 Revenues (1): International Insurance, excluding Gibraltar Life 2,120 2,379 2,935 1,671 Gibraltar Life 2,026 2,694 2,720 1,562 International Investments 296 325 356 267 Total revenues 4,442 5,398 6,011 3,500
Benefits and Expenses (1):
International Insurance, excluding Gibraltar Life 1,771 2,000 2,486 1,421 Gibraltar Life 1,764 2,316 2,350 1,353 International Investments 340 331 373 245 Total benefits and expenses 3,875 4,647 5,209 3,019
Adjusted operating income (loss):
International Insurance, excluding Gibraltar Life 349 379 449 250 Gibraltar Life 262 378 370 209 International Investments (44) (6) (17) 22 Total adjusted operating income 567 751 802 481
Items excluded from adjusted operating income:
Realized investment gains (losses), net, and related adjustments (57) (172) (31) 6 Related charges - (16) (35) (3) Investment gains on trading account assets supporting insurance liabilities, net - - - 59 Change in experience-rated contractholder liabilities due to asset value changes - - - (59) Total items excluded from adjusted operating income (57) (188) (66) 3
Income from continuing operations before income taxes, extraordinary gain on acquisition and cumulative effect of accounting change 510 563 736 484
(1) Revenues exclude realized investment gains, net of losses and related charges and adjustments; investment gains, net of losses, on trading account assets supporting insurance liabilities; and revenues of divested businesses. Benefits and expenses exclude charges related to realized investment gains, net of losses; changes in experience-rated contractholder liabilities due to asset value changes; and benefits and expenses of divested businesses.
Tokyo Investor Day 9.23.04
2

International Division
Rodger Lawson
Vice Chairman
International Insurance and Investments Division
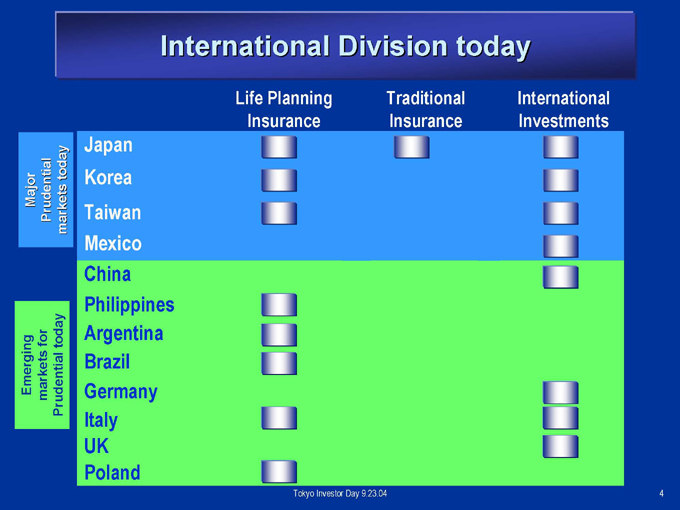
International Division today
Life Planning Insurance
Traditional Insurance
International Investments
Major Prudential markets today
Emerging markets for Prudential today
Japan Korea Taiwan Mexico China Philippines Argentina Brazil Germany Italy UK Poland
Tokyo Investor Day 9.23.04
4
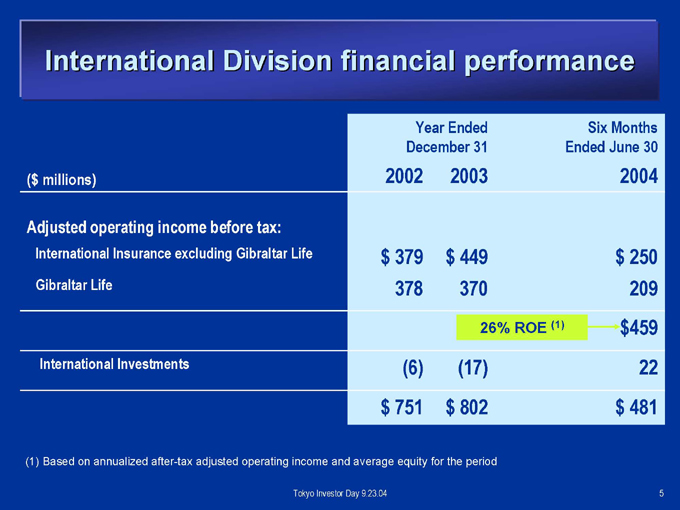
International Division financial performance
Year Ended December 31
Six Months Ended June 30
($ millions) 2002 2003 2004
Adjusted operating income before tax:
International Insurance excluding Gibraltar Life $379 $449 $250 Gibraltar Life 378 370 209
26% ROE (1) $459
International Investments (6) (17) 22
$751 $802 $481
(1) Based on annualized after-tax adjusted operating income and average equity for the period
Tokyo Investor Day 9.23.04
5
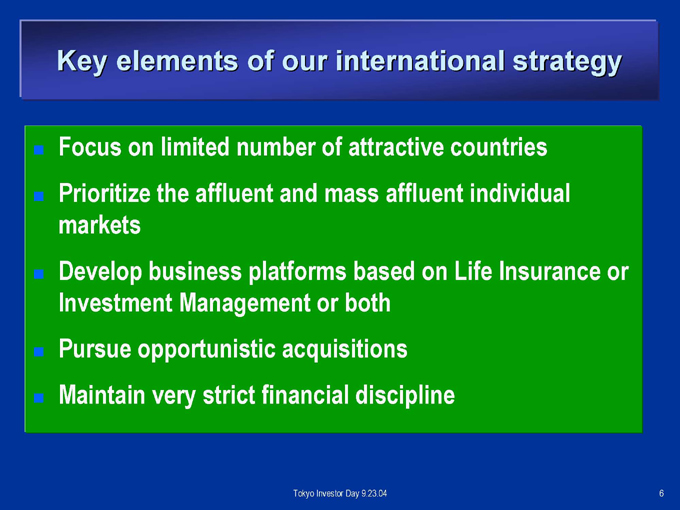
Key elements of our international strategy
Focus on limited number of attractive countries Prioritize the affluent and mass affluent individual markets Develop business platforms based on Life Insurance or Investment Management or both Pursue opportunistic acquisitions Maintain very strict financial discipline
Tokyo Investor Day 9.23.04
6

Life Planning insurance
Value Proposition – Life Planners
A highly trained, professional field force focused on providing life insurance plans tailored to the specific needs of each individual client
Competitive Advantage
Client focus
Needs based selling
Industry leadership service capability
Product Strategy
Focuses on protection life insurance in a predominantly standardized product environment
Tokyo Investor Day 9.23.04
7
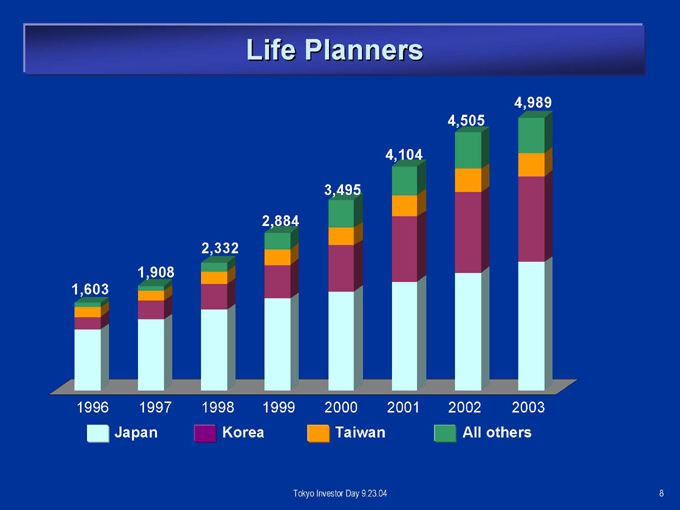
Life Planners
1,603
1,908
2,332
2,884
3,495
4,104
4,505
4,989
1996 1997 1998 1999 2000 2001 2002 2003
Japan Korea Taiwan All others
Tokyo Investor Day 9.23.04
8
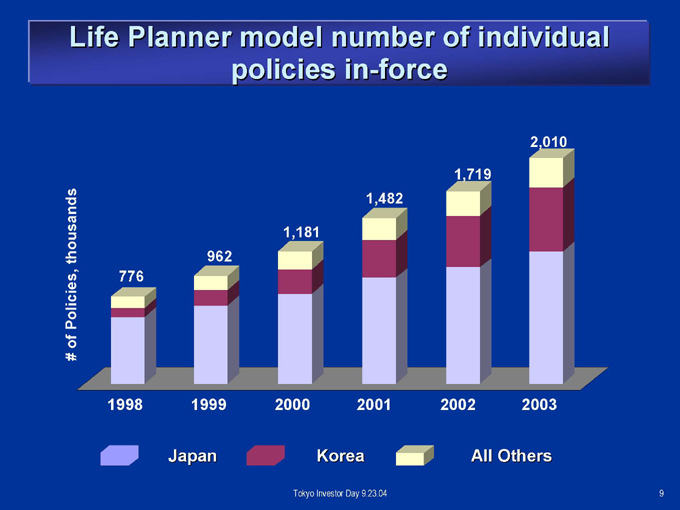
Life Planner model number of individual policies in-force
# of Policies, thousands
776
962
1,181
1,482
1,719
2,010
1998 1999 2000 2001 2002 2003
Japan Korea All Others
Tokyo Investor Day 9.23.04
9
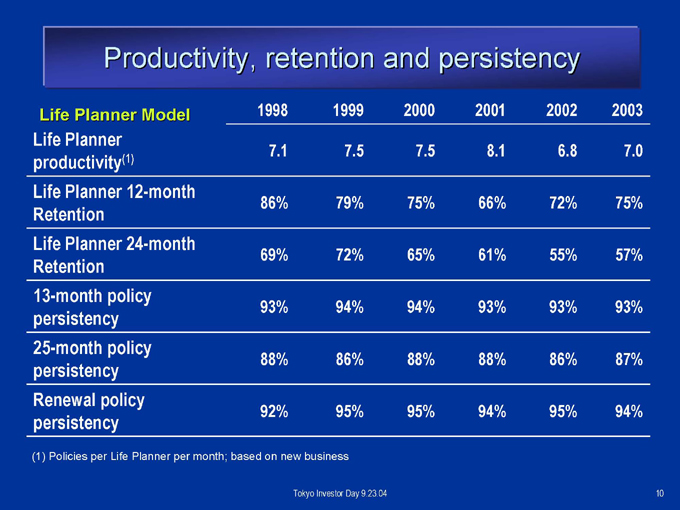
Productivity, retention and persistency
Life Planner Model 1998 1999 2000 2001 2002 2003
Life Planner
7.1 7.5 7.5 8.1 6.8 7.0 productivity(1) Life Planner 12-month
86% 79% 75% 66% 72% 75%
Retention
Life Planner 24-month
69% 72% 65% 61% 55% 57%
Retention 13-month policy
93% 94% 94% 93% 93% 93% persistency 25-month policy
88% 86% 88% 88% 86% 87% persistency Renewal policy
92% 95% 95% 94% 95% 94% persistency
(1) Policies per Life Planner per month; based on new business
Tokyo Investor Day 9.23.04
10
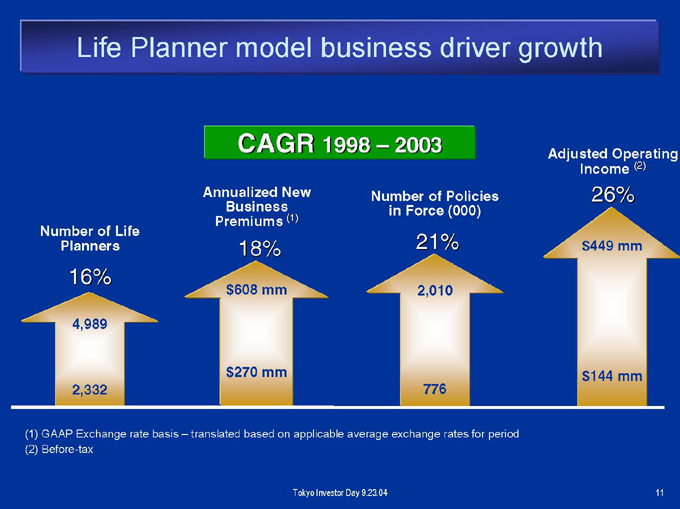
Life Planner model business driver growth
CAGR 1998 – 2003
Number of Life Planners
16%
Annualized New Business Premiums (1)
18%
Number of Policies in Force (000)
21%
Adjusted Operating Income (2)
26%
4,989
2,332 $608 mm
$270 mm
2,010
776 $449 mm
$144 mm
(1) GAAP Exchange rate basis – translated based on applicable average exchange rates for period (2) Before-tax
Tokyo Investor Day 9.23.04
11
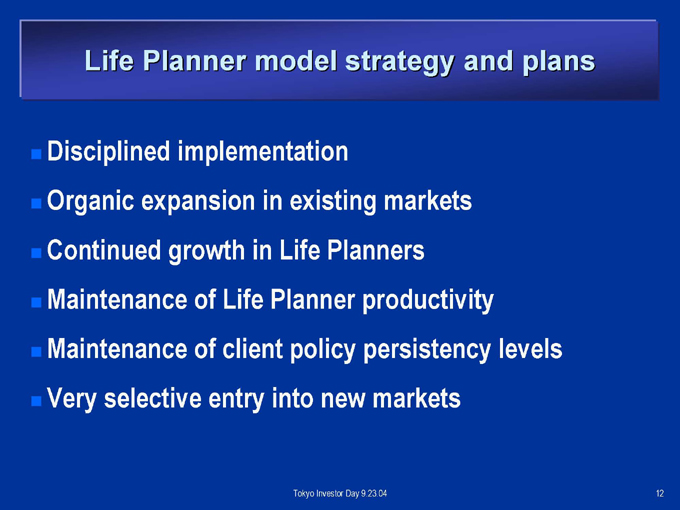
Life Planner model strategy and plans
Disciplined implementation
Organic expansion in existing markets Continued growth in Life Planners Maintenance of Life Planner productivity Maintenance of client policy persistency levels Very selective entry into new markets
Tokyo Investor Day 9.23.04
12
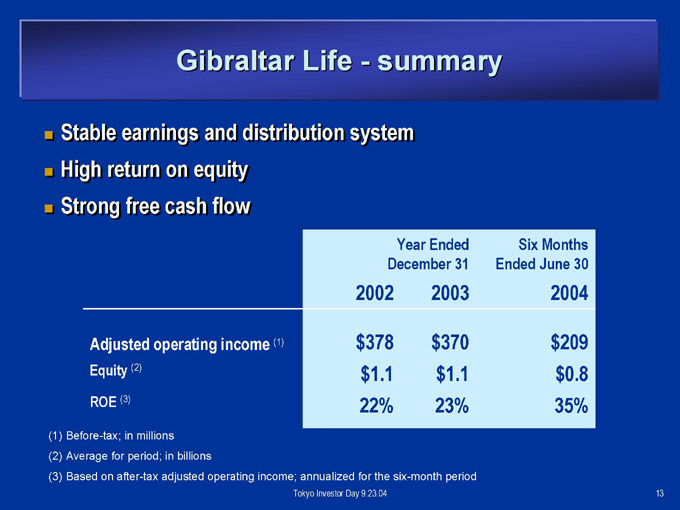
Gibraltar Life - summary
Stable earnings and distribution system High return on equity Strong free cash flow
Year Ended December 31
Six Months Ended June 30
2002 2003 2004
Adjusted operating income (1) $378 $370 $209
Equity (2) $1.1 $1.1 $0.8 ROE (3) 22% 23% 35%
(1) Before-tax; in millions (2) Average for period; in billions
(3) Based on after-tax adjusted operating income; annualized for the six-month period
Tokyo Investor Day 9.23.04
13
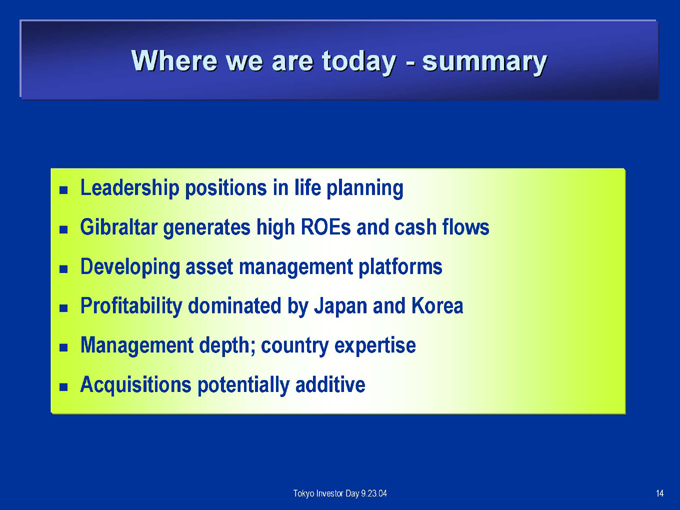
Where we are today - - summary
Leadership positions in life planning
Gibraltar generates high ROEs and cash flows Developing asset management platforms Profitability dominated by Japan and Korea Management depth; country expertise Acquisitions potentially additive
Tokyo Investor Day 9.23.04
14

International Insurance Finance
John Hanrahan
Chief Financial Officer International Insurance
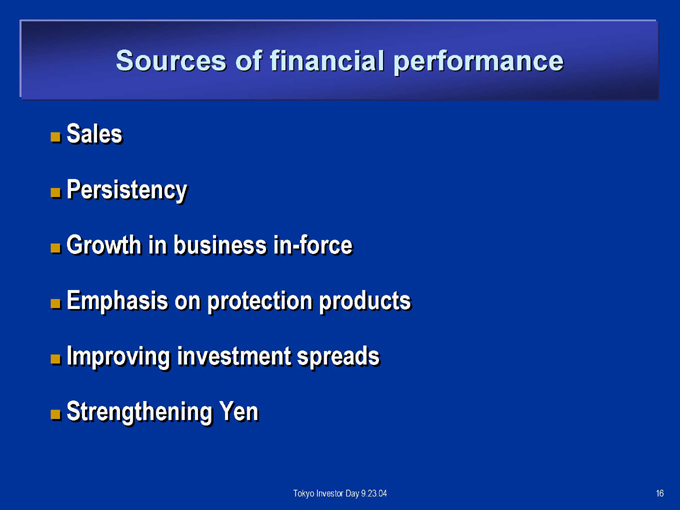
Sources of financial performance
Sales Persistency
Growth in business in-force Emphasis on protection products Improving investment spreads Strengthening Yen
Tokyo Investor Day 9.23.04
16
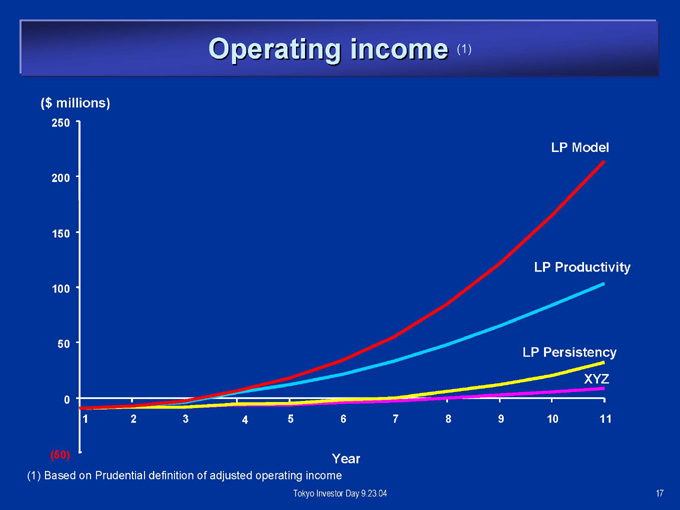
Operating income (1)
($ millions)
250 200 150 100 50 0 (50)
1 2 3 4 5 6 7 8 9 10 11
LP Model
LP Productivity
LP Persistency XYZ
Year
(1) Based on Prudential definition of adjusted operating income
Tokyo Investor Day 9.23.04
17
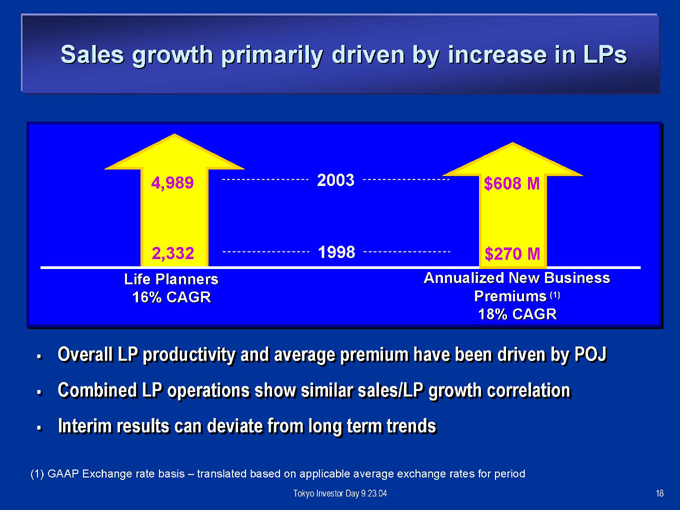
Sales growth primarily driven by increase in LPs
4,989
2,332
Life Planners 16% CAGR
2003
1998 $608 M
$270 M
Annualized New Business Premiums (1) 18% CAGR
Overall LP productivity and average premium have been driven by POJ Combined LP operations show similar sales/LP growth correlation Interim results can deviate from long term trends
(1) GAAP Exchange rate basis – translated based on applicable average exchange rates for period
Tokyo Investor Day 9.23.04
18
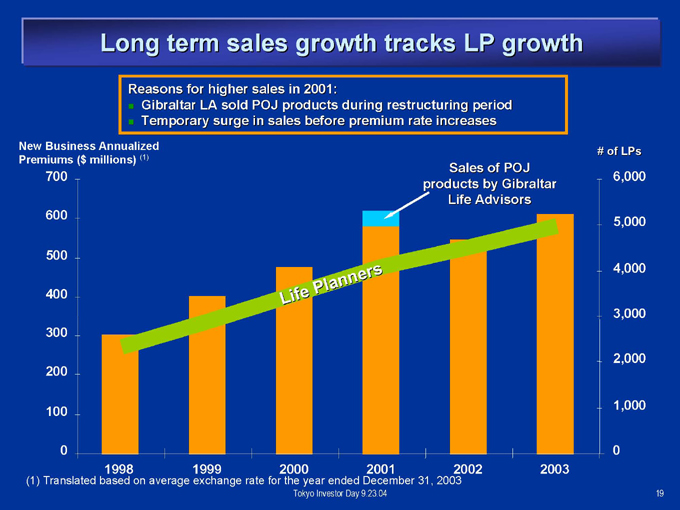
Long term sales growth tracks LP growth
Reasons for higher sales in 2001:
Gibraltar LA sold POJ products during restructuring period Temporary surge in sales before premium rate increases
New Business Annualized Premiums ($ millions) (1)
700 600 500 400 300 200 100 0
Sales of POJ products by Gibraltar Life Advisors
Life
Planners
# of LPs
6,000 5,000 4,000 3,000 2,000 1,000 0
1998 1999 2000 2001 2002 2003
(1) Translated based on average exchange rate for the year ended December 31, 2003
Tokyo Investor Day 9.23.04
19
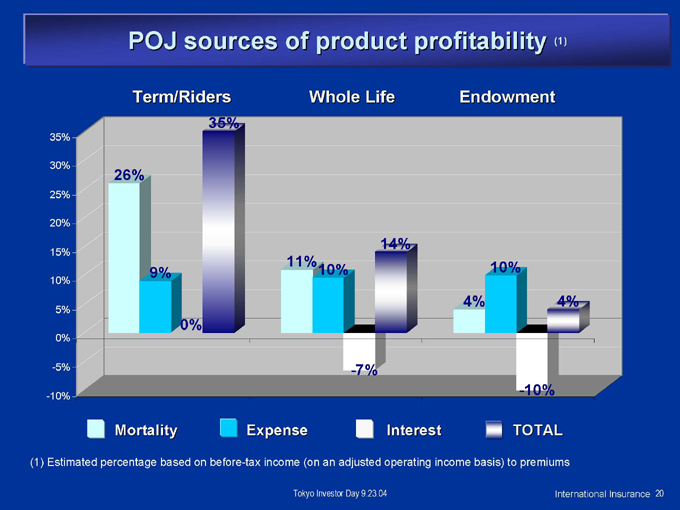
POJ sources of product profitability (1)
Term/Riders Whole Life Endowment
35%
30%
25%
20%
15%
10%
5%
0%
-5%
-10%
26%
9%
35%
11%
10%
14%
4%
10%
4%
-7%
-10%
Mortality Expense Interest TOTAL
(1) Estimated percentage based on before-tax income (on an adjusted operating income basis) to premiums
Tokyo Investor Day 9.23.04
International Insurance 20
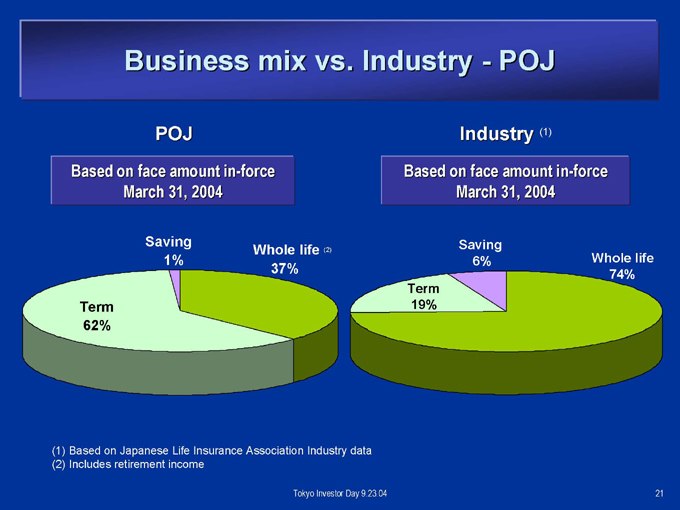
Business mix vs. Industry - POJ
POJ
Based on face amount in-force March 31, 2004
Industry (1)
Based on face amount in-force March 31, 2004
Saving 1%
Whole life (2) 37%
Term 62%
Term 19%
Saving 6%
Whole life 74%
(1) Based on Japanese Life Insurance Association Industry data (2) Includes retirement income
Tokyo Investor Day 9.23.04
21
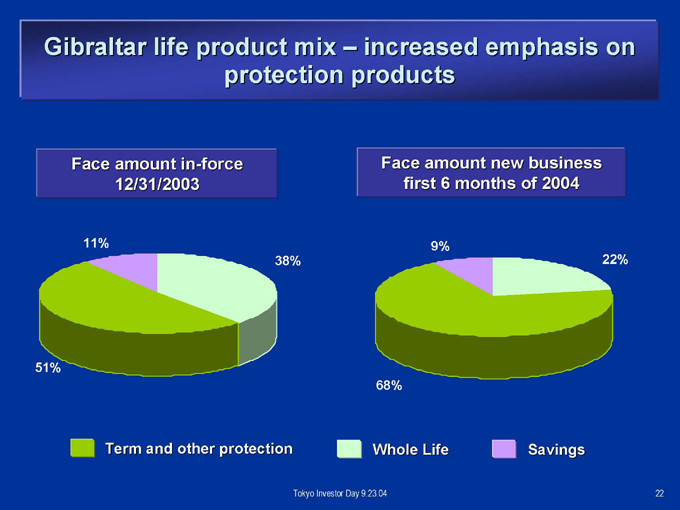
Gibraltar life product mix – increased emphasis on protection products
Face amount in-force 12/31/2003
Face amount new business first 6 months of 2004
11%
38%
51%
9%
22%
68%
Term and other protection Whole Life Savings
Tokyo Investor Day 9.23.04
22
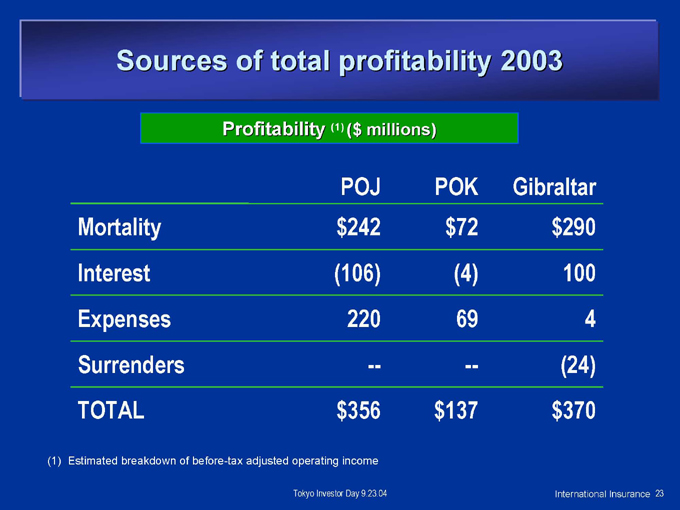
Sources of total profitability 2003
Profitability (1) ($ millions)
POJ POK Gibraltar Mortality $242 $72 $290 Interest (106) (4) 100 Expenses 220 69 4 Surrenders — — (24) TOTAL $356 $137 $370
(1) Estimated breakdown of before-tax adjusted operating income
Tokyo Investor Day 9.23.04
International Insurance 23
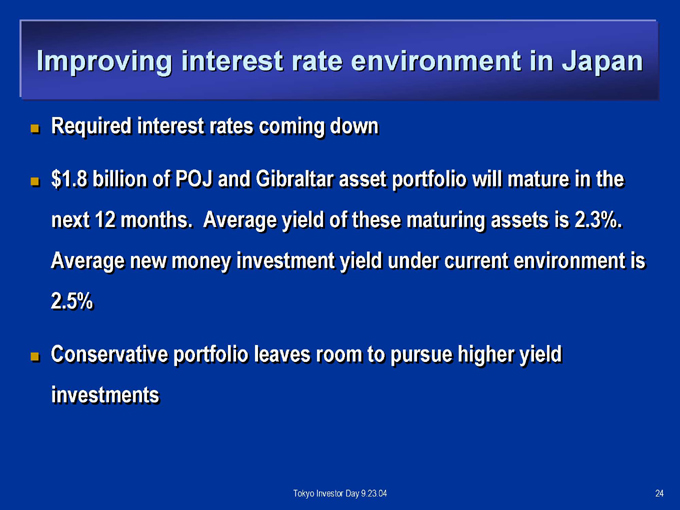
Improving interest rate environment in Japan
Required interest rates coming down
$1.8 billion of POJ and Gibraltar asset portfolio will mature in the next 12 months. Average yield of these maturing assets is 2.3%. Average new money investment yield under current environment is 2.5% .
Conservative portfolio leaves room to pursue higher yield investments
Tokyo Investor Day 9.23.04
24
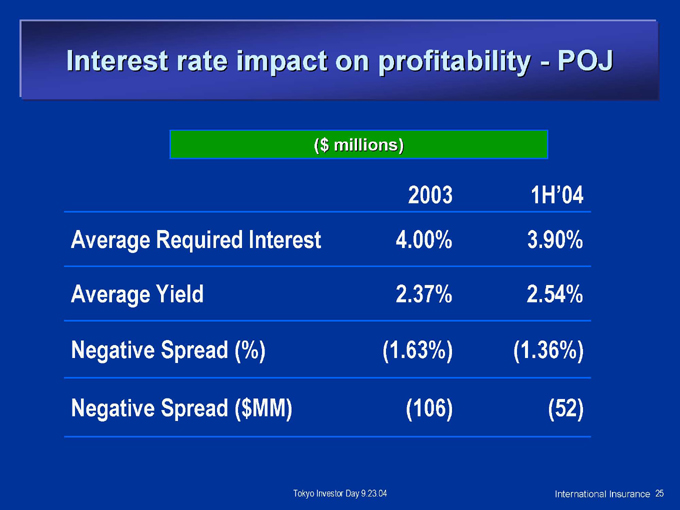
Interest rate impact on profitability - POJ
($ millions)
2003 1H’04 Average Required Interest 4.00% 3.90%
Average Yield 2.37% 2.54% Negative Spread (%) (1.63%) (1.36%) Negative Spread ($MM) (106) (52)
Tokyo Investor Day 9.23.04
International Insurance 25
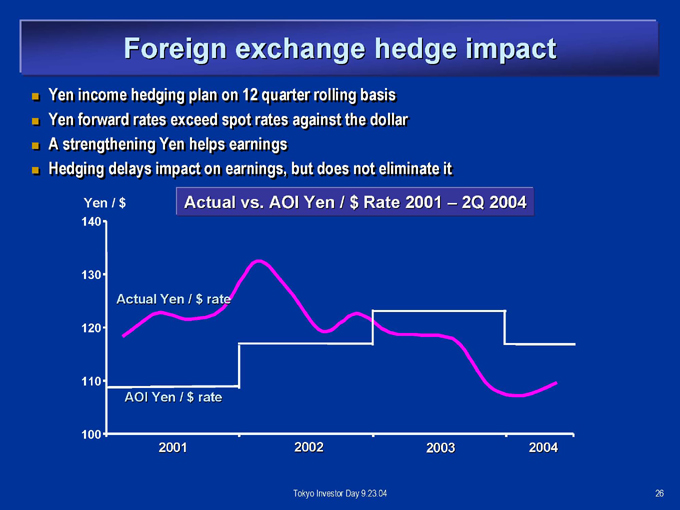
Foreign exchange hedge impact
Yen income hedging plan on 12 quarter rolling basis Yen forward rates exceed spot rates against the dollar A strengthening Yen helps earnings Hedging delays impact on earnings, but does not eliminate it
Yen / $ Actual vs. AOI Yen / $ Rate 2001 – 2Q 2004
140 130 120 110 100
Actual Yen / $ rate
AOI Yen / $ rate
2001 2002 2003 2004
Tokyo Investor Day 9.23.04
26

Strong capital position
Solvency Margins
Prudential of Japan Gibraltar Typical Rating Agency Targets
FY’03 Solvency Margin 1,030% 1,157% AA – 700%, A – 500%
Significantly higher capital than needed to operate businesses International Insurance has successfully redeployed nearly $1 billion of excess capital since 2002
Tokyo Investor Day 9.23.04
27
Summary
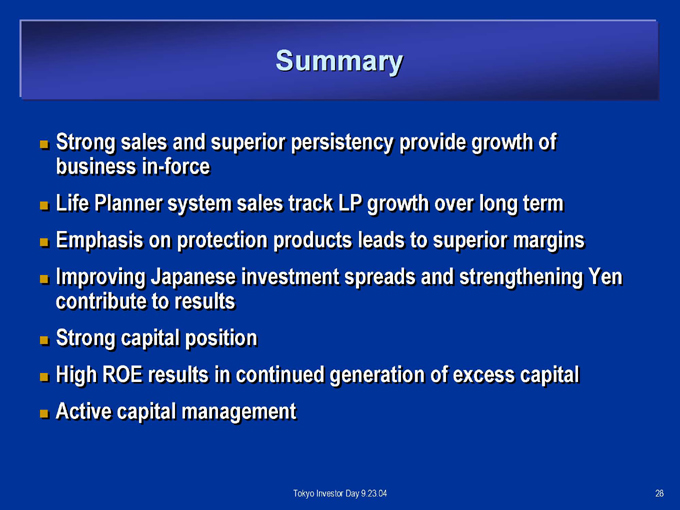
Strong sales and superior persistency provide growth of business in-force Life Planner system sales track LP growth over long term Emphasis on protection products leads to superior margins Improving Japanese investment spreads and strengthening Yen contribute to results Strong capital position High ROE results in continued generation of excess capital Active capital management
Tokyo Investor Day 9.23.04
28
Prudential of Japan
Kazuo Maeda
President and CEO
Prudential International Insurance Life Planner Operations

Life insurance market in Japan (1)
Total population: 127 million (Rank #10) Nominal GDP: $4.3 trillion (Rank #2) Life insurance premium: $387 billion (Rank #2) Life insurance premium: 9.1% of GDP Top 6 companies control 67% of private market 89.6% of households have life insurance Life insurance market is contracting 11.6% decline in premium (FY1998 – FY2002)
(1) For the fiscal year ended March 31, 2003; Japanese industry data
Tokyo Investor Day 9.23.04
30
POJ – current status
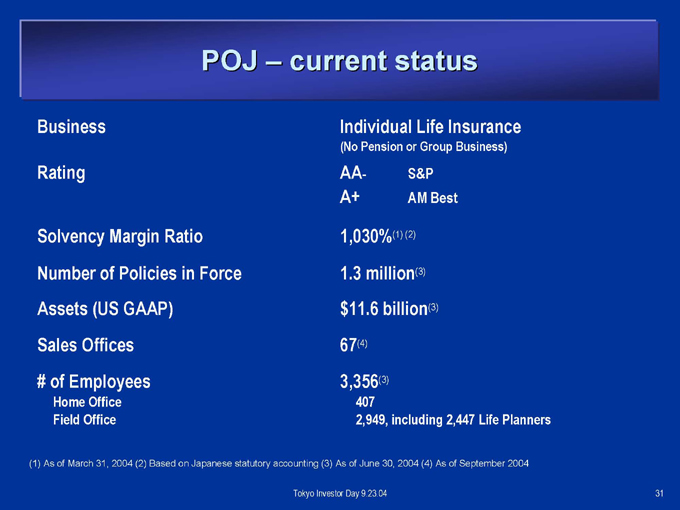
Business
Rating
Solvency Margin Ratio Number of Policies in Force Assets (US GAAP) Sales Offices # of Employees
Home Office Field Office
Individual Life Insurance
(No Pension or Group Business)
AA- S&P A+ AM Best
1,030%(1) (2)
1.3 million(3) $11.6 billion(3)
67 (4)
3,356(3)
407
2,949, including 2,447 Life Planners
(1) As of March 31, 2004 (2) Based on Japanese statutory accounting (3) As of June 30, 2004 (4) As of September 2004
Tokyo Investor Day 9.23.04
31
History of operation
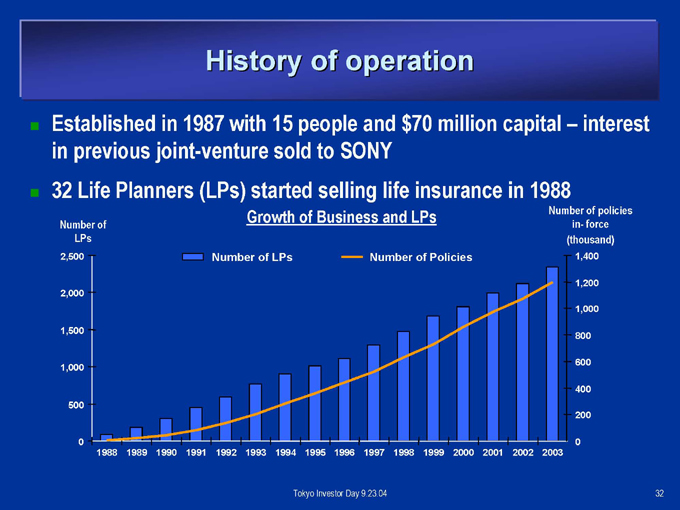
Established in 1987 with 15 people and $70 million capital – interest in previous joint-venture sold to SONY
32 Life Planners (LPs) started selling life insurance in 1988
Number of LPs
2,500 2,000 1,500 1,000 500 0
Growth of Business and LPs
Number of LPs Number of Policies
Number of policies in- force (thousand)
1988 1989 1990 1991 1992 1993 1994 1995 1996 1997 1998 1999 2000 2001 2002 2003
1,400 1,200 1,000 800 600 400 200 0
Tokyo Investor Day 9.23.04
32
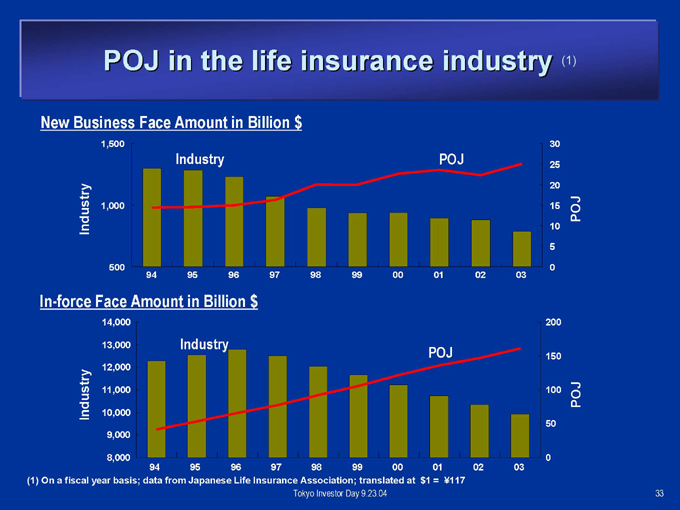
POJ in the life insurance industry (1)
New Business Face Amount in Billion $
Industry
1,500 1,000 500
Industry
POJ
94 95 96 97 98 99 00 01 02 03
30
25
20
15 POJ
10 5 0
In-force Face Amount in Billion $
14,000 13,000 12,000 11,000 10,000 9,000 8,000
Industry
Industry
POJ
94 95 96 97 98 99 00 01 02 03
(1) On a fiscal year basis; data from Japanese Life Insurance Association; translated at $1 = ¥117
Tokyo Investor Day 9.23.04
200
150
100 POJ 50
0
33
Vision, Mission, and Strategy
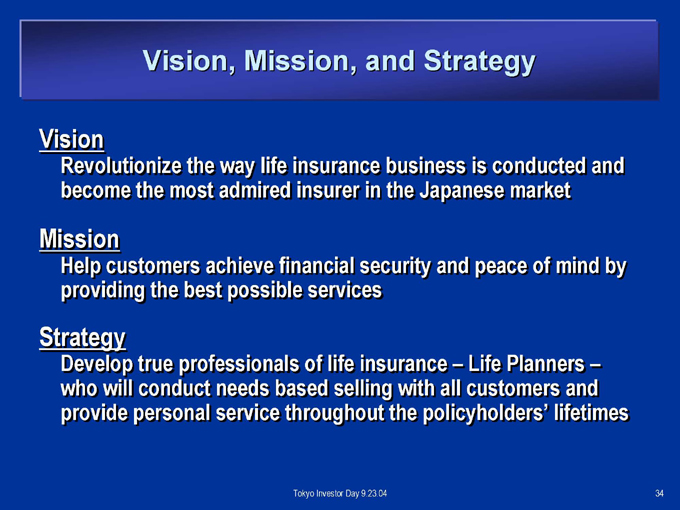
Vision
Revolutionize the way life insurance business is conducted and become the most admired insurer in the Japanese market
Mission
Help customers achieve financial security and peace of mind by providing the best possible services
Strategy
Develop true professionals of life insurance – Life Planners – who will conduct needs based selling with all customers and provide personal service throughout the policyholders’ lifetimes
Tokyo Investor Day 9.23.04
34

Business model – Life Planner
Life Planner – a selective, high quality sales force
Only 2-4 out of 100 candidates are hired - Well trained and professional Customer focused
Disciplined, and demonstrates “missionary zeal”
Profile of a typical POJ new Life Planner
Age 32 years old College graduate
Good sales experience outside the life insurance industry Married with children First job change POJ policyholder Referred by another POJ Life Planner Annual income in the previous job was about $50,000
Tokyo Investor Day 9.23.04
35
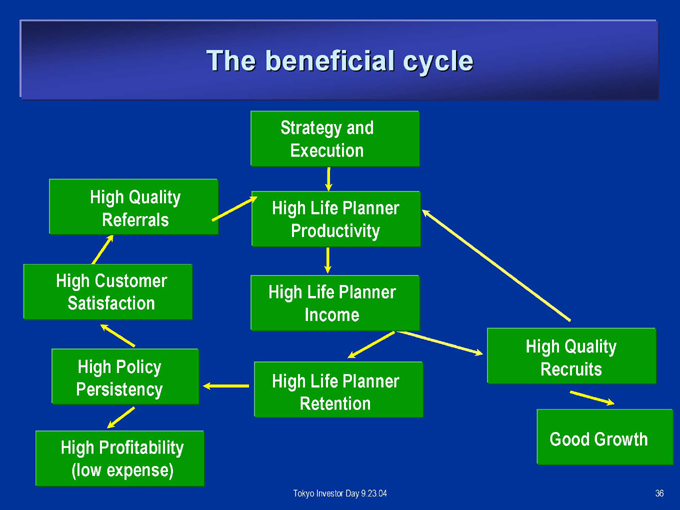
The beneficial cycle
Strategy and Execution
High Quality Referrals
High Life Planner Productivity
High Customer Satisfaction
High Life Planner Income
High Policy Persistency
High Life Planner Retention
High Profitability (low expense)
High Quality Recruits
Good Growth
Tokyo Investor Day 9.23.04
36

Business model – Needs Based Selling
What do we mean by needs based selling of life insurance?
We are in the life insurance business.
– However –
We are not in business to sell life insurance as a product. We are in the business to sell life insurance as a solution.
– That means –
We are in the business to help our clients understand their insurance needs, and then to help them meet those needs.
By Mr. Kiyo Sakaguchi
Tokyo Investor Day 9.23.04
37
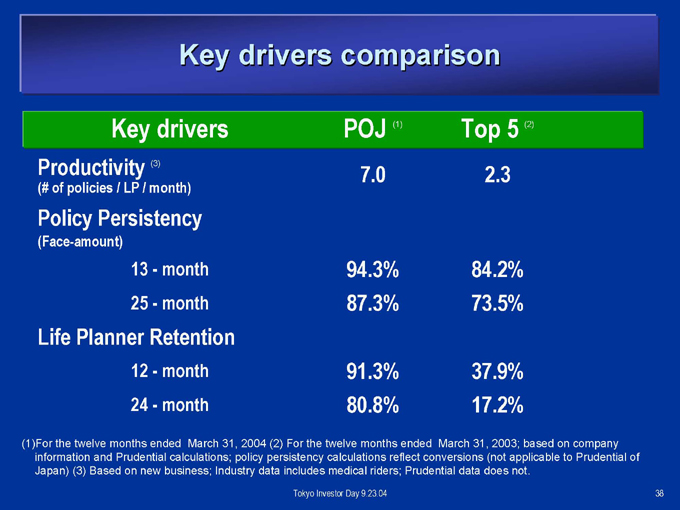
Key drivers comparison
Key drivers POJ (1) Top 5 (2)
Productivity (3)
(# of policies / LP / month)
7.0 2.3
Policy Persistency
(Face-amount)
13 - month 94.3% 84.2% 25 - month 87.3% 73.5% Life Planner Retention 12 - month 91.3% 37.9% 24 - month 80.8% 17.2%
(1)For the twelve months ended March 31, 2004 (2) For the twelve months ended March 31, 2003; based on company information and Prudential calculations; policy persistency calculations reflect conversions (not applicable to Prudential of Japan) (3) Based on new business; Industry data includes medical riders; Prudential data does not.
Tokyo Investor Day 9.23.04
38
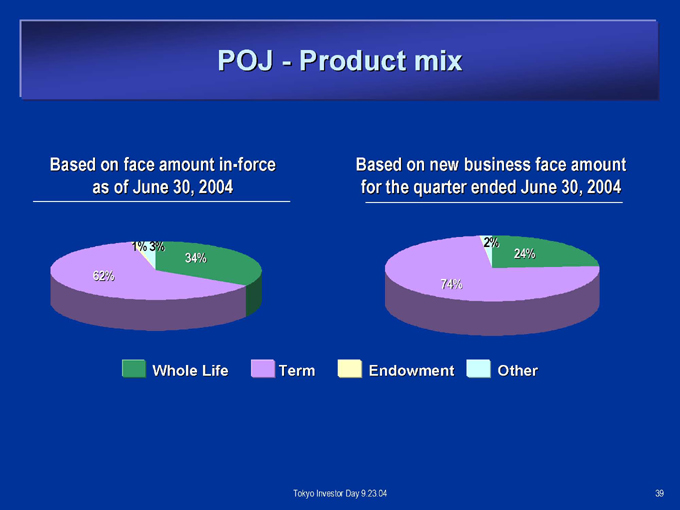
POJ - Product mix
Based on face amount in-force as of June 30, 2004
Based on new business face amount for the quarter ended June 30, 2004
62%
1% 3% 34%
2% 24%
74%
Whole Life Term Endowment Other
Tokyo Investor Day 9.23.04
39
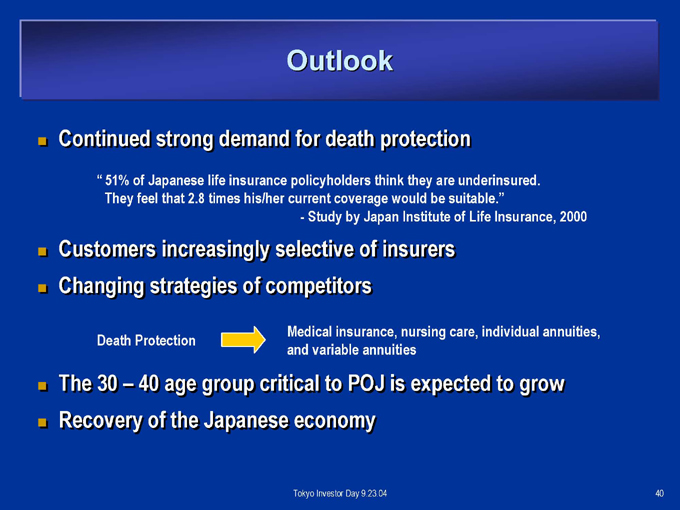
Outlook
Continued strong demand for death protection
“ 51% of Japanese life insurance policyholders think they are underinsured. They feel that 2.8 times his/her current coverage would be suitable.”
- Study by Japan Institute of Life Insurance, 2000
Customers increasingly selective of insurers Changing strategies of competitors
Medical insurance, nursing care, individual annuities, Death Protection and variable annuities
The 30 – 40 age group critical to POJ is expected to grow Recovery of the Japanese economy
Tokyo Investor Day 9.23.04
40
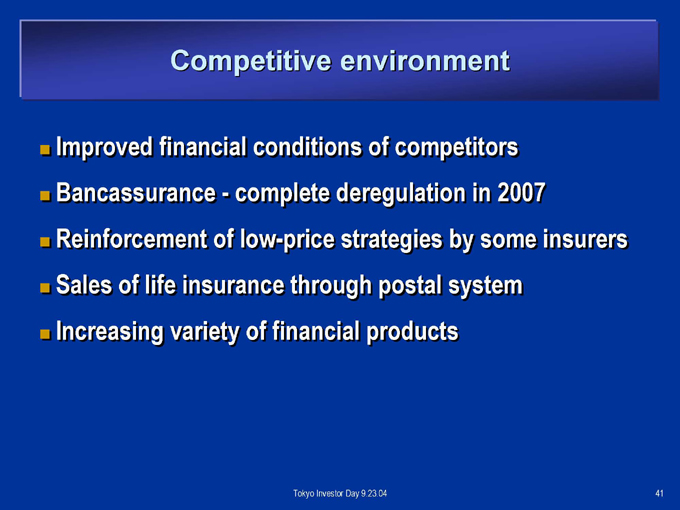
Competitive environment
Improved financial conditions of competitors Bancassurance—complete deregulation in 2007 Reinforcement of low-price strategies by some insurers Sales of life insurance through postal system Increasing variety of financial products
Tokyo Investor Day 9.23.04
41
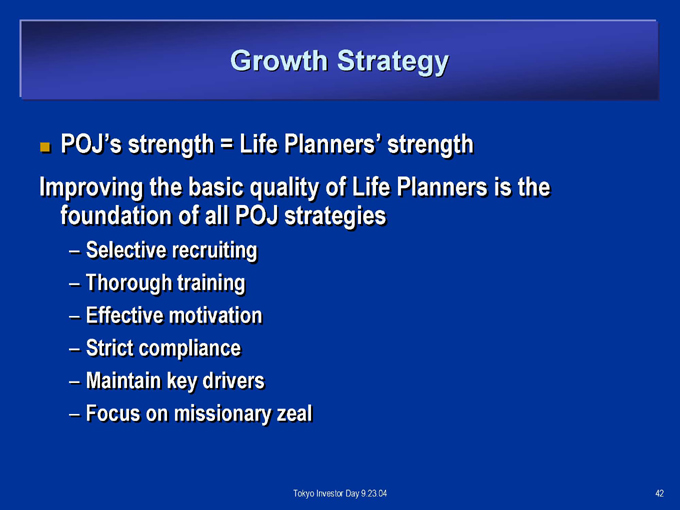
Growth Strategy
POJ’s strength = Life Planners’ strength
Improving the basic quality of Life Planners is the foundation of all POJ strategies
Selective recruiting Thorough training Effective motivation Strict compliance Maintain key drivers Focus on missionary zeal
Tokyo Investor Day 9.23.04
42
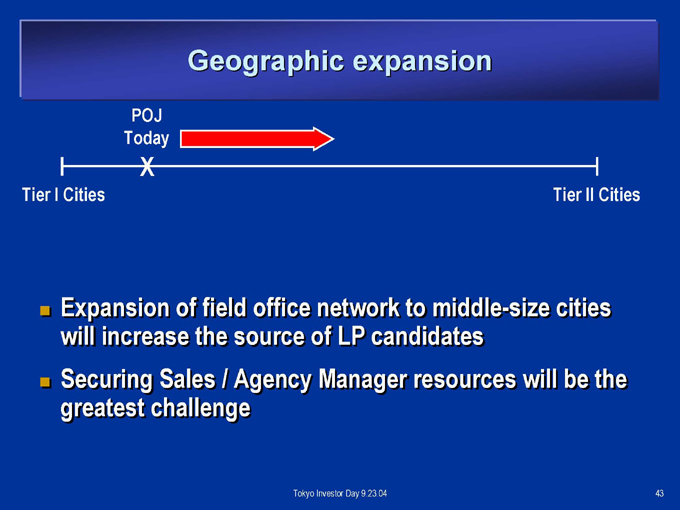
Geographic expansion
POJ Today
Tier I Cities
Tier II Cities
Expansion of field office network to middle-size cities will increase the source of LP candidates Securing Sales / Agency Manager resources will be the greatest challenge
Tokyo Investor Day 9.23.04
43
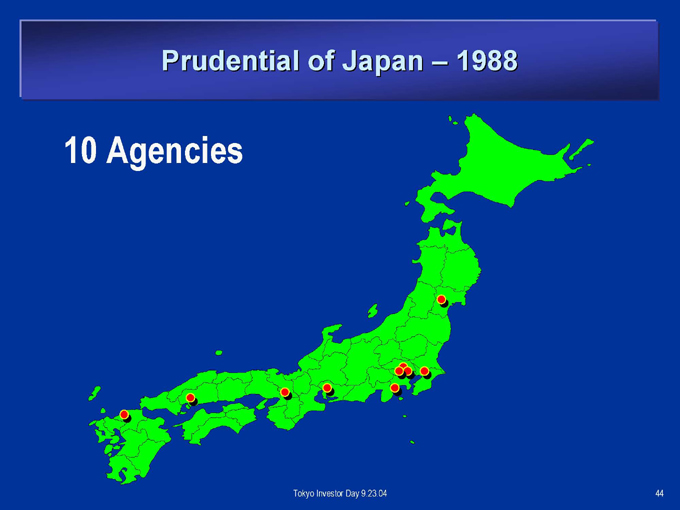
Prudential of Japan – 1988
10 Agencies
Tokyo Investor Day 9.23.04
44
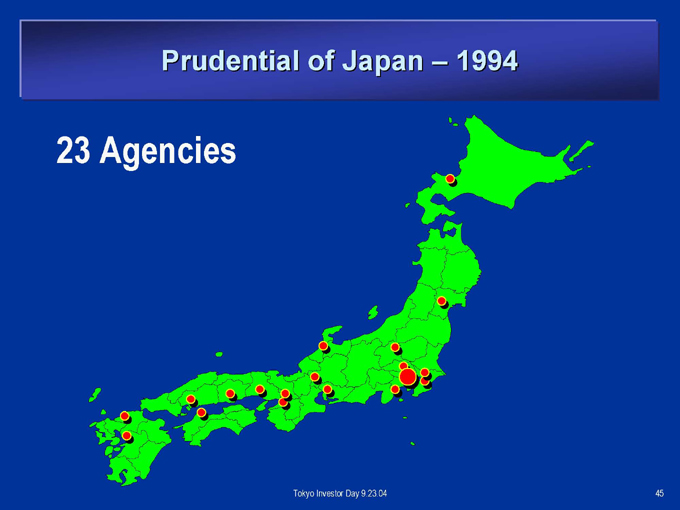
Prudential of Japan – 1994
23 Agencies
Tokyo Investor Day 9.23.04
45
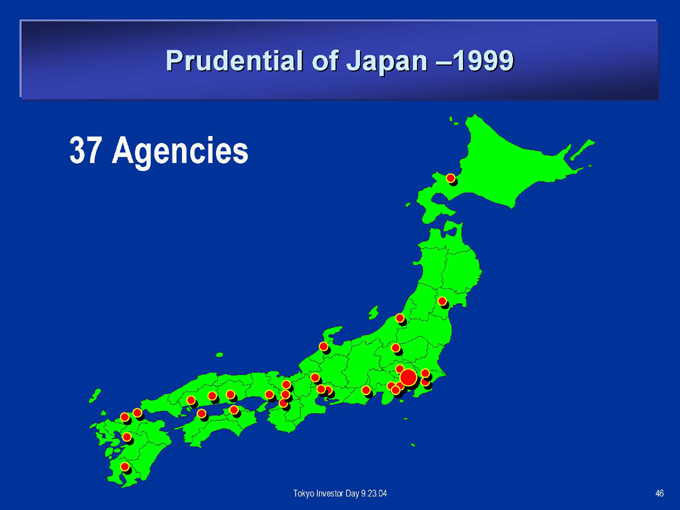
Prudential of Japan –1999
37 Agencies
Tokyo Investor Day 9.23.04
46
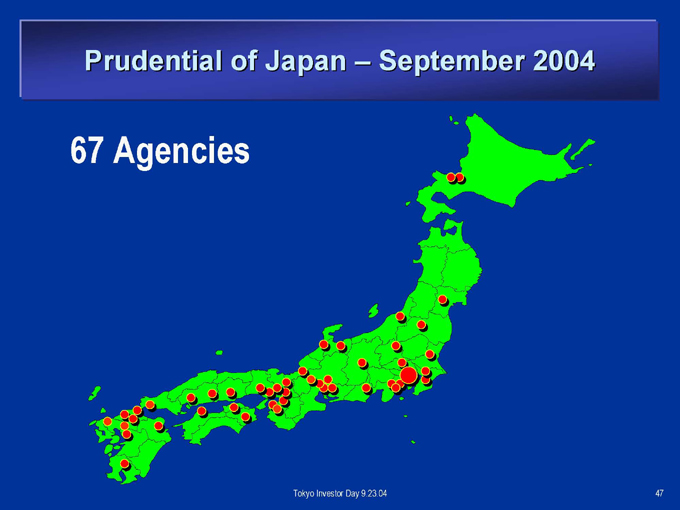
Prudential of Japan – September 2004
67 Agencies
Tokyo Investor Day 9.23.04
47
Summary
Selective, high quality Life Planner sales force Needs based selling; protection products
Superior productivity, policy persistency, Life Planner retention Life Planner expansion drives continued growth Focused strategy and execution
Tokyo Investor Day 9.23.04
48

Gibraltar Life
Tim Feige
President and CEO
Gibraltar Life
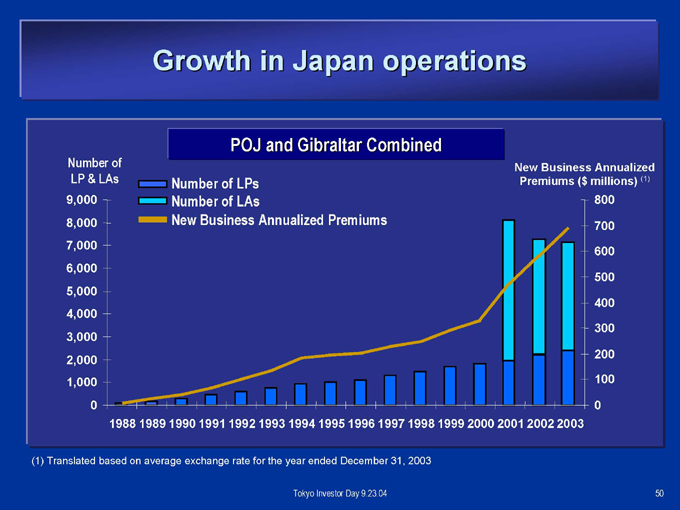
Growth in Japan operations
POJ and Gibraltar Combined
Number of LPs Number of LAs
New Business Annualized Premiums
New Business Annualized Premiums ($ millions) (1)
Number of LP & LAs
9,000 8,000 7,000 6,000 5,000 4,000 3,000 2,000 1,000 0
1988 1989 1990 1991 1992 1993 1994 1995 1996 1997 1998 1999 2000 2001 2002 2003
800 700 600 500
400 300
200 100
0
(1) Translated based on average exchange rate for the year ended December 31, 2003
Tokyo Investor Day 9.23.04
50
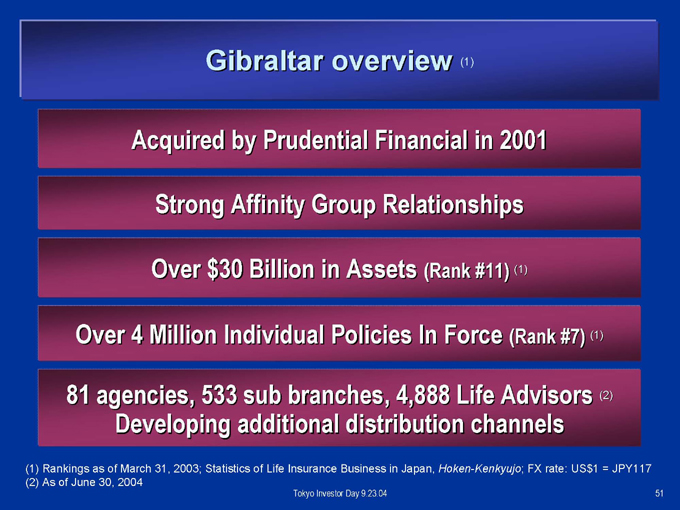
Gibraltar overview (1)
Acquired by Prudential Financial in 2001 Strong Affinity Group Relationships Over $30 Billion in Assets (Rank #11) (1) Over 4 Million Individual Policies In Force (Rank #7) (1)
81 agencies, 533 sub branches, 4,888 Life Advisors (2) Developing additional distribution channels
(1) Rankings as of March 31, 2003; Statistics of Life Insurance Business in Japan, Hoken-Kenkyujo; FX rate: US$1 = JPY117 (2) As of June 30, 2004
Tokyo Investor Day 9.23.04
51
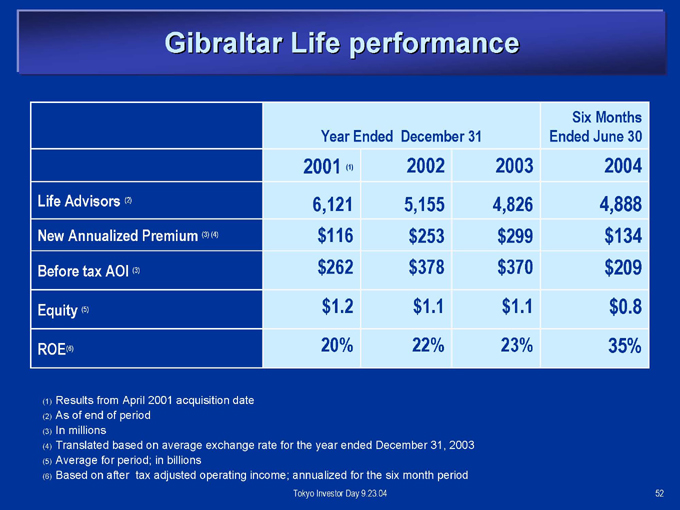
Gibraltar Life performance
Year Ended December 31
Six Months Ended June 30
2001 (1) 2002 2003 2004
Life Advisors (2) 6,121 5,155 4,826 4,888
New Annualized Premium (3) (4) $116 $253 $299 $134 Before tax AOI (3) $262 $378 $370 $209
Equity (5) $1.2 $1.1 $1.1 $0.8 ROE(6) 20% 22% 23% 35%
(1) Results from April 2001 acquisition date (2) As of end of period (3) In millions
(4) Translated based on average exchange rate for the year ended December 31, 2003 (5) Average for period; in billions (6) Based on after tax adjusted operating income; annualized for the six month period
Tokyo Investor Day 9.23.04
52
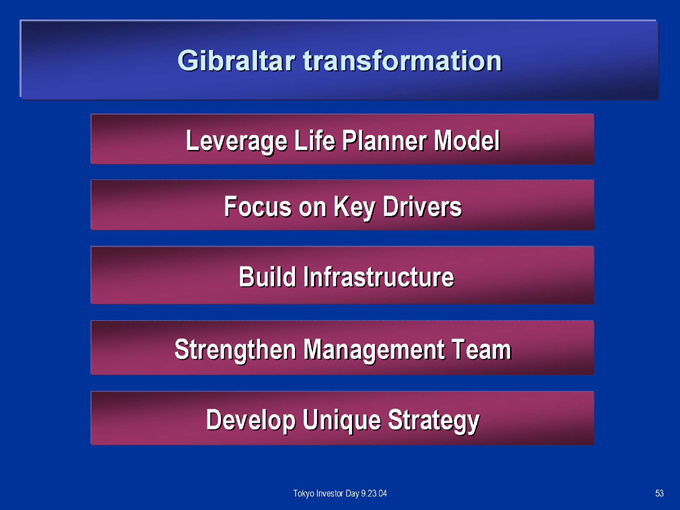
Gibraltar transformation
Leverage Life Planner Model Focus on Key Drivers Build Infrastructure Strengthen Management Team Develop Unique Strategy
Tokyo Investor Day 9.23.04
53
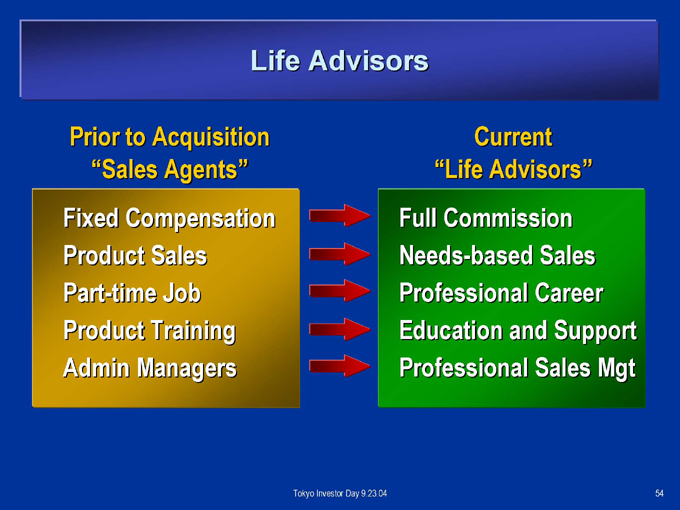
Life Advisors
Prior to Acquisition “Sales Agents”
Current “Life Advisors”
Fixed Compensation Product Sales Part-time Job Product Training Admin Managers
Full Commission Needs-based Sales Professional Career Education and Support Professional Sales Mgt
Tokyo Investor Day 9.23.04
54
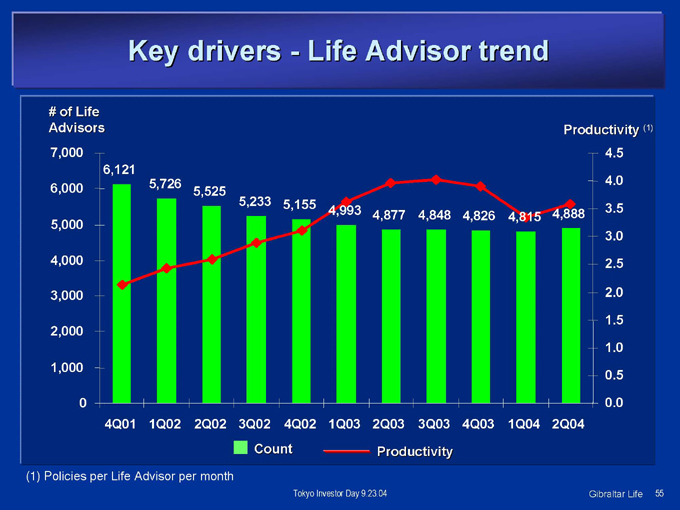
Key drivers - Life Advisor trend
# of Life Advisors 7,000
6,000
5,000 4,000 3,000 2,000
1,000
0
6,121
5,726 5,525
5,233 5,155
4,993 4,877 4,848 4,826 4,815 4,888
4Q01 1Q02 2Q02 3Q02 4Q02 1Q03 2Q03 3Q03 4Q03 1Q04 2Q04
Count Productivity
Productivity (1)
4.5
4.0
3.5
3.0
2.5
2.0
1.5
1.0
0.5
0.0
(1) Policies per Life Advisor per month
Tokyo Investor Day 9.23.04
Gibraltar Life
55
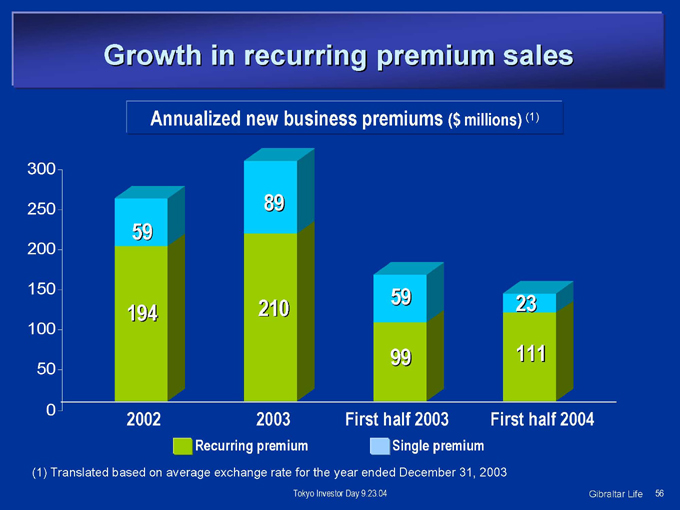
Growth in recurring premium sales
Annualized new business premiums ($ millions) (1)
300 250 200 150 100 50 0
59
194
2002
89
210
2003
59
99
First half 2003
23
111
First half 2004
Recurring premium Single premium
(1) Translated based on average exchange rate for the year ended December 31, 2003
Tokyo Investor Day 9.23.04
Gibraltar Life
56
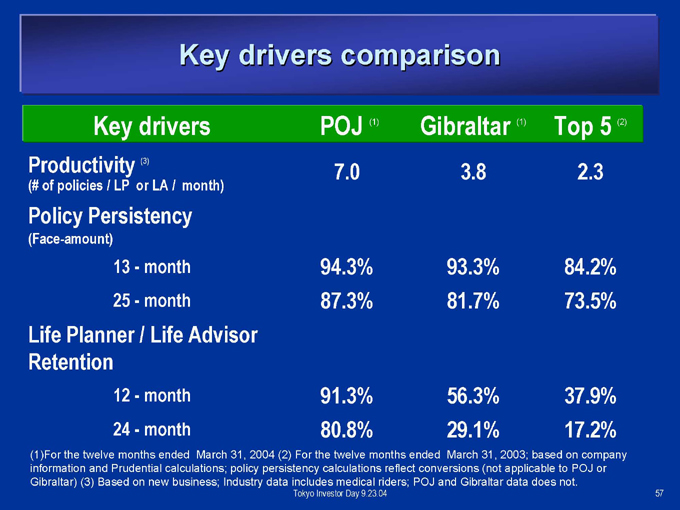
Key drivers comparison
Key drivers POJ (1) Gibraltar (1) Top 5 (2)
Productivity (3)
(# of policies / LP or LA / month)
7.0 3.8 2.3
Policy Persistency
(Face-amount)
13—month 94.3% 93.3% 84.2% 25—month 87.3% 81.7% 73.5%
Life Planner / Life Advisor Retention
12—month 91.3% 56.3% 37.9% 24—month 80.8% 29.1% 17.2%
(1)For the twelve months ended March 31, 2004 (2) For the twelve months ended March 31, 2003; based on company information and Prudential calculations; policy persistency calculations reflect conversions (not applicable to POJ or Gibraltar) (3) Based on new business; Industry data includes medical riders; POJ and Gibraltar data does not.
Tokyo Investor Day 9.23.04
57
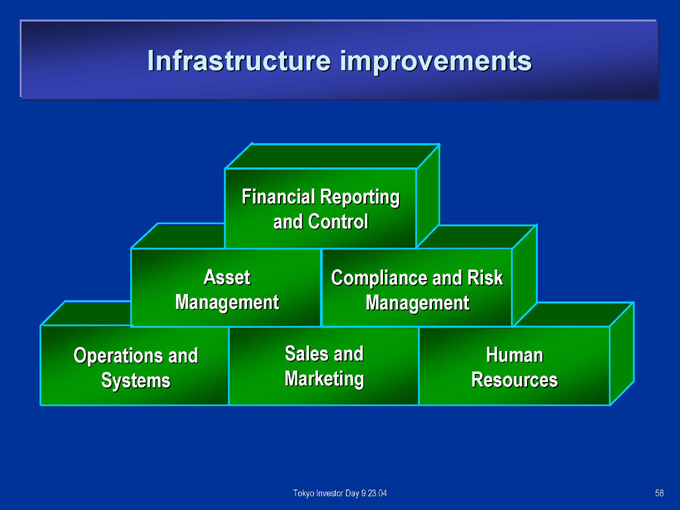
Infrastructure improvements
Financial Reporting and Control
Asset Management
Compliance and Risk Management
Operations and Systems
Sales and Marketing
Human Resources
Tokyo Investor Day 9.23.04
58
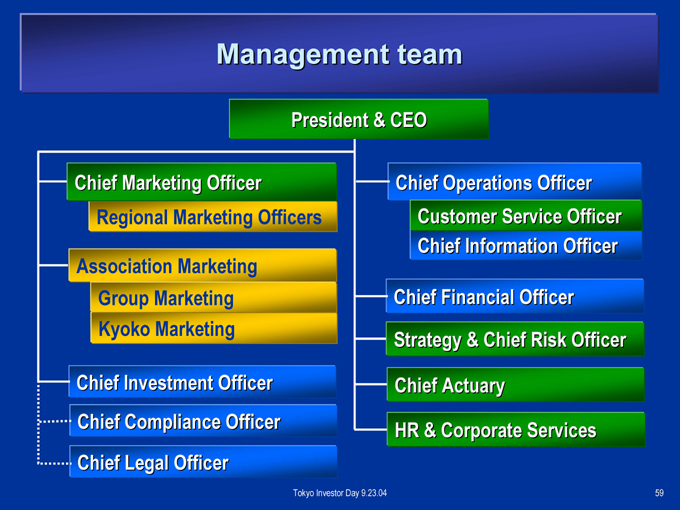
Management team
President & CEO
Chief Marketing Officer Regional Marketing Officers
Association Marketing Group Marketing Kyoko Marketing
Chief Investment Officer Chief Compliance Officer Chief Legal Officer
Chief Operations Officer Customer Service Officer Chief Information Officer
Chief Financial Officer Strategy & Chief Risk Officer
Chief Actuary
HR & Corporate Services
Tokyo Investor Day 9.23.04
59
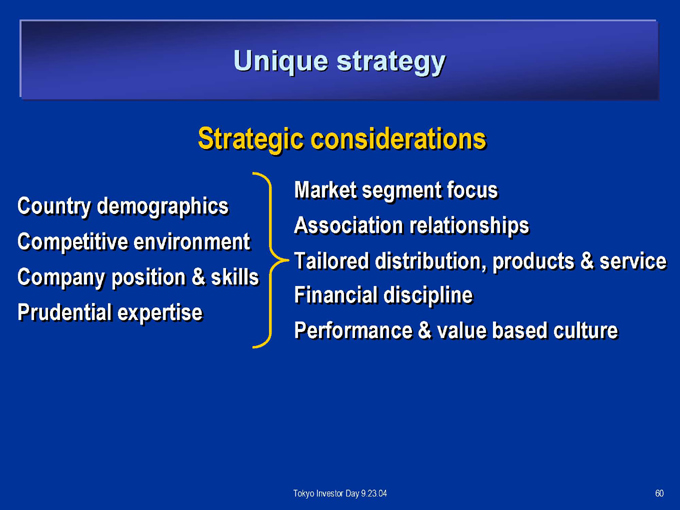
Unique strategy
Strategic considerations
Country demographics Competitive environment Company position & skills Prudential expertise
Market segment focus Association relationships
Tailored distribution, products & service Financial discipline Performance & value based culture
Tokyo Investor Day 9.23.04
60
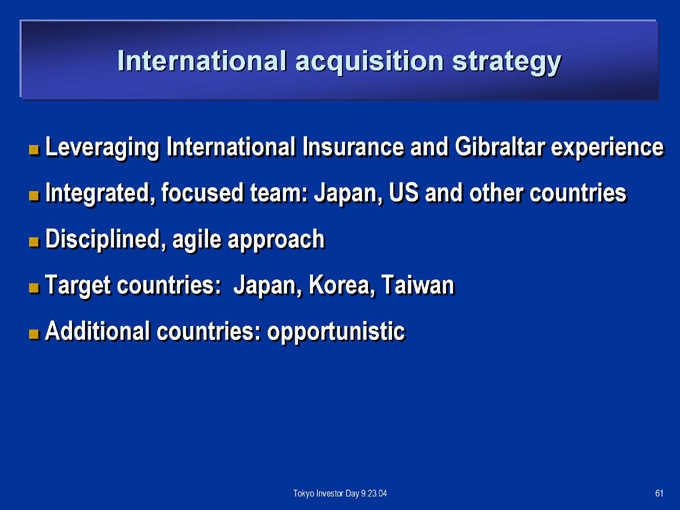
International acquisition strategy
Leveraging International Insurance and Gibraltar experience Integrated, focused team: Japan, US and other countries Disciplined, agile approach Target countries: Japan, Korea, Taiwan Additional countries: opportunistic
Tokyo Investor Day 9.23.04
61
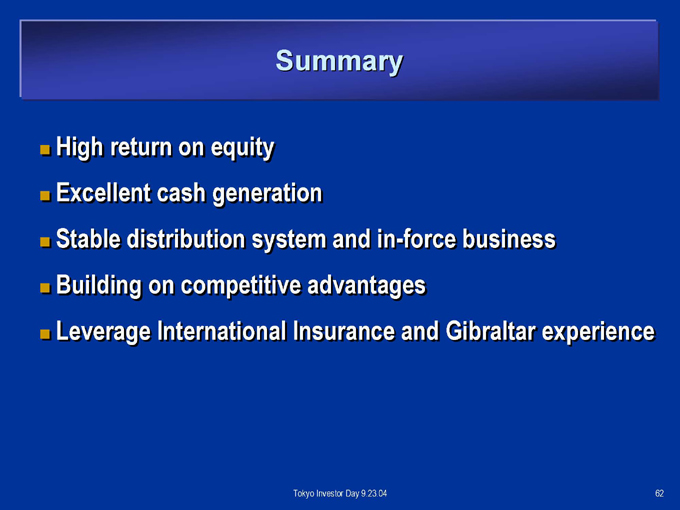
Summary
High return on equity Excellent cash generation
Stable distribution system and in-force business Building on competitive advantages
Leverage International Insurance and Gibraltar experience
Tokyo Investor Day 9.23.04
62
Prudential of Korea
O.J. Hwang
President Prudential of Korea
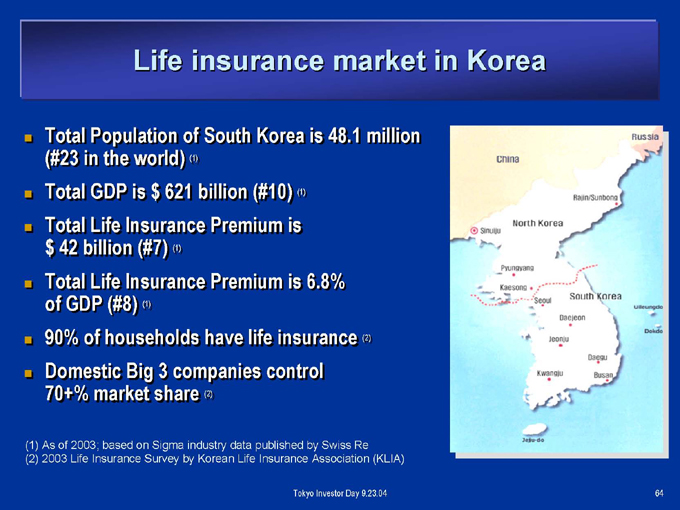
Life insurance market in Korea
Total Population of South Korea is 48.1 million (#23 in the world) (1) Total GDP is $ 621 billion (#10) (1) Total Life Insurance Premium is $ 42 billion (#7) (1) Total Life Insurance Premium is 6.8% of GDP (#8) (1) 90% of households have life insurance (2) Domestic Big 3 companies control 70+% market share (2)
(1) As of 2003; based on Sigma industry data published by Swiss Re (2) 2003 Life Insurance Survey by Korean Life Insurance Association (KLIA)
Tokyo Investor Day 9.23.04
64
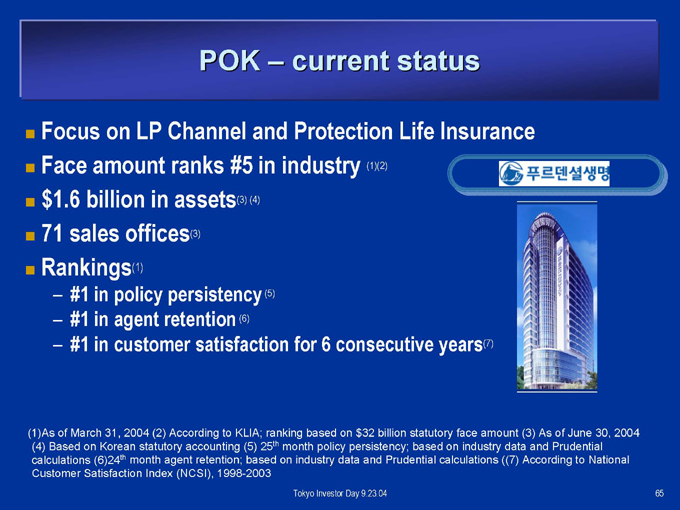
POK – current status
Focus on LP Channel and Protection Life Insurance Face amount ranks #5 in industry (1)(2) $1.6 billion in assets(3) (4) 71 sales offices(3) Rankings(1)
#1 in policy persistency(5) #1 in agent retention(6)
#1 in customer satisfaction for 6 consecutive years(7)
(1)As of March 31, 2004 (2) According to KLIA; ranking based on $32 billion statutory face amount (3) As of June 30, 2004 (4) Based on Korean statutory accounting (5) 25th month policy persistency; based on industry data and Prudential calculations (6)24th month agent retention; based on industry data and Prudential calculations ((7) According to National Customer Satisfaction Index (NCSI), 1998-2003
Tokyo Investor Day 9.23.04
65
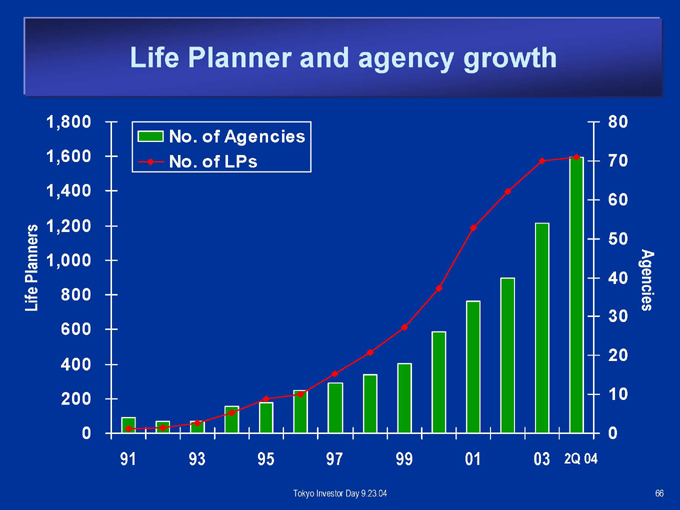
Life Planner and agency growth
No. of Agencies No. of LPs
1,800 1,600 1,400 1,200
Planners
1,000
Life 800 600 400 200 0
91 93 95 97 99 01 03 2Q 04
Tokyo Investor Day 9.23.04
80 70 60
50
Agencies
40 30 20 10 0
66
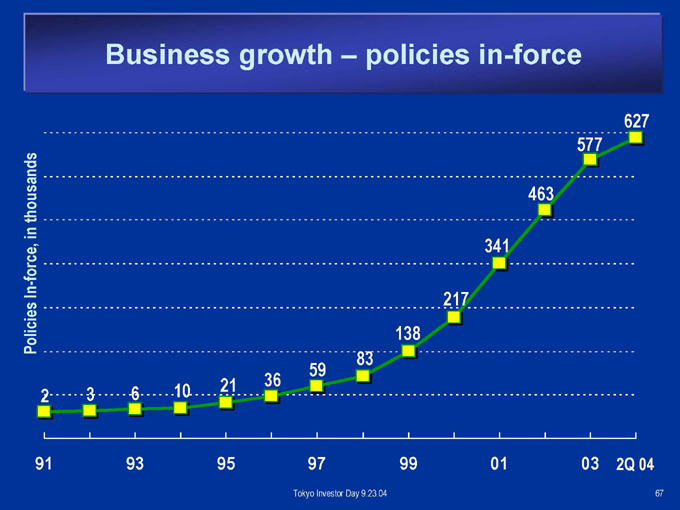
Business growth – policies in-force
Policies In-force, in thousands
2
3
6
10
21
36
59
83
138
217
341
463
577
627
91 93 95 97 99 01 03 2Q 04
Tokyo Investor Day 9.23.04
67
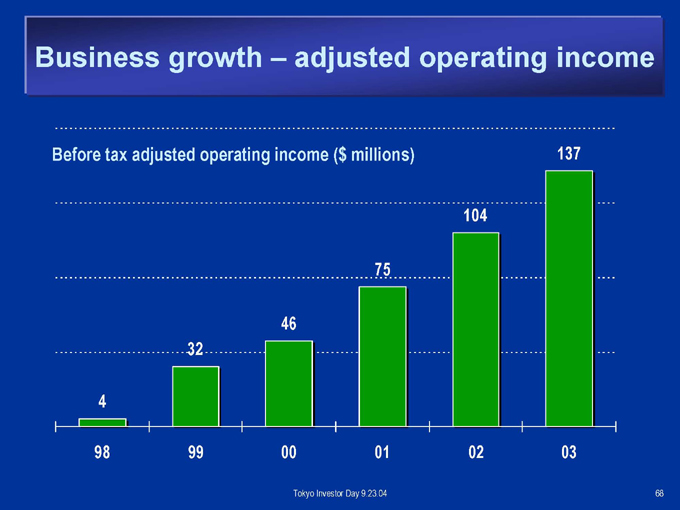
Business growth – adjusted operating income
Before tax adjusted operating income ($ millions)
4
32
46
75
104
137
98 99 00 01 02 03
Tokyo Investor Day 9.23.04
68
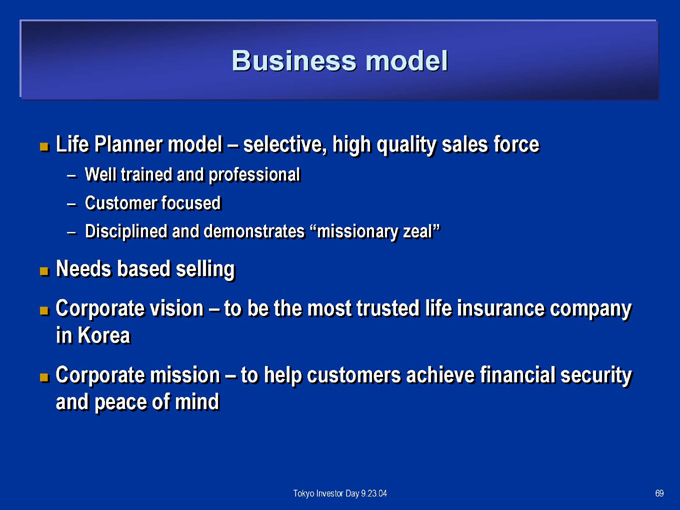
Business model
Life Planner model – selective, high quality sales force
– Well trained and professional
– Customer focused
– Disciplined and demonstrates “missionary zeal”
Needs based selling
Corporate vision – to be the most trusted life insurance company in Korea Corporate mission – to help customers achieve financial security and peace of mind
Tokyo Investor Day 9.23.04
69
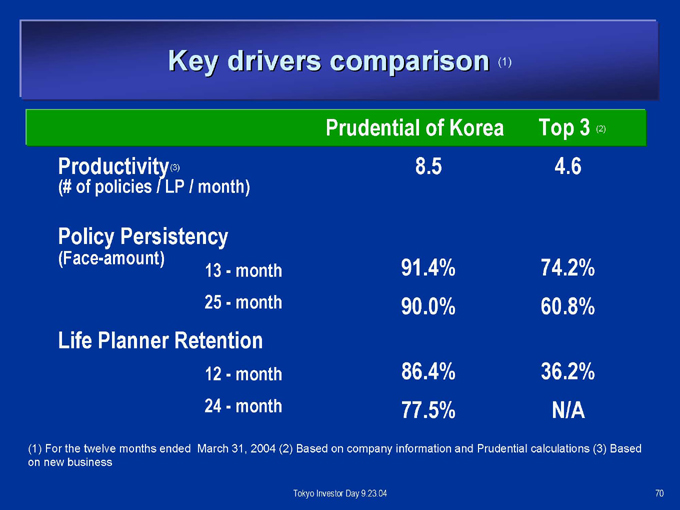
Key drivers comparison (1)
Prudential of Korea Top 3 (2)
Productivity(3)
(# of policies / LP / month)
8.5 4.6
Policy Persistency
(Face-amount) 13 - month 91.4% 74.2%
25 - month 90.0% 60.8% Life Planner Retention 12 - month 86.4% 36.2%
24 - month 77.5% N/A
(1) For the twelve months ended March 31, 2004 (2) Based on company information and Prudential calculations (3) Based on new business
Tokyo Investor Day 9.23.04
70
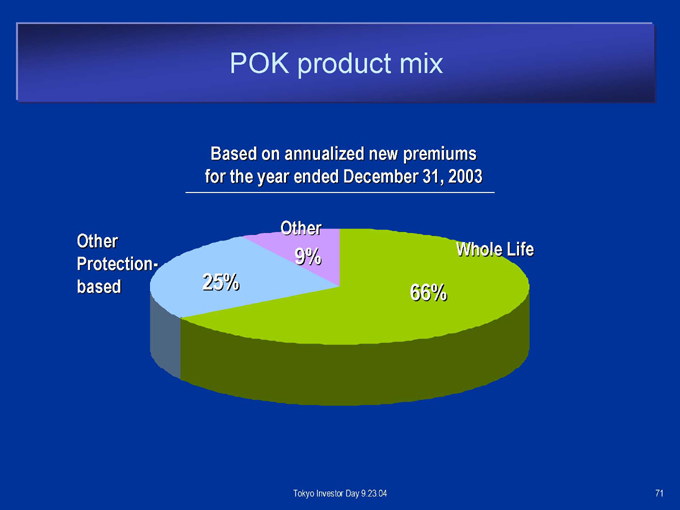
POK product mix
Based on annualized new premiums for the year ended December 31, 2003
Other Protection-based
25%
Other
9%
Whole Life
66%
Tokyo Investor Day 9.23.04
71
Growth strategy
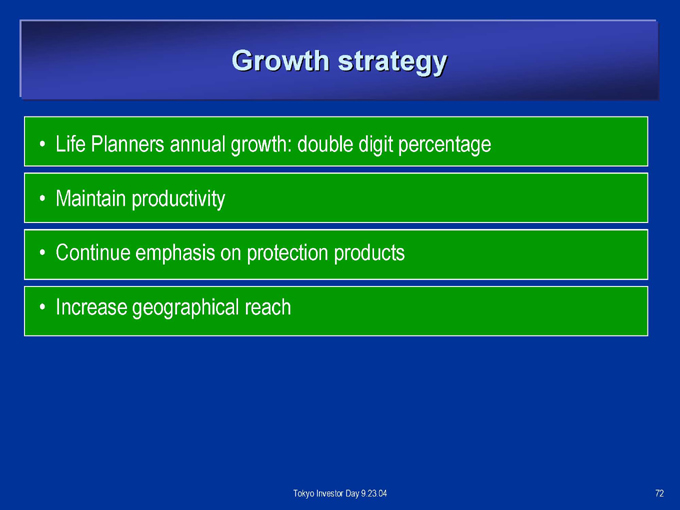
Life Planners annual growth: double digit percentage Maintain productivity Continue emphasis on protection products Increase geographical reach
Tokyo Investor Day 9.23.04
72
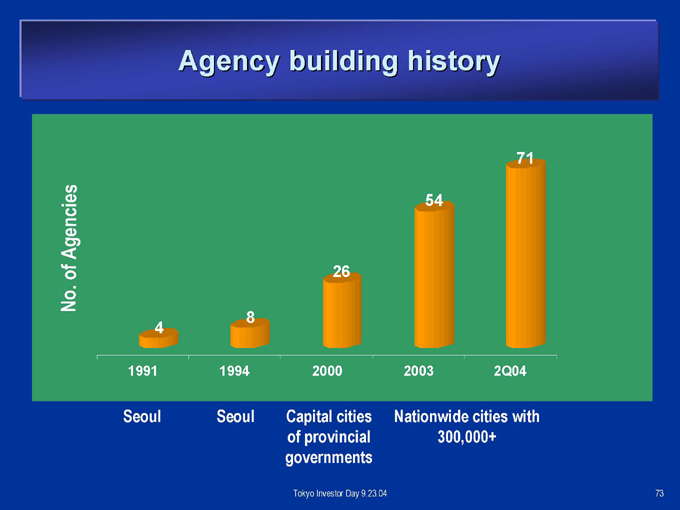
Agency building history
No. of Agencies
4
8
26
54
71
1991 1994 2000 2003 2Q04
Seoul
Seoul
Capital cities of provincial governments
Nationwide cities with 300,000+
Tokyo Investor Day 9.23.04
73
Summary
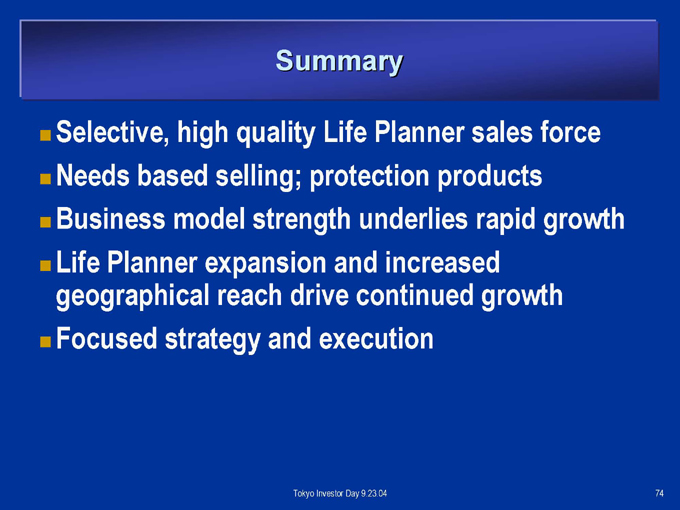
Selective, high quality Life Planner sales force Needs based selling; protection products Business model strength underlies rapid growth Life Planner expansion and increased geographical reach drive continued growth Focused strategy and execution
Tokyo Investor Day 9.23.04
74

International Investments - Korea
Christopher Cooper
President & CEO
Prudential Investments & Securities Co., Ltd.
Korean investment management market (1)
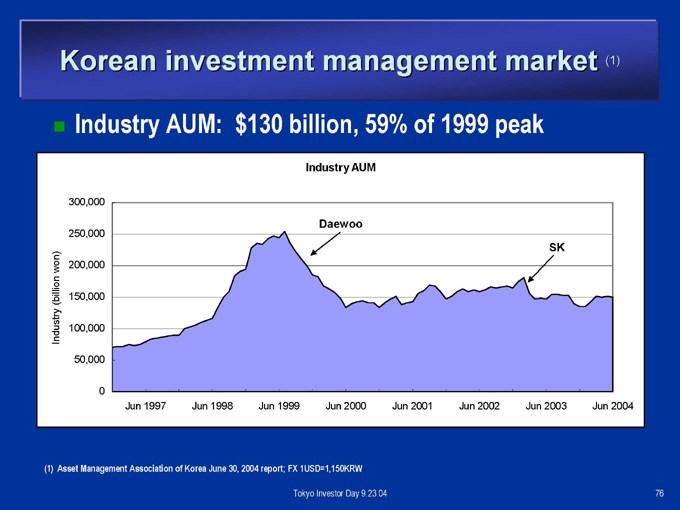
Industry AUM: $130 billion, 59% of 1999 peak
300,000
250,000
200,000 Industry (billion won) 150,000 100,000
50,000
0
Industry AUM
Daewoo
SK
Jun 1997 Jun 1998 Jun 1999 Jun 2000 Jun 2001 Jun 2002 Jun 2003 Jun 2004
(1) Asset Management Association of Korea June 30, 2004 report; FX 1USD=1,150KRW
Tokyo Investor Day 9.23.04
76
Korean investment management market
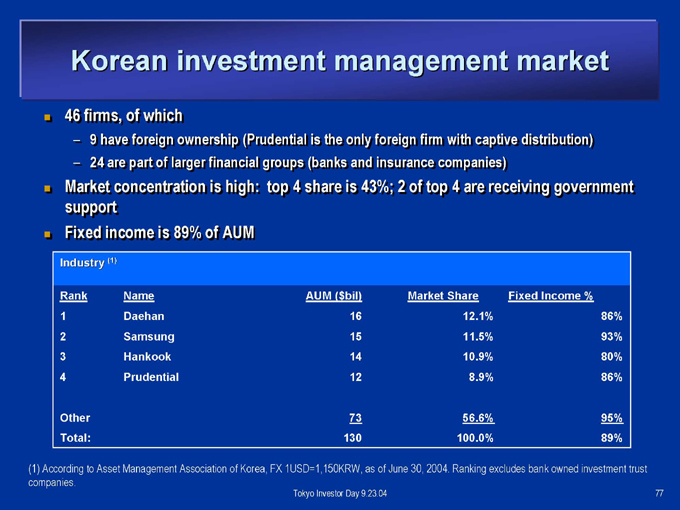
46 firms, of which
– 9 have foreign ownership (Prudential is the only foreign firm with captive distribution) – 24 are part of larger financial groups (banks and insurance companies)
Market concentration is high: top 4 share is 43%; 2 of top 4 are receiving government support Fixed income is 89% of AUM
Industry (1)
Rank Name AUM ($bil) Market Share Fixed Income %
1 Daehan 16 12.1% 86%
2 Samsung 15 11.5% 93%
3 Hankook 14 10.9% 80%
4 Prudential 12 8.9% 86%
Other 73 56.6% 95% Total: 130 100.0% 89%
(1) According to Asset Management Association of Korea, FX 1USD=1,150KRW, as of June 30, 2004. Ranking excludes bank owned investment trust companies.
Tokyo Investor Day 9.23.04
77
Hyundai acquisition overview
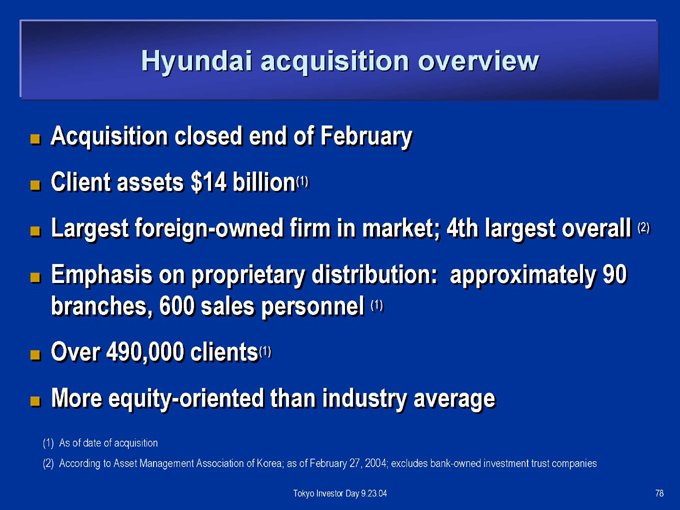
Acquisition closed end of February Client assets $14 billion (1)
Largest foreign-owned firm in market; 4th largest overall (2) Emphasis on proprietary distribution: approximately 90 branches, 600 sales personnel (1) Over 490,000 clients (1) More equity-oriented than industry average
(1) As of date of acquisition
(2) According to Asset Management Association of Korea; as of February 27, 2004; excludes bank-owned investment trust companies
Tokyo Investor Day 9.23.04
78
Hyundai acquisition
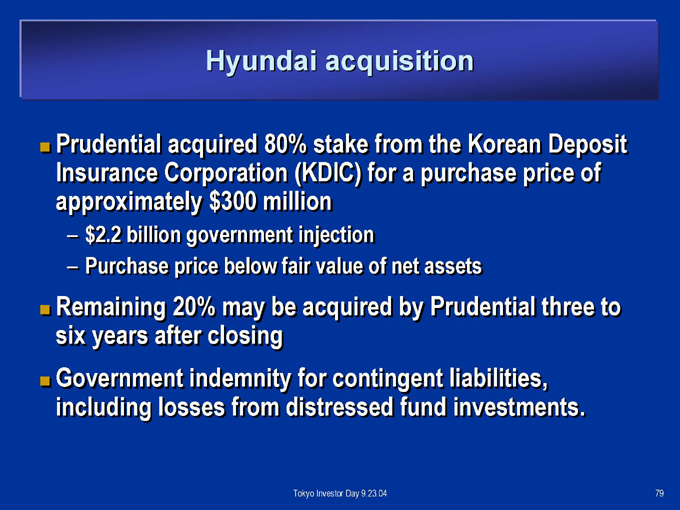
Prudential acquired 80% stake from the Korean Deposit Insurance Corporation (KDIC) for a purchase price of approximately $300 million
–$2.2 billion government injection
– Purchase price below fair value of net assets
Remaining 20% may be acquired by Prudential three to six years after closing Government indemnity for contingent liabilities, including losses from distressed fund investments.
Tokyo Investor Day 9.23.04
79
Integration actions
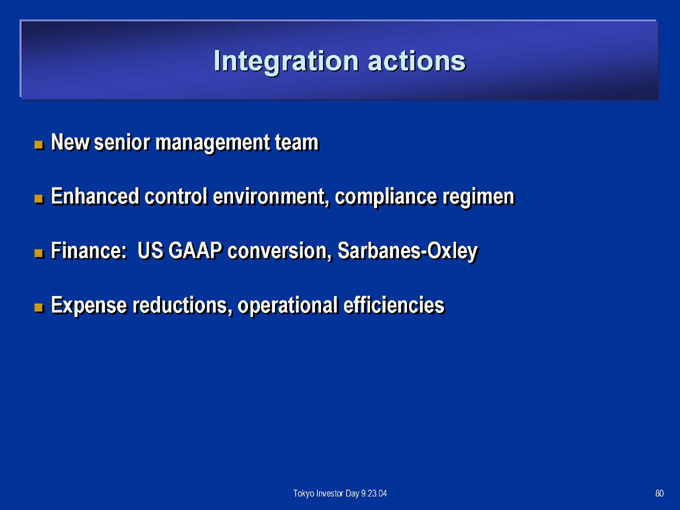
New senior management team
Enhanced control environment, compliance regimen Finance: US GAAP conversion, Sarbanes-Oxley Expense reductions, operational efficiencies
Tokyo Investor Day 9.23.04
80

Opportunities
Potential for clear market leadership
Massive risk transfer from fund sponsors to investors Underserved mass affluent market Consumers evolving from “savers” to “investors” Size and reputation as key success factors Prudential brand
Tokyo Investor Day 9.23.04
81
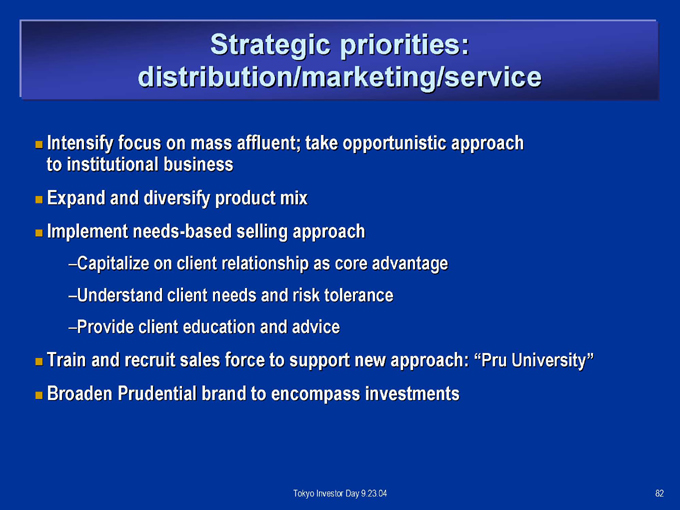
Strategic priorities: distribution/marketing/service
Intensify focus on mass affluent; take opportunistic approach to institutional business Expand and diversify product mix Implement needs-based selling approach
Capitalize on client relationship as core advantage Understand client needs and risk tolerance Provide client education and advice
Train and recruit sales force to support new approach: “Pru University” Broaden Prudential brand to encompass investments
Tokyo Investor Day 9.23.04
82
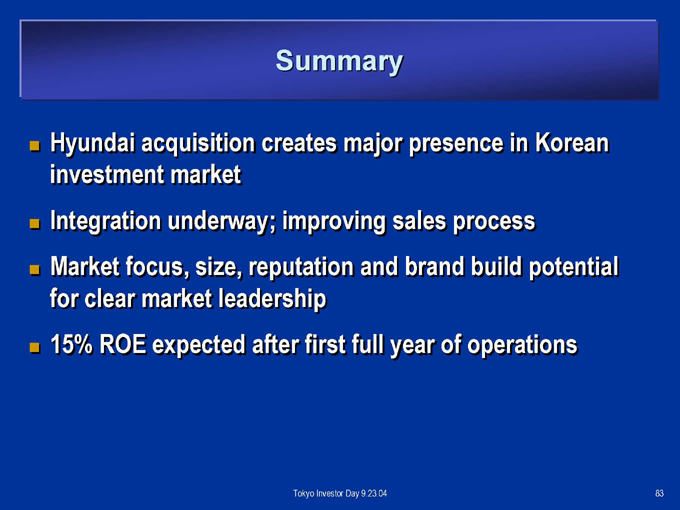
Summary
Hyundai acquisition creates major presence in Korean investment market Integration underway; improving sales process Market focus, size, reputation and brand build potential for clear market leadership 15% ROE expected after first full year of operations
Tokyo Investor Day 9.23.04
83