SLIDE PRESENTATION OF PRUDENTIAL FINANCIAL, INC
Published on
Exhibit 99.0

Investor Day
December 2, 2004
Investor Day 12.02.04 0

Prudential Financial Investor Day
December 2, 2004
Eric Durant
Senior Vice President, Investor Relations
Investor Day 12.02.04 1
Forward-Looking Statements
Certain of the statements included in the following presentation constitute forward-looking statements within the meaning of the U. S. Private Securities Litigation Reform Act of 1995. Words such as “expects,” “believes,” “anticipates,” “includes,” “plans,” “assumes,” “estimates,” “projects,” “intends,” or variations of such words are generally part of forward-looking statements. Forward-looking statements are made based on management’s current expectations and beliefs concerning future developments and their potential effects upon Prudential Financial, Inc. and its subsidiaries. There can be no assurance that future developments affecting Prudential Financial, Inc. and its subsidiaries will be those anticipated by management. These forward-looking statements are not a guarantee of future performance and involve risks and uncertainties, and there are certain important factors that could cause actual results to differ, possibly materially, from expectations or estimates reflected in such forward-looking statements, including those set forth in this presentation and without limitation: general economic, market and political conditions, including the performance of financial markets, interest rate fluctuations and the economic environment; various domestic or international military or terrorist activities or conflicts; volatility in the securities markets; reestimates of our reserves for future policy benefits and claims; changes in our assumptions related to deferred policy acquisition costs; our exposure to contingent liabilities; catastrophe losses; investment losses and defaults; changes in our claims-paying or credit ratings; competition in our product lines and for personnel; fluctuations in foreign currency exchange rates and foreign securities markets; risks to our international operations; the impact of changing regulation or accounting practices; Prudential Financial, Inc.’s primary reliance, as a holding company, on dividends from its subsidiaries to meet debt payment obligations and the applicable regulatory restrictions on the ability of the subsidiaries to pay such dividends; adverse litigation results; and changes in tax law. Prudential Financial, Inc. does not intend, and is under no obligation, to update any particular forward-looking statement included in this presentation. The information referred to above, as well as the risks of our businesses described in our Annual Report on Form 10-K for the year ended December 31, 2003, and our Quarterly Report on Form 10-Q for the quarter ended September 30, 2004, should be considered by readers when reviewing forward-looking statements contained in this presentation.
Investor Day 12.02.04 2
Non–GAAP Measure
In managing our businesses, we use a non-GAAP measure we call “adjusted operating income” to measure the performance of our Financial Services Businesses (FSB). Our goals for return on equity (ROE) and earnings per share (EPS) are based on FSB after-tax adjusted operating income and attributed equity. Adjusted operating income, which is not measured in accordance with generally accepted accounting principles (GAAP), excludes net realized investment gains and losses. A significant element of realized losses is impairments and losses from sales of credit-impaired securities, the timing of which depends largely on market credit cycles and can vary considerably across periods. The timing of other sales that would result in gains or losses is largely subject to our discretion and influenced by market opportunities. Similarly, adjusted operating income excludes investment gains and losses on trading account assets supporting insurance liabilities and changes in experience-rated contractholder liabilities due to asset value changes, because these recorded changes in asset and liability values will ultimately inure to contractholders. Trends in the underlying profitability of our businesses can be more clearly identified without the fluctuating effects of these transactions. Adjusted operating income also excludes the results of divested businesses, which are not relevant to our ongoing operations. Because we do not predict future realized investment gains/losses or recorded changes in asset and liability values that will ultimately inure to contractholders, we cannot provide a measure of our Common Stock earnings per share expectation based on income from continuing operations of the Financial Services Businesses, which is the GAAP measure most comparable to adjusted operating income. We believe that the presentation of adjusted operating income as we measure it for management purposes enhances the understanding of our results of operations by highlighting the results from ongoing operations and the underlying profitability factors of our businesses.
ROE based on annualized after-tax adjusted operating income is determined by dividing annualized after-tax adjusted operating income (giving effect to the direct equity adjustment), by average FSB attributed equity excluding unrealized gains and losses on investments. An alternative measure to ROE based on after-tax adjusted operating income is return on average equity (based on income from continuing operations). Return on average equity (based on income from continuing operations) represents annualized after-tax income from continuing operations as determined in accordance with GAAP (giving effect to the direct equity adjustment), divided by average FSB total attributed equity. Return on average equity (based on income from continuing operations) was 9.76% and 3.89% for the nine months ended September 30, 2004 and 2003, respectively. FSB attributed equity, including unrealized gains and losses on investments, was $20.457 billion and $20.541 billion as of September 30, 2004 and 2003, respectively.
For additional information about adjusted operating income and the comparable GAAP measure please refer to our Annual Report on Form 10-K for the year ended December 31, 2003, and our Quarterly Report on Form 10-Q for the quarter ended September 30, 2004, on the Investor Relations Web site at www.investor.prudential.com. Reconciliations between adjusted operating income and the comparable GAAP measure for the nine month periods ended September 30, 2004 and 2003, are included in this presentation. Additional historical information relating to the Company’s financial performance, including its third quarter 2004 Quarterly Financial Supplement, is also located on the Investor Relations Web site.
Investor Day 12.02.04 3
Reconciliation between adjusted operating income
and the comparable GAAP measure
Prudential Financial, Inc.
FINANCIAL HIGHLIGHTS
(in millions, except per share data)
| Nine months ended September 30, |
||||||
| 2003 |
2004 |
|||||
| Financial Services Businesses: |
||||||
| Pre-tax adjusted operating income by division: |
||||||
| Insurance Division |
582 | 694 | ||||
| Investment Division |
233 | 244 | ||||
| International Insurance and Investments Division |
618 | 733 | ||||
| Corporate and other operations |
49 | 144 | ||||
| Total pre-tax adjusted operating income |
1,482 | 1,815 | ||||
| Income taxes, applicable to adjusted operating income |
482 | 481 | ||||
| Financial Services Businesses after-tax adjusted operating income |
1,000 | 1,334 | ||||
| Items excluded from adjusted operating income: |
||||||
| Realized investment gains (losses), net, and related charges and adjustments |
(170 | ) | 182 | |||
| Investment gains (losses) on trading account assets supporting insurance liabilities, net |
— | (64 | ) | |||
| Change in experience-rated contractholder liabilities due to asset value changes |
— | 33 | ||||
| Divested businesses |
(450 | ) | (53 | ) | ||
| Total items excluded from adjusted operating income, before income taxes |
(620 | ) | 98 | |||
| Income taxes, applicable to items excluded from adjusted operating income |
(187 | ) | 9 | |||
| Total items excluded from adjusted operating income, after income taxes |
(433 | ) | 89 | |||
| Income from continuing operations (after-tax) of Financial Services Businesses before extraordinary gain on acquisition and cumulative effect of accounting change |
567 | 1,423 | ||||
| Loss from discontinued operations, net of taxes |
(23 | ) | (8 | ) | ||
| Extraordinary gain on acquisition, net of taxes |
— | 21 | ||||
| Cumulative effect of accounting change, net of taxes |
— | (79 | ) | |||
| Net income of Financial Services Businesses |
544 | 1,357 | ||||
| Earnings per share of Common Stock (diluted): |
||||||
| Financial Services Businesses after-tax adjusted operating income |
1.90 | 2.63 | ||||
| Items excluded from adjusted operating income: |
||||||
| Realized investment gains (losses), net, and related charges and adjustments |
(0.31 | ) | 0.34 | |||
| Investment gains (losses) on trading account assets supporting insurance liabilities, net |
— | (0.12 | ) | |||
| Change in experience-rated contractholder liabilities due to asset value changes |
— | 0.06 | ||||
| Divested businesses |
(0.82 | ) | (0.10 | ) | ||
| Total items excluded from adjusted operating income, before income taxes |
(1.13 | ) | 0.18 | |||
| Income taxes, applicable to items excluded from adjusted operating income |
(0.34 | ) | 0.02 | |||
| Total items excluded from adjusted operating income, after income taxes |
(0.79 | ) | 0.16 | |||
| Income from continuing operations (after-tax) of Financial Services Businesses before extraordinary gain on acquisition and cumulative effect of accounting change |
1.11 | 2.79 | ||||
| Loss from discontinued operations, net of taxes |
(0.04 | ) | (0.01 | ) | ||
| Extraordinary gain on acquisition, net of taxes |
— | 0.04 | ||||
| Cumulative effect of accounting change, net of taxes |
— | (0.15 | ) | |||
| Net income of Financial Services Businesses |
1.07 | 2.67 | ||||
| Weighted average number of outstanding Common shares (diluted basis) |
550.5 | 532.5 | ||||
| Reconciliation to Consolidated Net Income of Prudential Financial, Inc: |
||||||
| Net income of Financial Services Businesses (above) |
544 | 1,357 | ||||
| Net income of Closed Block Business |
145 | 321 | ||||
| Consolidated net income |
689 | 1,678 | ||||
| Direct equity adjustments for earnings per share calculations |
45 | 64 | ||||
Reconciliation between adjusted operating income
and the comparable GAAP measure (continued)
Prudential Financial, Inc.
COMBINED STATEMENTS OF OPERATIONS—FINANCIAL SERVICES BUSINESSES
(in millions)
| Nine months ended September 30, |
||||||
| 2003 |
2004 |
|||||
| Revenues (1): |
||||||
| Premiums |
5,876 | 6,577 | ||||
| Policy charges and fee income |
1,448 | 1,735 | ||||
| Net investment income |
3,717 | 3,979 | ||||
| Commissions, investment management fees, and other income |
2,648 | 2,497 | ||||
| Total revenues |
13,689 | 14,788 | ||||
| Benefits and Expenses (1): |
||||||
| Insurance and annuity benefits |
6,113 | 6,699 | ||||
| Interest credited to policyholders' account balances |
1,263 | 1,543 | ||||
| Interest expense |
143 | 193 | ||||
| Deferral of acquisition costs |
(917 | ) | (1,056 | ) | ||
| Amortization of acquisition costs |
452 | 585 | ||||
| General and administrative expenses |
5,153 | 5,009 | ||||
| Total benefits and expenses |
12,207 | 12,973 | ||||
| Adjusted operating income before income taxes |
1,482 | 1,815 | ||||
| Items excluded from adjusted operating income before income taxes: |
||||||
| Realized investment gains (losses), net, and related adjustments |
(145 | ) | 214 | |||
| Related charges |
(25 | ) | (32 | ) | ||
| Total realized investment gains (losses), net, and related charges and adjustments |
(170 | ) | 182 | |||
| Investment gains (losses) on trading account assets supporting insurance liabilities, net |
— | (64 | ) | |||
| Change in experience-rated contractholder liabilities due to asset value changes |
— | 33 | ||||
| Divested businesses |
(450 | ) | (53 | ) | ||
| Total items excluded from adjusted operating income before income taxes |
(620 | ) | 98 | |||
| Income from continuing operations before income taxes, extraordinary gain on acquisition and cumulative effect of accounting change |
862 | 1,913 | ||||
| Income tax expense |
295 | 490 | ||||
| Income from continuing operations before extraordinary gain on acquisition and cumulative effect of accounting change |
567 | 1,423 | ||||
| (1) | Revenues exclude realized investment gains, net of losses and related charges and adjustments, investment gains, net of losses, on trading account assets supporting insurance liabilities, and revenues of divested businesses. Benefits and expenses exclude charges related to realized investment gains, net of losses; changes in experience-rated contractholder liabilities due to asset value changes, and benefits and expenses of divested businesses. |

Investor Day
December 2, 2004
Investor Day 12.02.04 6

Prudential Financial, Inc.
Art Ryan
Chairman and CEO
Investor Day 12.02.04 7
ROE levers: 2001—2005
Expense cuts
Resolve underperforming businesses Grow high return businesses Redeploy capital
Investor Day 12.02.04 8
What has happened since demutualization
Divested P&C business
Combined retail brokerage into Wachovia Acquired American Skandia Acquired CIGNA Retirement Repurchased $2.9 billion of Common Stock(1) Increased cash dividend: 25% in 2003, 25% in 2004 Achieved significant expense reductions Doubled earnings per share(2) Maintained “AA” balance sheet and capital position
(1) Through September 30, 2004
(2) Based on after-tax adjusted operating income, year ended December 31, 2003 compared to year ended December 31, 2001
Investor Day 12.02.04 9
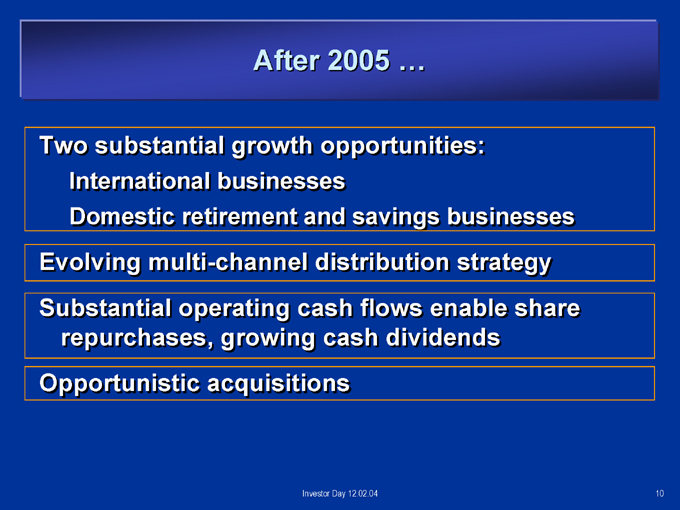
After 2005 …
Two substantial growth opportunities:
International businesses
Domestic retirement and savings businesses
Evolving multi-channel distribution strategy Substantial operating cash flows enable share repurchases, growing cash dividends Opportunistic acquisitions
Investor Day 12.02.04 10
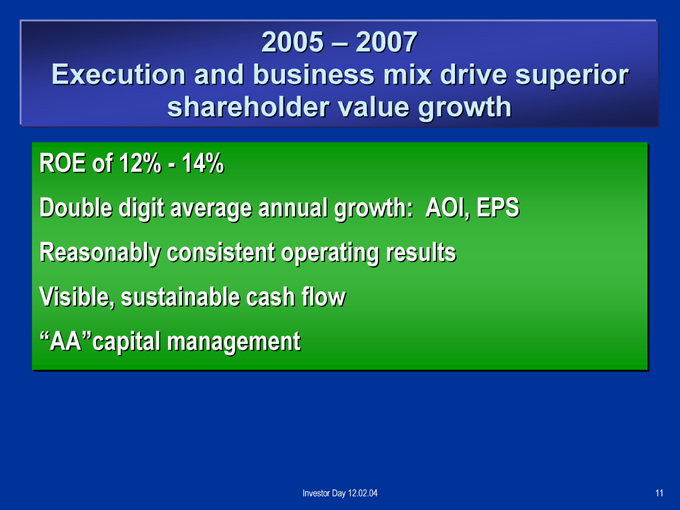
2005 — 2007
Execution and business mix drive superior shareholder value growth
ROE of 12% - 14%
Double digit average annual growth: AOI, EPS Reasonably consistent operating results Visible, sustainable cash flow “AA”capital management
Investor Day 12.02.04 11

Investor Day
December 2, 2004
Investor Day 12.02.04 12

Prudential Financial, Inc.
Mark Grier
Vice Chairman, Financial Management
Investor Day 12.02.04 13
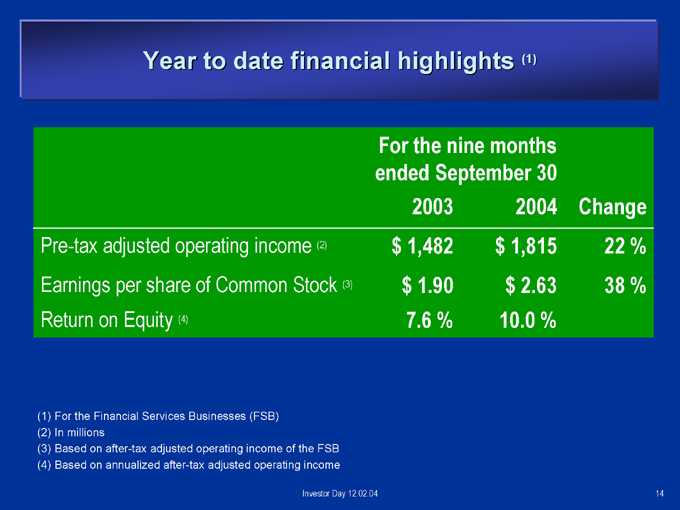
Year to date financial highlights (1)
For the nine months
ended September 30
2003 2004 Change
Pre-tax adjusted operating income (2) $1,482 $1,815 22%
Earnings per share of Common Stock (3) $1.90 $2.63 38%
Return on Equity (4) 7.6% 10.0%
(1) For the Financial Services Businesses (FSB) (2) In millions
(3) Based on after-tax adjusted operating income of the FSB (4) Based on annualized after-tax adjusted operating income
Investor Day 12.02.04 14
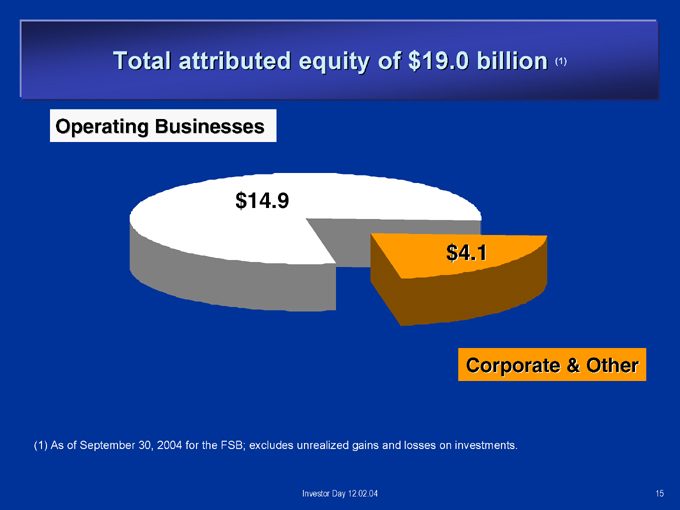
Total attributed equity of $19.0 billion (1)
Operating Businesses $14.9 $4.1
Corporate & Other
(1) As of September 30, 2004 for the FSB; excludes unrealized gains and losses on investments.
Investor Day 12.02.04 15
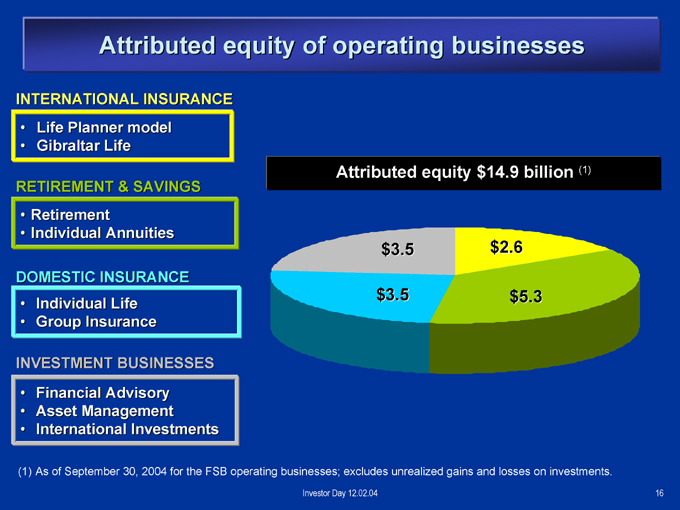
Attributed equity of operating businesses
INTERNATIONAL INSURANCE
Life Planner model
Gibraltar Life
RETIREMENT & SAVINGS
Retirement
Individual Annuities
DOMESTIC INSURANCE
Individual Life
Group Insurance
INVESTMENT BUSINESSES
Financial Advisory
Asset Management
International Investments
Attributed equity $14.9 billion (1) $2.6 $3.5 $5.3 $3.5
(1) As of September 30, 2004 for the FSB operating businesses; excludes unrealized gains and losses on investments.
Investor Day 12.02.04
16
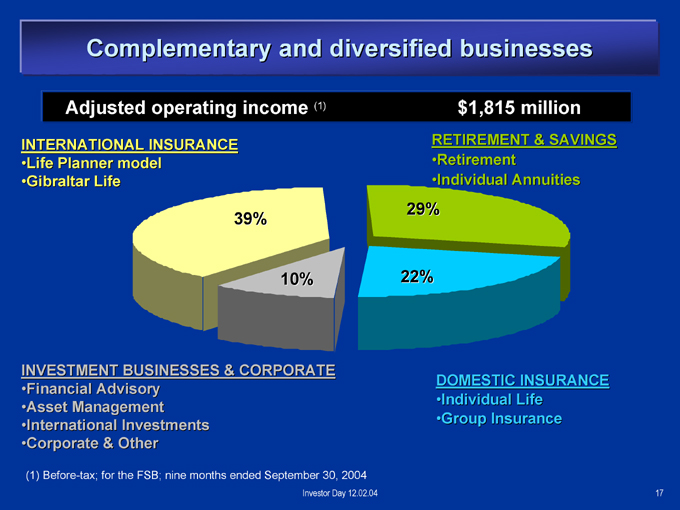
Complementary and diversified businesses
Adjusted operating income(1) $1,815 million
RETIREMENT & SAVINGS
Retirement
Individual Annuities
INTERNATIONAL INSURANCE
Life Planner model
Gibraltar Life
29% 39%
10% 22%
INVESTMENT BUSINESSES & CORPORATE
Financial Advisory
Asset Management International
Investments Corporate & Other
DOMESTIC INSURANCE
Individual Life
Group Insurance
(1) Before-tax; for the FSB; nine months ended September 30, 2004
Investor Day 12.02.04
17
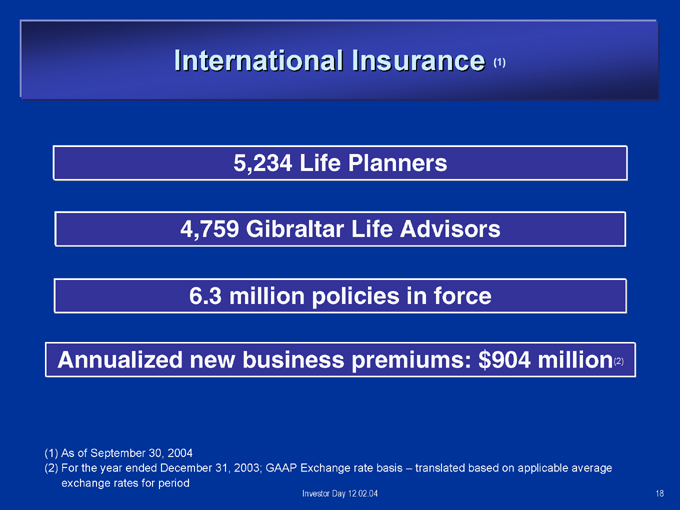
International Insurance (1)
5,234 Life Planners
4,759 Gibraltar Life Advisors
6.3 million policies in force
Annualized new business premiums: $904 million(2)
(1) As of September 30, 2004
(2) For the year ended December 31, 2003; GAAP Exchange rate basis – translated based on applicable average exchange rates for period
Investor Day 12.02.04
18
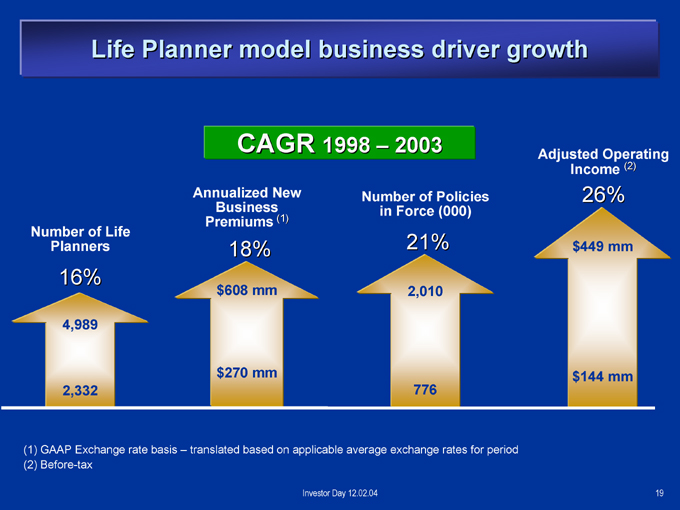
Life Planner model business driver growth
CAGR 1998 – 2003 Adjusted Operating Income (2)
Annualized New Number of Policies
Business in Force (000)
Premiums (1)
Number of Life 21% 26%
Planners 18% 16%
$608 mm 2,010 $449 mm 4,989
$270 mm 2,332 776 $144 mm
(1) GAAP Exchange rate basis – translated based on applicable average exchange rates for period
(2) Before-tax
Investor Day 12.02.04
19
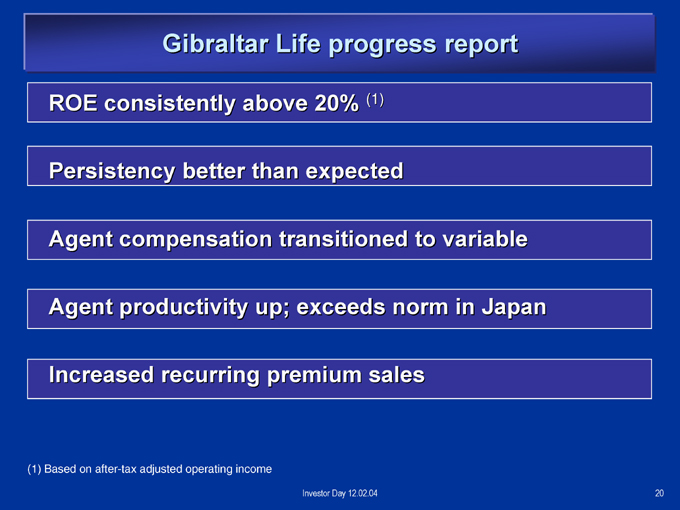
Gibraltar Life progress report
ROE consistently above 20% (1)
Persistency better than expected
Agent compensation transitioned to variable
Agent productivity up; exceeds norm in Japan
Increased recurring premium sales
(1) Based on after-tax adjusted operating income
Investor Day 12.02.04
20
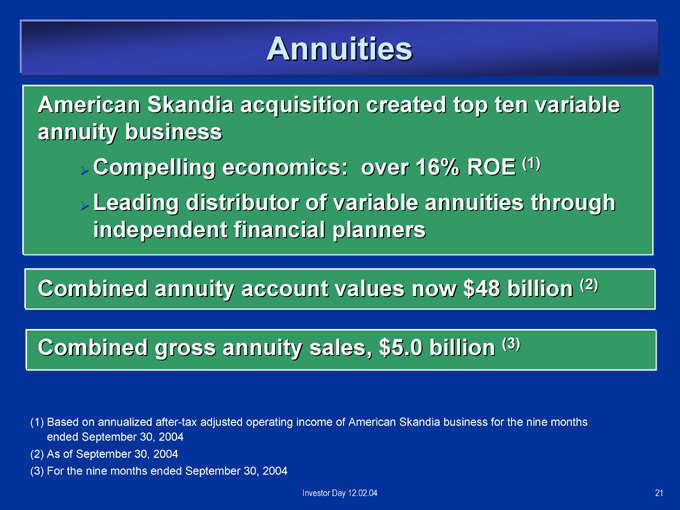
Annuities
American Skandia acquisition created top ten variable annuity business ?Compelling economics: over 16% ROE (1) ?Leading distributor of variable annuities through independent financial planners
Combined annuity account values now $48 billion (2)
Combined gross annuity sales, $5.0 billion (3)
(1) Based on annualized after-tax adjusted operating income of American Skandia business for the nine months ended September 30, 2004
(2) As of September 30, 2004
(3) For the nine months ended September 30, 2004
Investor Day 12.02.04
21
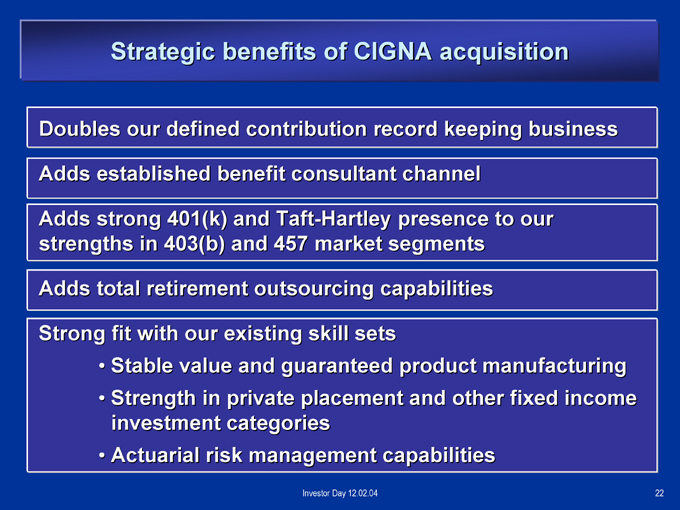
Strategic benefits of CIGNA acquisition
Doubles our defined contribution record keeping business
Adds established benefit consultant channel
Adds strong 401(k) and Taft-Hartley presence to our strengths in 403(b) and 457 market segments
Adds total retirement outsourcing capabilities
Strong fit with our existing skill sets
Stable value and guaranteed product manufacturing Strength in private placement and other fixed income investment categories Actuarial risk management capabilities
Investor Day 12.02.04 22
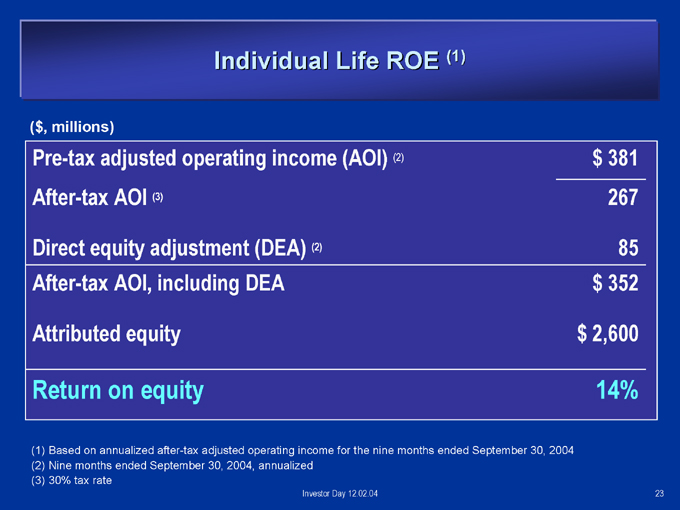
Individual Life ROE (1)
($, millions)
Pre-tax adjusted operating income (AOI) (2) $ 381
After-tax AOI (3) 267
Direct equity adjustment (DEA) (2) 85
After-tax AOI, including DEA $ 352
Attributed equity $ 2,600
Return on equity 14%
(1) Based on annualized after-tax adjusted operating income for the nine months ended September 30, 2004 (2) Nine months ended September 30, 2004, annualized (3) 30% tax rate
Investor Day 12.02.04 23
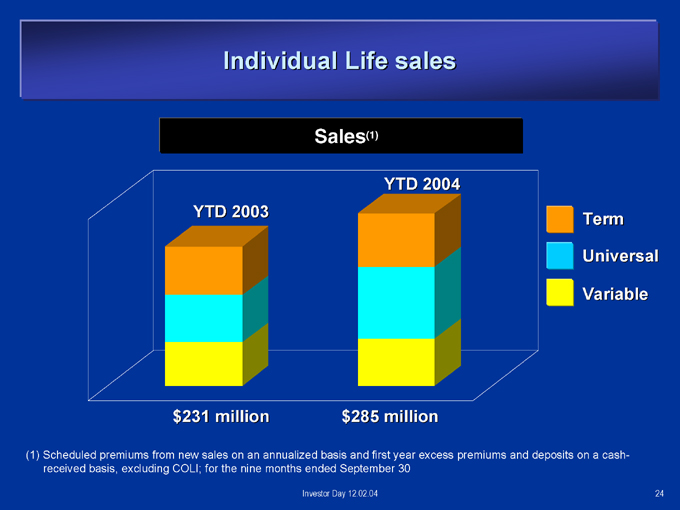
Individual Life sales
Sales(1)
YTD 2003
YTD 2004
Term Universal Variable $231 million $285 million
(1) Scheduled premiums from new sales on an annualized basis and first year excess premiums and deposits on a cash-received basis, excluding COLI; for the nine months ended September 30
Investor Day 12.02.04 24
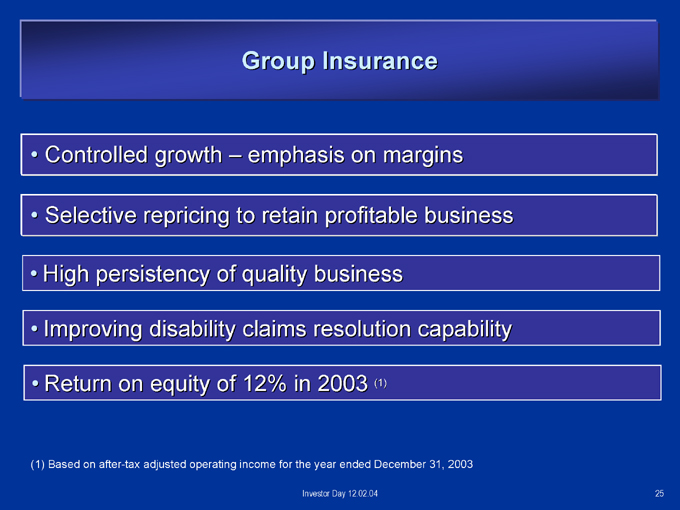
Group Insurance
Controlled growth – emphasis on margins Selective repricing to retain profitable business High persistency of quality business Improving disability claims resolution capability Return on equity of 12% in 2003 (1)
(1) Based on after-tax adjusted operating income for the year ended December 31, 2003
Investor Day 12.02.04 25
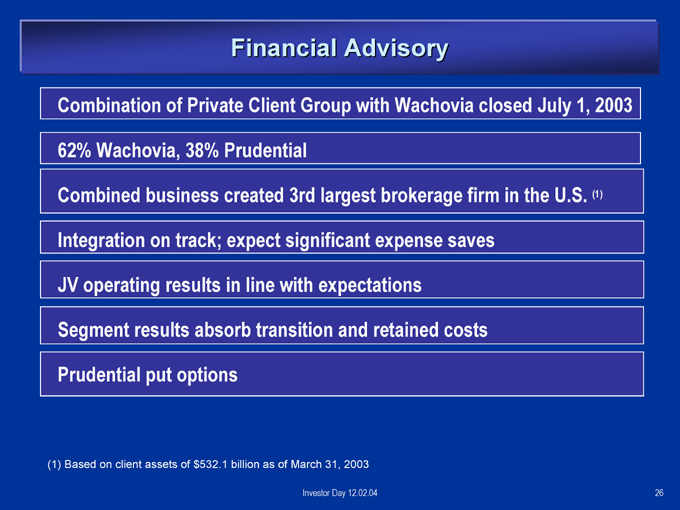
Financial Advisory
Combination of Private Client Group with Wachovia closed July 1, 2003 62% Wachovia, 38% Prudential Combined business created 3rd largest brokerage firm in the U.S. (1) Integration on track; expect significant expense saves JV operating results in line with expectations Segment results absorb transition and retained costs Prudential put options
(1) Based on client assets of $532.1 billion as of March 31, 2003
Investor Day 12.02.04 26
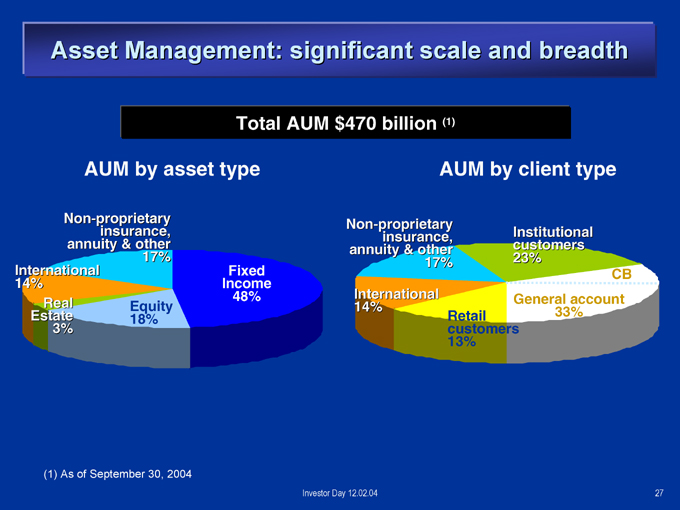
Asset Management: significant scale and breadth
Total AUM $470 billion (1)
AUM by asset type
AUM by client type
Non-proprietary insurance, annuity & other 17%
International Fixed 14% Real Income 48% Equity 18% Estate 3%
Non-proprietary insurance, Institutional customers annuity & other 17% 23%
CB International 14% General account 33% Retail customers 13%
(1) As of September 30, 2004
Investor Day 12.02.04 27

Financial strength (1)
Attributed equity (excl FAS 115, in millions) $ 18,987
Corporate Debt/Capital (2) 14.1 %
Fixed Maturities (in millions)
Gross unrealized gains $ 4,705
Gross unrealized losses $ 429
Net unrealized gains $ 4,276
(1) Financial Services Businesses; as of September 30, 2004 (2) Based on definition in the Quarterly Financial Supplement
Investor Day 12.02.04 28
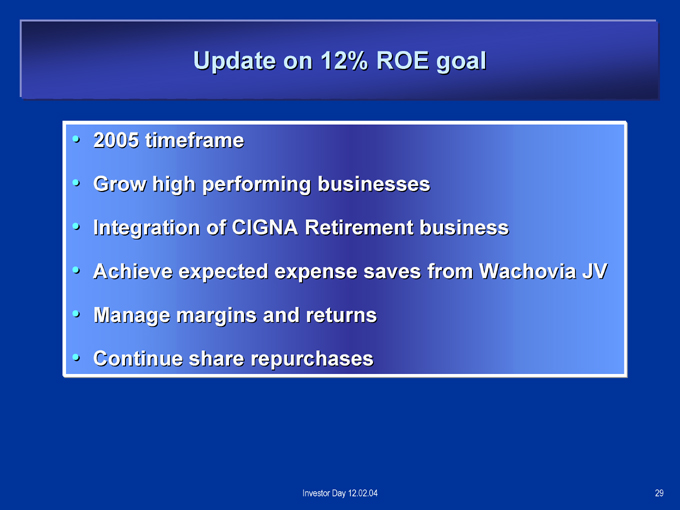
Update on 12% ROE goal
2005 timeframe
Grow high performing businesses Integration of CIGNA Retirement business
Achieve expected expense saves from Wachovia JV Manage margins and returns
Continue share repurchases
Investor Day 12.02.04 29

Investor Day
December 2, 2004
Investor Day 12.02.04 30

Retirement and Annuities: Key Businesses in a Growing Market
John Strangfeld
Vice Chairman, Investment Division
Investor Day 12.02.04
31
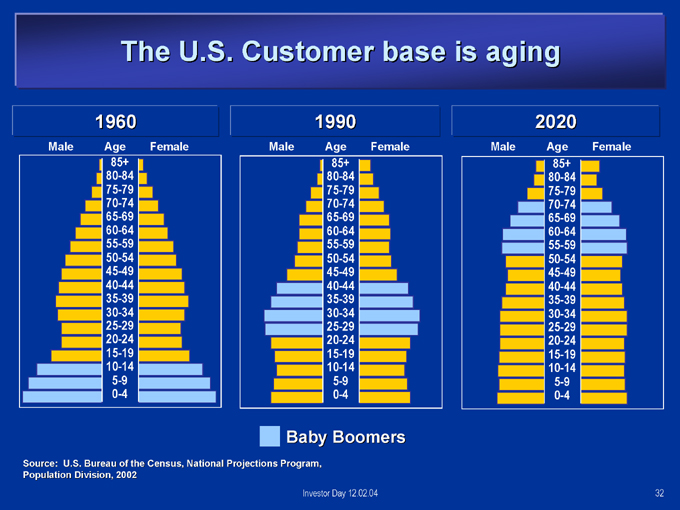
The U.S. Customer base is aging
1960
Male Age Female
85+ 80-84 75-79 70-74 65-69 60-64 55-59 50-54 45-49 40-44 35-39 30-34 25-29 20-24 15-19 10-14 5-9 0-4
1990
Male Age Female
85+ 80-84 75-79 70-74 65-69 60-64 55-59 50-54 45-49 40-44 35-39 30-34 25-29 20-24 15-19 10-14 5-9 0-4
2020
Male Age Female
85+ 80-84 75-79 70-74 65-69 60-64 55-59 50-54 45-49 40-44 35-39 30-34 25-29 20-24 15-19 10-14 5-9 0-4
Baby Boomers
Source: U.S. Bureau of the Census, National Projections Program, Population Division, 2002
Investor Day 12.02.04 32
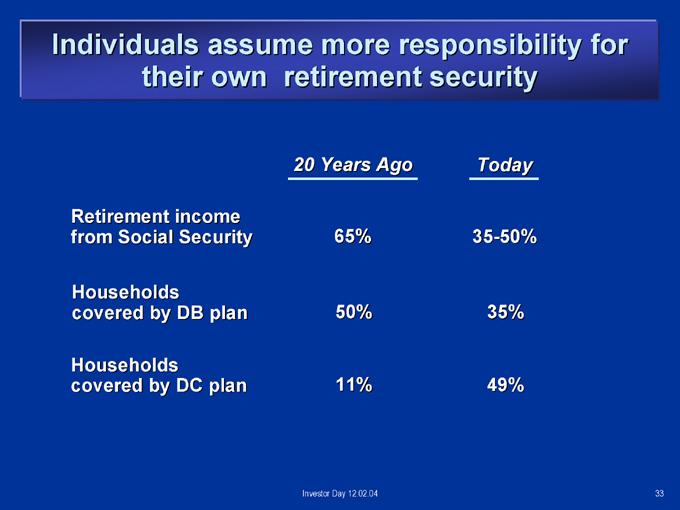
Individuals assume more responsibility for their own retirement security
20 Years Ago Today
Retirement income
from Social Security 65% 35-50%
Households
covered by DB plan 50% 35%
Households
covered by DC plan 11% 49%
Investor Day 12.02.04 33
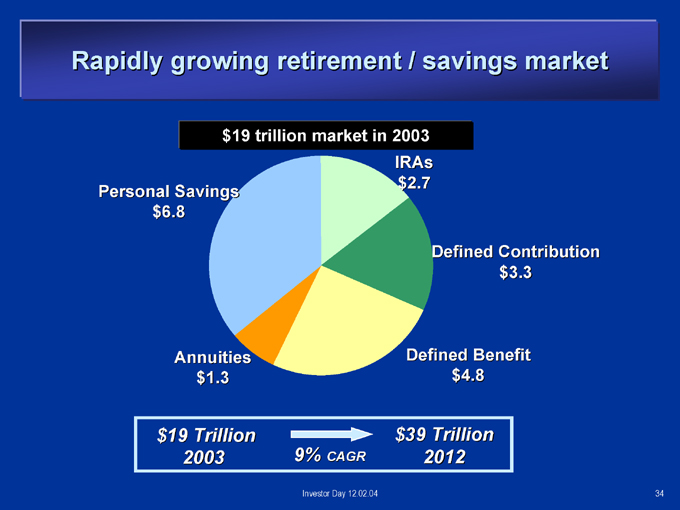
Rapidly growing retirement / savings market
$19 trillion market in 2003 IRAs $2.7 Personal Savings $6.8
Defined Contribution $3.3
Annuities Defined Benefit $1.3 $4.8 $19 Trillion 2003
9% CAGR
$39 Trillion 2012
Investor Day 12.02.04 34
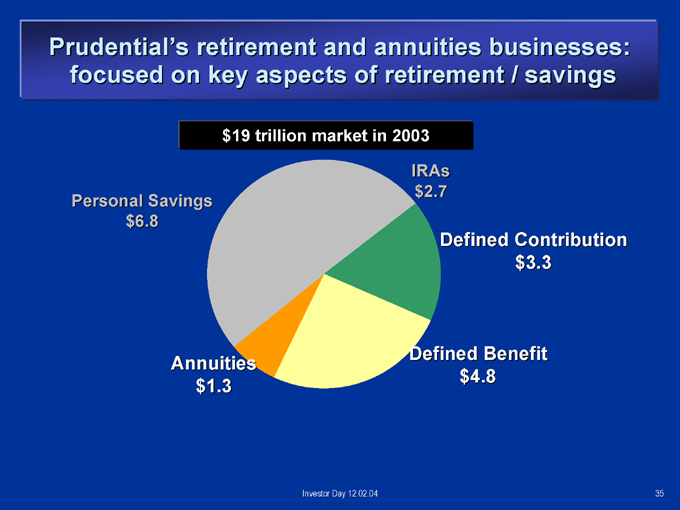
Prudential’s retirement and annuities businesses: focused on key aspects of retirement / savings
$19 trillion market in 2003
IRAs $2.7 Personal Savings $6.8
Defined Contribution $3.3
Defined Benefit Annuities $4.8 $1.3
Investor Day 12.02.04 35
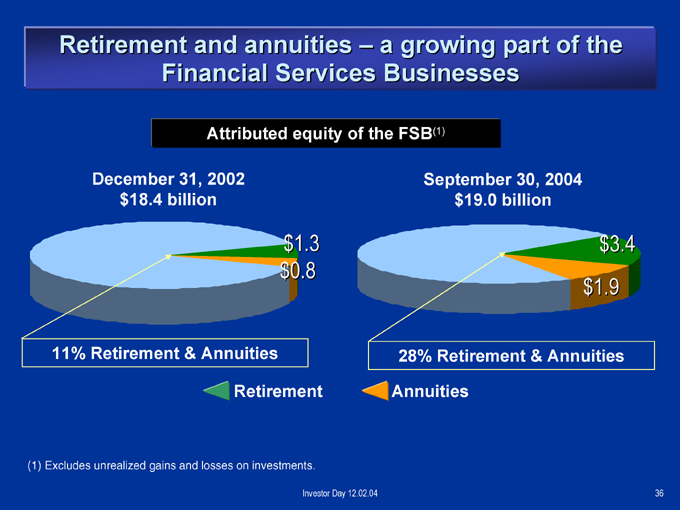
Retirement and annuities – a growing part of the Financial Services Businesses
Attributed equity of the FSB(1)
December 31, 2002 September 30, 2004 $18.4 billion $19.0 billion
$1.3 $3.4 $0.8 $1.9
11% Retirement & Annuities 28% Retirement & Annuities Retirement Annuities
(1) Excludes unrealized gains and losses on investments.
Investor Day 12.02.04 36
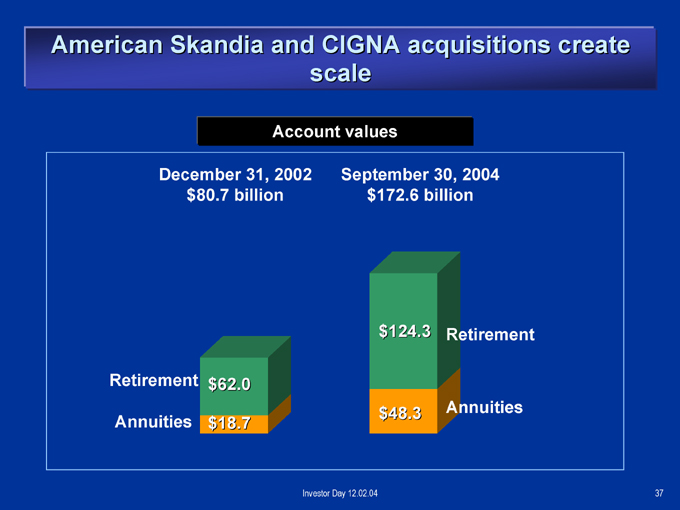
American Skandia and CIGNA acquisitions create scale
Account values
December 31, 2002 September 30, 2004 $80.7 billion $172.6 billion
$124.3 Retirement
Retirement $62.0 $48.3 Annuities Annuities $18.7
Investor Day 12.02.04 37

Retirement and annuities – a growing contribution to earnings results
Adjusted operating income of the FSB (1)
Year ended December 31, 2002 $1.7 billion
Nine months ended September 30, 2004 (2) $1.8 billion
6% Retirement & Annuities
29% Retirement & Annuities
(1) Pre-tax
(2) Includes results of retirement business acquired from CIGNA commencing on acquisition date April 1, 2004
Investor Day 12.02.04 38
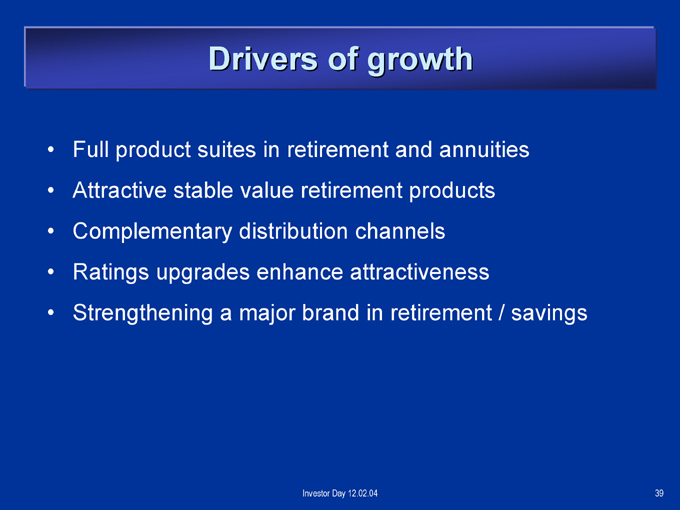
Drivers of growth
Full product suites in retirement and annuities Attractive stable value retirement products Complementary distribution channels Ratings upgrades enhance attractiveness Strengthening a major brand in retirement / savings
Investor Day 12.02.04
39
Summary
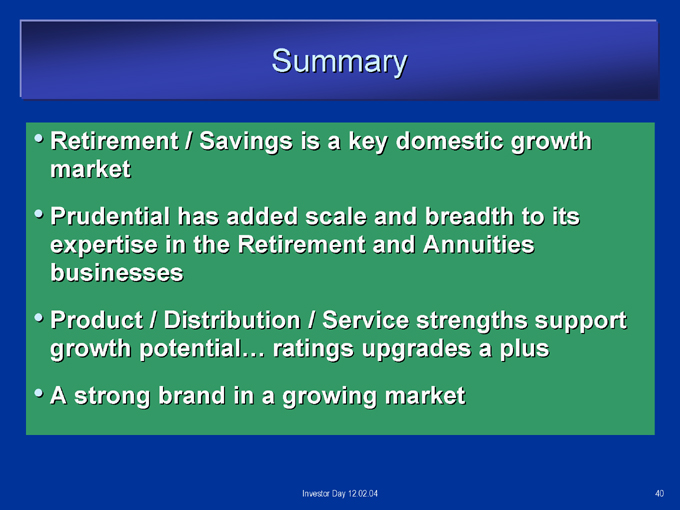
Retirement / Savings is a key domestic growth market Prudential has added scale and breadth to its expertise in the Retirement and Annuities businesses Product / Distribution / Service strengths support growth potential… ratings upgrades a plus A strong brand in a growing market
Investor Day 12.02.04
40

Investor Day
December 2, 2004
Investor Day 12.02.04 41

Prudential Retirement
John Kim
President, Prudential Retirement
Investor Day 12.02.04
42
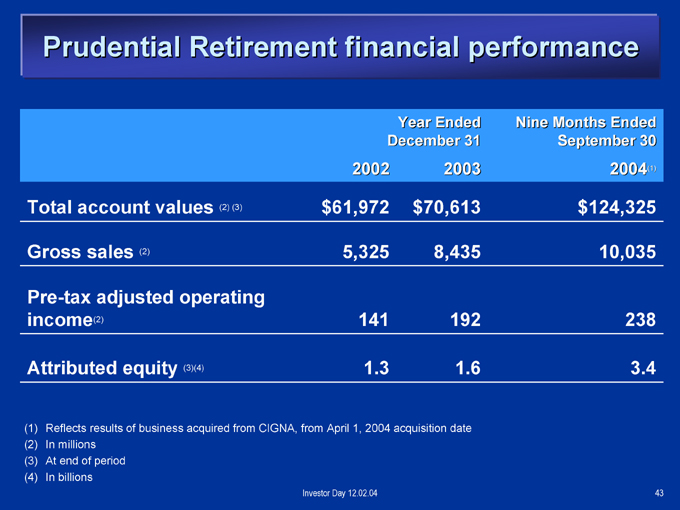
Prudential Retirement financial performance
Year Ended Nine Months Ended
December 31 September 30
2002 2003 2004(1)
Total account values (2) (3) $61,972 $70,613 $124,325
Gross sales (2) 5,325 8,435 10,035
Pre-tax adjusted operating
income(2) 141 192 238
Attributed equity (3)(4) 1.3 1.6 3.4
(1) Reflects results of business acquired from CIGNA, from April 1, 2004 acquisition date (2) In millions (3) At end of period (4) In billions
Investor Day 12.02.04 43
A Growing Part of “Grow and Protect”
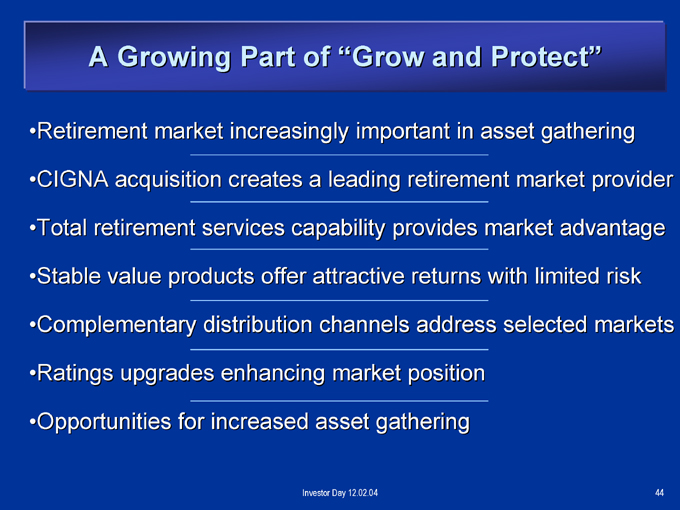
Retirement market increasingly important in asset gathering •CIGNA acquisition creates a leading retirement market provider •Total retirement services capability provides market advantage •Stable value products offer attractive returns with limited risk Complementary distribution channels address selected markets •Ratings upgrades enhancing market position Opportunities for increased asset gathering
Investor Day 12.02.04 44
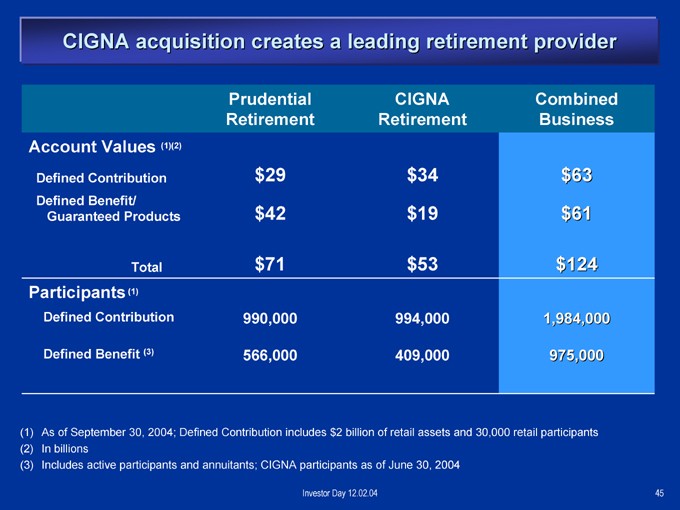
CIGNA acquisition creates a leading retirement provider
Prudential CIGNA Combined
Retirement Retirement Business
Account Values (1)(2)
Defined Contribution $29 $34 $63
Defined Benefit/
Guaranteed Products $42 $19 $61
Total $71 $53 $124
Participants(1)
Defined Contribution 990,000 994,000 1,984,000
Defined Benefit (3) 566,000 409,000 975,000
(1) As of September 30, 2004; Defined Contribution includes $2 billion of retail assets and 30,000 retail participants (2) In billions (3) Includes active participants and annuitants; CIGNA participants as of June 30, 2004
Investor Day 12.02.04 45
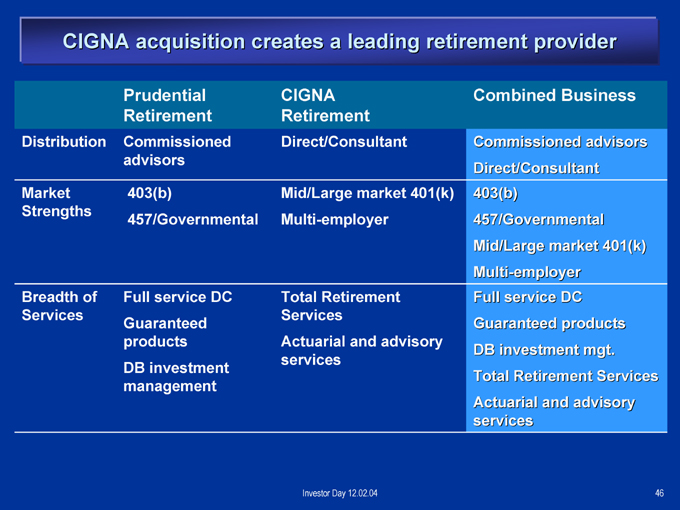
CIGNA acquisition creates a leading retirement provider
Prudential CIGNA Combined Business
Retirement Retirement
Distribution Commissioned Direct/Consultant Commissioned advisors
advisors
Direct/Consultant
Market 403(b) Mid/Large market 401(k) 403(b)
Strengths
457/Governmental Multi-employer 457/Governmental
Mid/Large market 401(k)
Multi-employer
Breadth of Full service DC Total Retirement Full service DC
Services Services
Guaranteed Guaranteed products
products Actuarial and advisory
DB investment mgt.
services
DB investment
Total Retirement Services
management
Actuarial and advisory
services
Investor Day 12.02.04 46
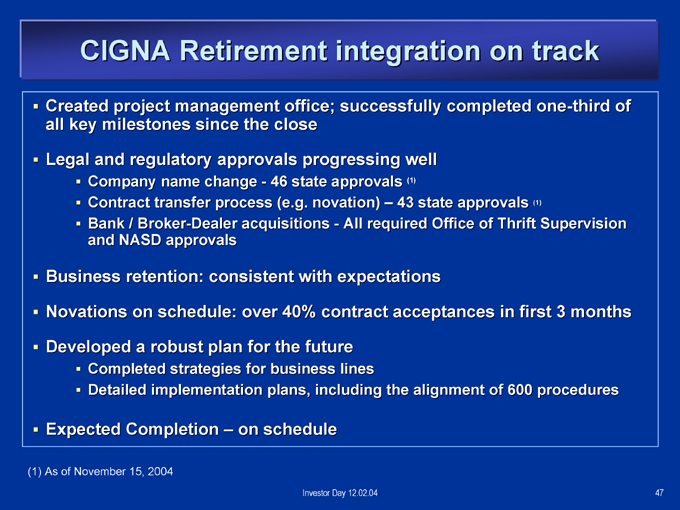
CIGNA Retirement integration on track
Created project management office; successfully completed one-third of all key milestones since the close
Legal and regulatory approvals progressing well
Company name change—46 state approvals (1)
Contract transfer process (e.g. novation) – 43 state approvals (1)
Bank / Broker-Dealer acquisitions—All required Office of Thrift Supervision and NASD approvals
Business retention: consistent with expectations
Novations on schedule: over 40% contract acceptances in first 3 months
Developed a robust plan for the future
Completed strategies for business lines
Detailed implementation plans, including the alignment of 600 procedures
Expected Completion – on schedule
(1) As of November 15, 2004
Investor Day 12.02.04
47
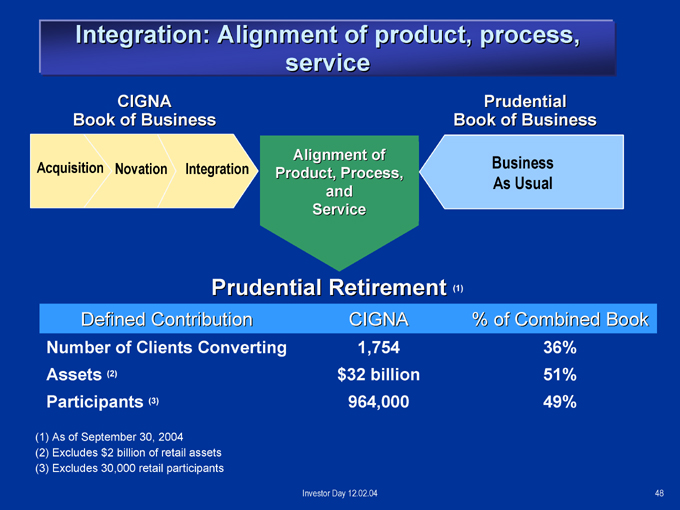
Integration: Alignment of product, process, service
CIGNA Book of Business
Acquisition Novation Integration
Alignment of Product, Process, and Service
Prudential Book of Business
Business As Usual
Prudential Retirement (1)
Defined Contribution CIGNA % of Combined Book
Number of Clients Converting 1,754 36%
Assets (2) $32 billion 51%
Participants (3) 964,000 49%
(1) As of September 30, 2004 (2) Excludes $2 billion of retail assets (3) Excludes 30,000 retail participants
Investor Day 12.02.04 48
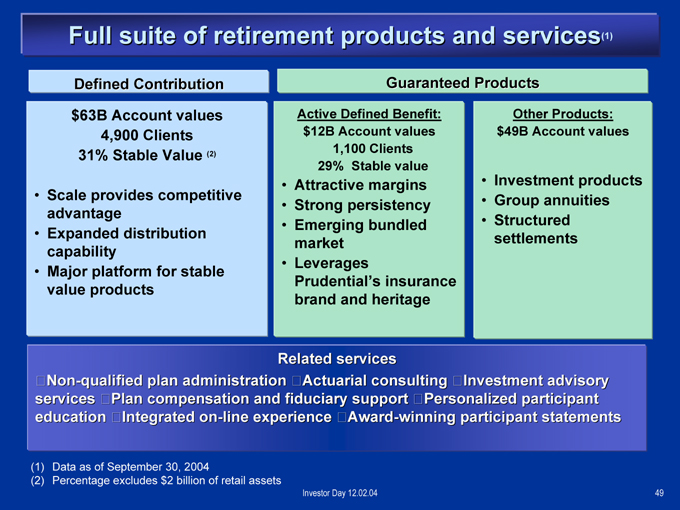
Full suite of retirement products and services(1)
Defined Contribution $63B Account values 4,900 Clients 31% Stable Value (2)
Scale provides competitive advantage Expanded distribution capability Major platform for stable value products
Guaranteed Products
Active Defined Benefit: $12B Account values 1,100 Clients 29% Stable value
Attractive margins Strong persistency Emerging bundled market Leverages Prudential’s insurance brand and heritage
Other Products: $49B Account values
Investment products Group annuities Structured settlements
Related services
_Non-qualified plan administration _Actuarial consulting _Investment advisory services _Plan compensation and fiduciary support _Personalized participant education _Integrated on-line experience _Award-winning participant statements
(1) Data as of September 30, 2004
(2) Percentage excludes $2 billion of retail assets
Investor Day 12.02.04 49
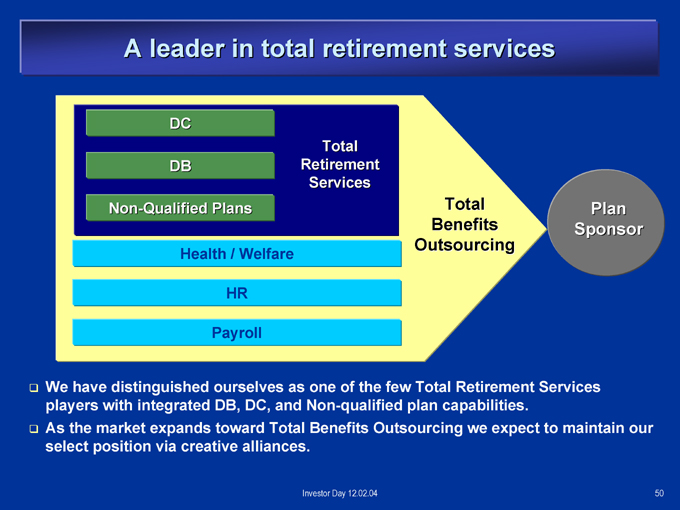
A leader in total retirement services
DC
Total DB Retirement
Services
Non-Qualified Plans Total Plan Benefits Sponsor Outsourcing
Health / Welfare
HR
Payroll
We have distinguished ourselves as one of the few Total Retirement Services players with integrated DB, DC, and Non-qualified plan capabilities.
As the market expands toward Total Benefits Outsourcing we expect to maintain our select position via creative alliances.
Investor Day 12.02.04 50
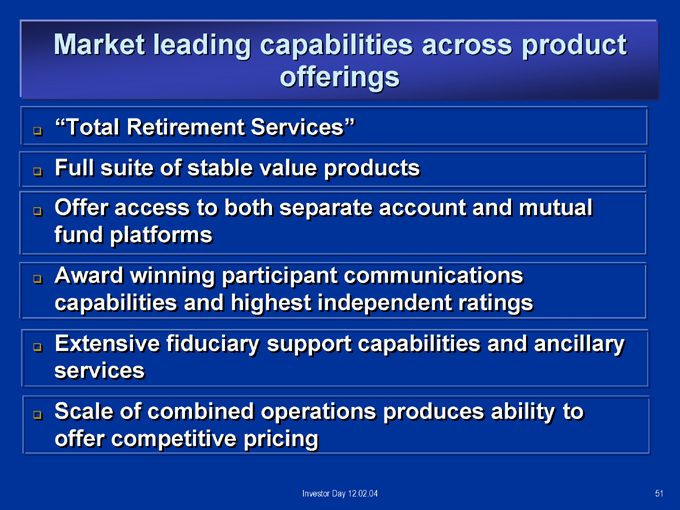
Market leading capabilities across product offerings
“Total Retirement Services” Full suite of stable value products
Offer access to both separate account and mutual fund platforms Award winning participant communications capabilities and highest independent ratings Extensive fiduciary support capabilities and ancillary services Scale of combined operations produces ability to offer competitive pricing
Investor Day 12.02.04 51
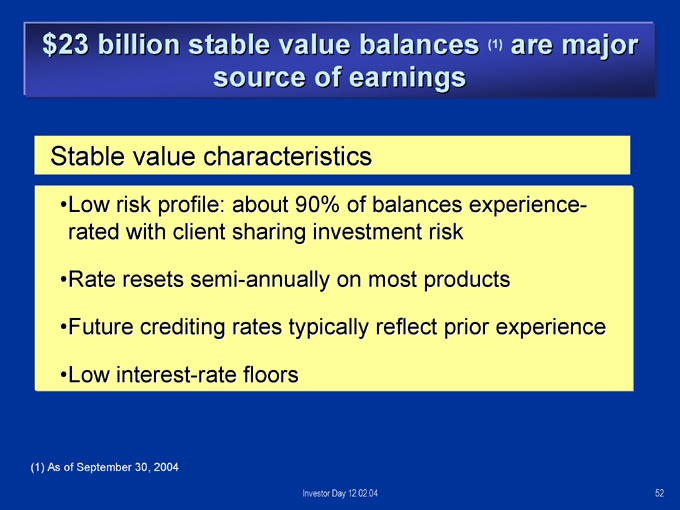
$23 billion stable value balances (1) are major source of earnings
Stable value characteristics
Low risk profile: about 90% of balances experience-rated with client sharing investment risk
Rate resets semi-annually on most products
Future crediting rates typically reflect prior experience
Low interest-rate floors
(1) As of September 30, 2004
Investor Day 12.02.04
52
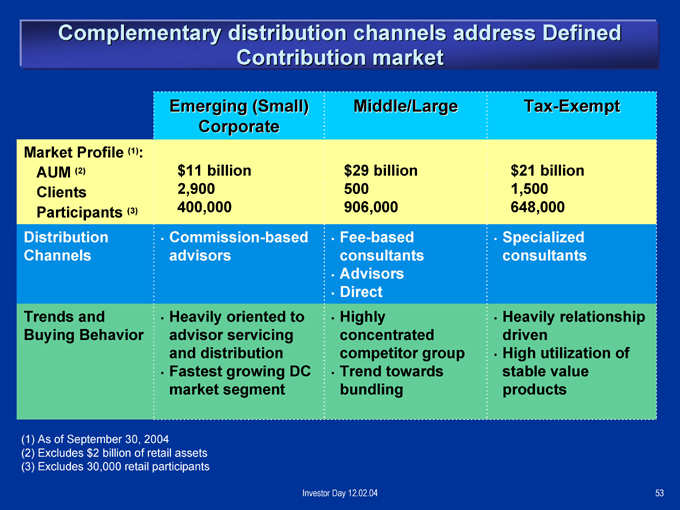
Complementary distribution channels address Defined Contribution market
Emerging (Small) Middle/Large Tax-Exempt
Corporate
Market Profile (1):
AUM (2) $11 billion $29 billion $21 billion
Clients 2,900 500 1,500
Participants (3) 400,000 906,000 648,000
Distribution Commission-based Fee-based Specialized
Channels advisors consultants consultants
Advisors
Direct
Trends and Heavily oriented to Highly Heavily relationship
Buying Behavior advisor servicing concentrated driven
and distribution competitor group High utilization of
Fastest growing DC Trend towards stable value
market segment bundling products
(1) As of September 30, 2004 (2) Excludes $2 billion of retail assets (3) Excludes 30,000 retail participants
Investor Day 12.02.04 53
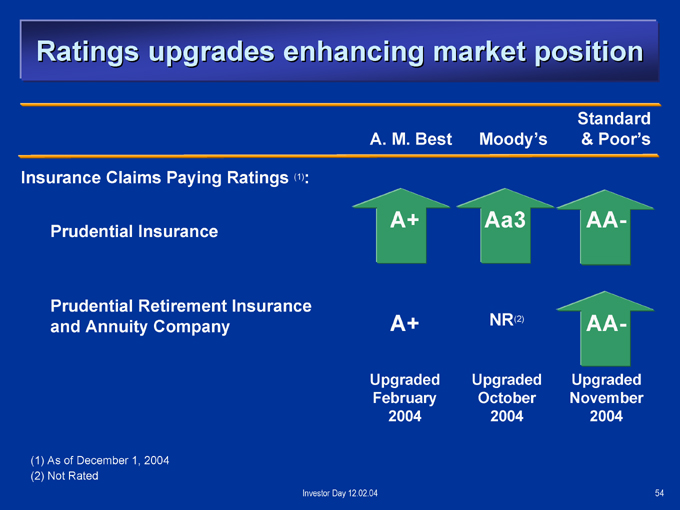
Ratings upgrades enhancing market position
Standard A. M. Best Moody’s & Poor’s
Insurance Claims Paying Ratings (1):
Prudential Insurance
Prudential Retirement Insurance and Annuity Company
A+ Aa3 AA-
A+ NR(2) AA-
Upgraded Upgraded Upgraded February October November 2004 2004 2004
(1) As of December 1, 2004 (2) Not Rated
Investor Day 12.02.04
54
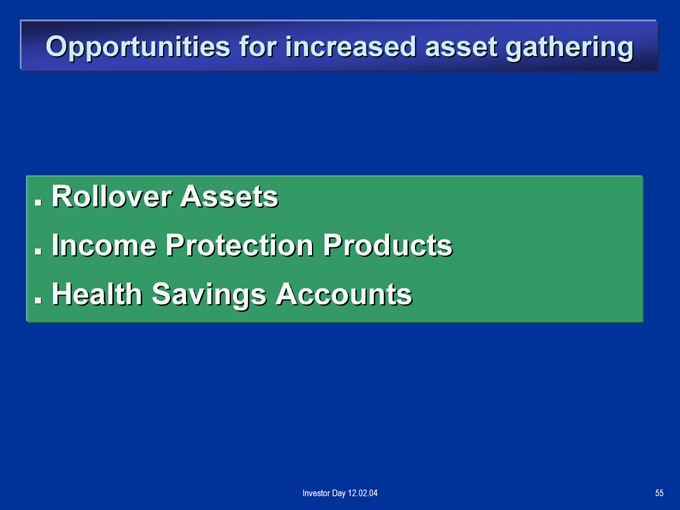
Opportunities for increased asset gathering
Rollover Assets
Income Protection Products Health Savings Accounts
Investor Day 12.02.04 55
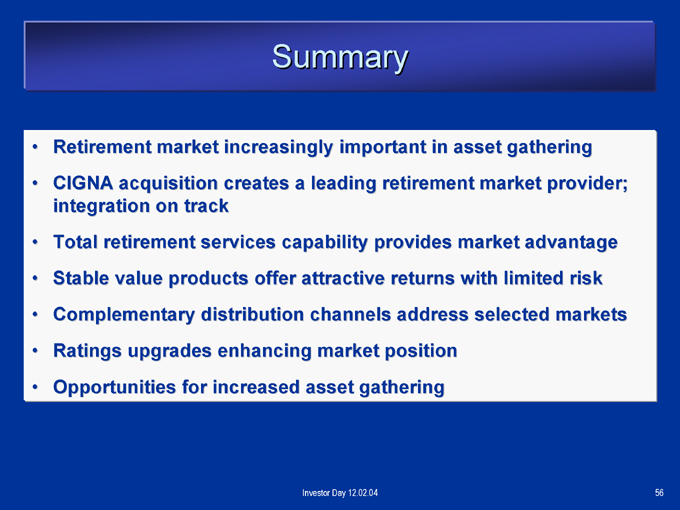
Summary
Retirement market increasingly important in asset gathering CIGNA acquisition creates a leading retirement market provider; integration on track Total retirement services capability provides market advantage Stable value products offer attractive returns with limited risk Complementary distribution channels address selected markets Ratings upgrades enhancing market position Opportunities for increased asset gathering
Investor Day 12.02.04
56

Investor Day
December 2, 2004
Investor Day 12.02.04
57

Individual Annuities
David Odenath
President, Prudential Annuities
Investor Day 12.02.04 58
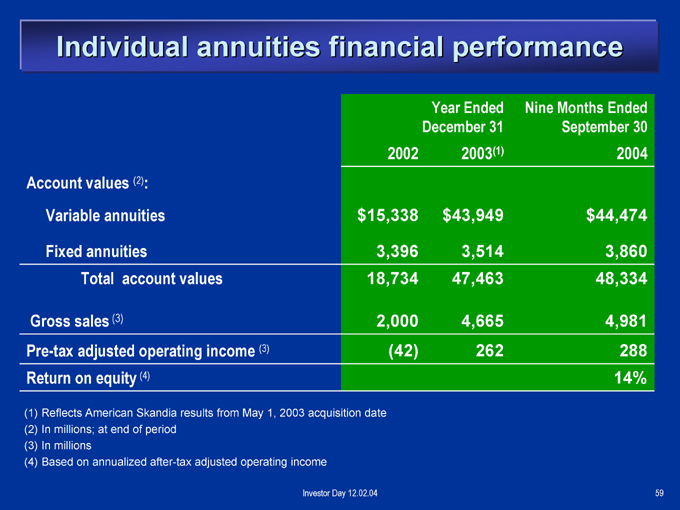
Individual annuities financial performance
Year Ended Nine Months Ended
December 31 September 30
2002 2003(1) 2004
Account values (2):
Variable annuities $ 15,338 $ 43,949 $ 44,474
Fixed annuities 3,396 3,514 3,860
Total account values 18,734 47,463 48,334
Gross sales (3) 2,000 4,665 4,981
Pre-tax adjusted operating income (3) (42) 262 288
Return on equity (4) 14%
(1) Reflects American Skandia results from May 1, 2003 acquisition date (2) In millions; at end of period (3) In millions (4) Based on annualized after-tax adjusted operating income
Investor Day 12.02.04
59
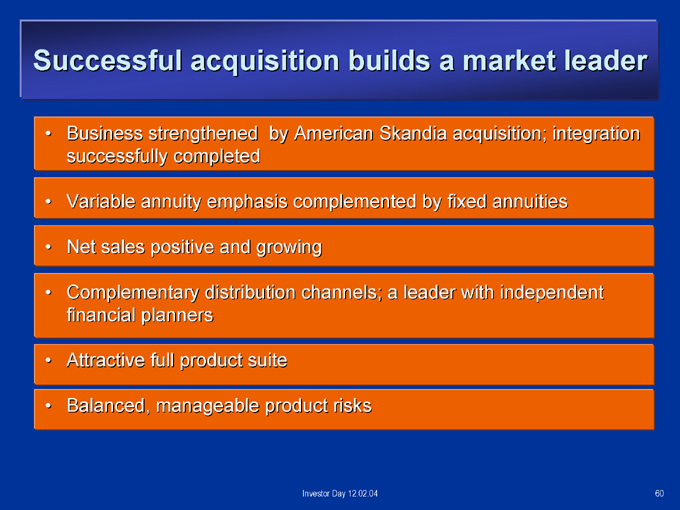
Successful acquisition builds a market leader
Business strengthened by American Skandia acquisition; integration successfully completed
Variable annuity emphasis complemented by fixed annuities
Net sales positive and growing
Complementary distribution channels; a leader with independent financial planners
Attractive full product suite
Balanced, manageable product risks
Investor Day 12.02.04
60
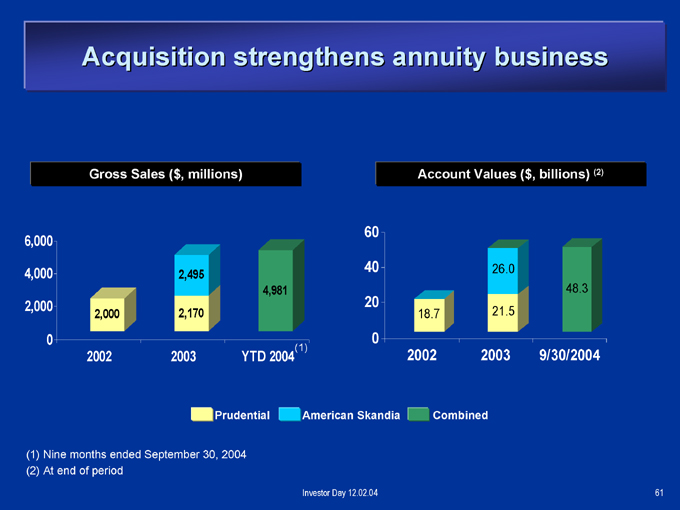
Acquisition strengthens annuity business
Gross Sales ($, millions)
6,000 4,000 2,000 0
2,000
2002
2,495
2,170
2003
4,981
YTD 2004(1)
Account Values ($, billions) (2)
60 40 20 0
18.7
2002
26.0
21.5
2003
48.3
9/30/2004
Prudential
American Skandia
Combined
(1) Nine months ended September 30, 2004 (2) At end of period
Investor Day 12.02.04
61

Market share has climbed as a result of the acquisition
Prudential variable annuity market share (1) (2)
6.00% 5.00% 4.00% 3.00% 2.00%
5.2%
5.0% 4.9% 5.0% 4.2% 4.6% 4.6% 4.6% 4.4% 4.5% 4.2% 4.1% 4.0% 3.4% 3.4%
1Q’01 2Q’01 3Q’01 4Q’01 1Q’02 2Q’02
Prior to acquisition 3Q’
02 4Q’02 1Q’03 2Q’03 3Q’03 4Q’
Post-acquisition 03
1Q’04 2Q’04 3Q’04
(1) According to VARDS (reflects total variable annuity industry)
(2) Prudential and American Skandia combined for all periods
Investor Day 12.02.04 62
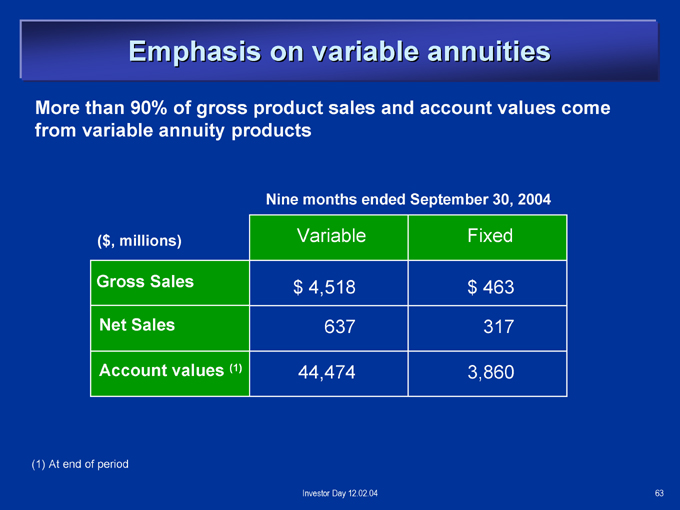
Emphasis on variable annuities
More than 90% of gross product sales and account values come from variable annuity products
Nine months ended September 30, 2004
($, millions) Variable Fixed
Gross Sales $ 4,518 $ 463
Net Sales 637 317
Account values (1) 44,474 3,860
(1) At end of period
Investor Day 12.02.04
63
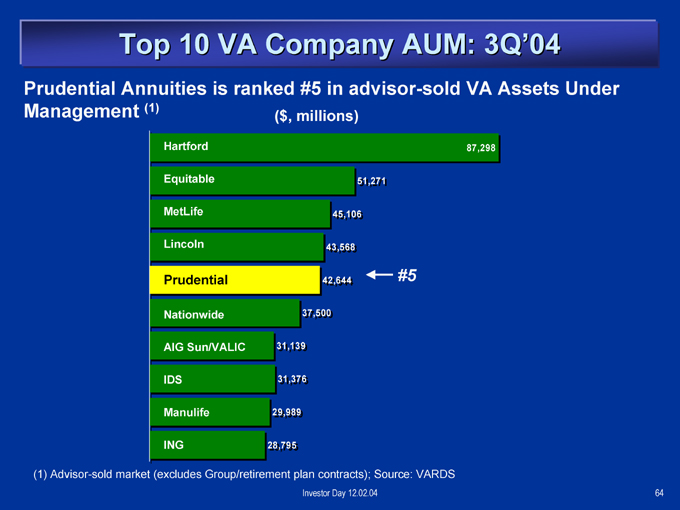
Top 10 VA Company AUM: 3Q’04
Prudential Annuities is ranked #5 in advisor-sold VA Assets Under
Management (1) ($, millions)
Hartford 87,298
Equitable 51,271
MetLife 45,106
Lincoln 43,568
Prudential 42,644 #5
Nationwide 37,500
AIG Sun/VALIC 31,139
IDS 31,376
Manulife 29,989
ING 28,795
(1) Advisor-sold market (excludes Group/retirement plan contracts); Source: VARDS
Investor Day 12.02.04 64
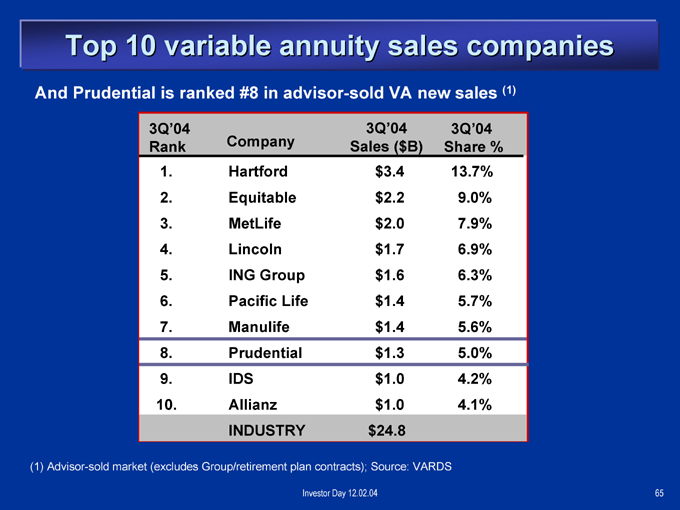
Top 10 variable annuity sales companies
And Prudential is ranked #8 in advisor-sold VA new sales (1)
3Q’04 3Q’04 3Q’04
Rank Company Sales ($B) Share%
1. Hartford $3.4 13.7%
2. Equitable $2.2 9.0%
3. MetLife $2.0 7.9%
4. Lincoln $1.7 6.9%
5. ING Group $1.6 6.3%
6. Pacific Life $1.4 5.7%
7. Manulife $1.4 5.6%
8. Prudential $1.3 5.0%
9. IDS $1.0 4.2%
10. Allianz $1.0 4.1%
INDUSTRY $24.8
(1) Advisor-sold market (excludes Group/retirement plan contracts); Source: VARDS
Investor Day 12.02.04
65
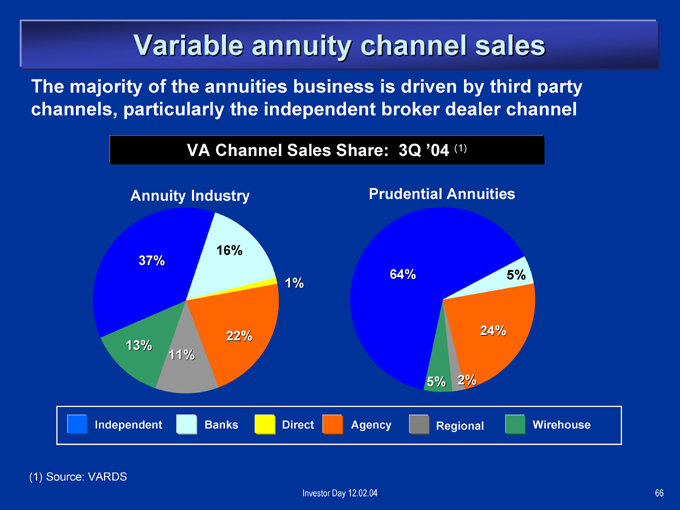
Variable annuity channel sales
The majority of the annuities business is driven by third party channels, particularly the independent broker dealer channel
VA Channel Sales Share: 3Q ‘04 (1)
Annuity Industry
16% 37%
1%
22% 13% 11%
Prudential Annuities
64% 5%
24%
5% 2%
Independent Banks Direct Agency Regional Wirehouse
(1) Source: VARDS
Investor Day 12.02.04
66
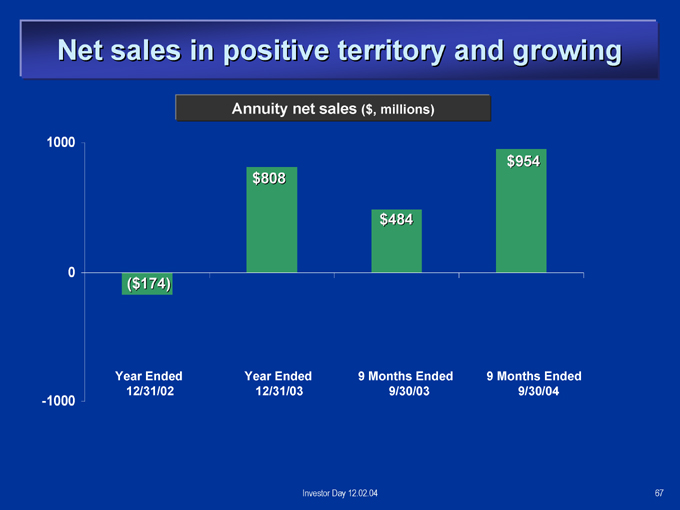
Net sales in positive territory and growing
Annuity net sales ($, millions)
1000 0 -1000
($174) $808 $484 $954
Year Ended Year Ended 9 Months Ended 9 Months Ended 12/31/02 12/31/03 9/30/03 9/30/04
Investor Day 12.02.04
67
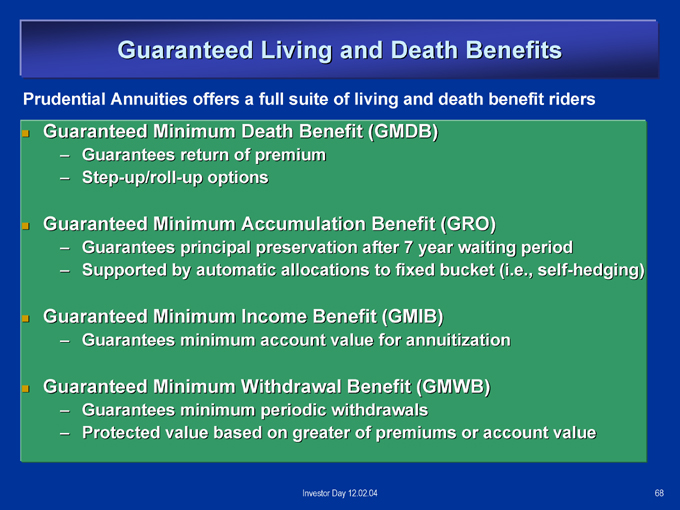
Guaranteed Living and Death Benefits
Prudential Annuities offers a full suite of living and death benefit riders
Guaranteed Minimum Death Benefit (GMDB)
Guarantees return of premium
Step-up/roll-up options
Guaranteed Minimum Accumulation Benefit (GRO)
Guarantees principal preservation after 7 year waiting period
Supported by automatic allocations to fixed bucket (i.e., self-hedging)
Guaranteed Minimum Income Benefit (GMIB)
Guarantees minimum account value for annuitization
Guaranteed Minimum Withdrawal Benefit (GMWB)
Guarantees minimum periodic withdrawals
Protected value based on greater of premiums or account value
Investor Day 12.02.04
68
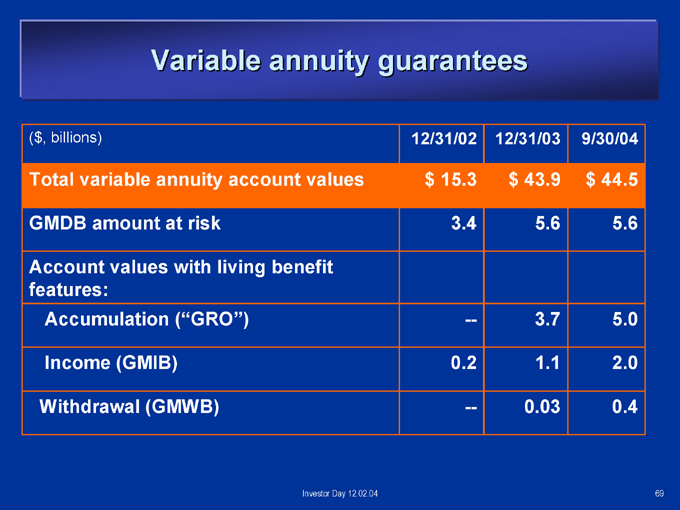
Variable annuity guarantees
($, billions) 12/31/02 12/31/03 9/30/04
Total variable annuity account values $ 15.3 $ 43.9 $ 44.5
GMDB amount at risk 3.4 5.6 5.6
Account values with living benefit
features:
Accumulation (“GRO”) — 3.7 5.0
Income (GMIB) 0.2 1.1 2.0
Withdrawal (GMWB) — 0.03 0.4
Investor Day 12.02.04 69
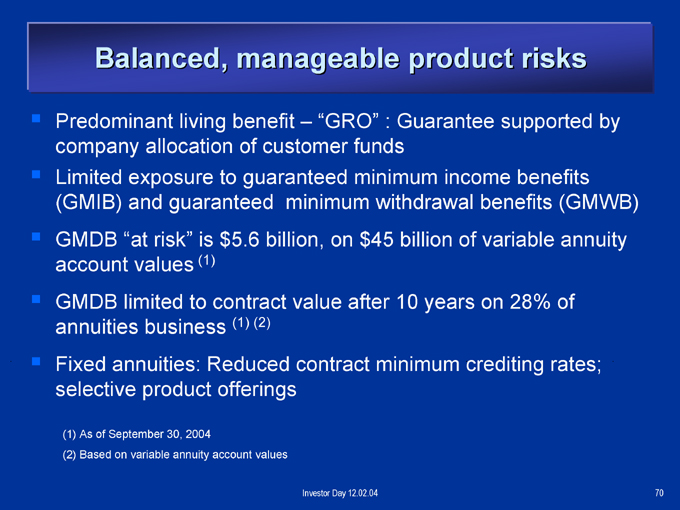
Balanced, manageable product risks
Predominant living benefit – “GRO” : Guarantee supported by company allocation of customer funds
Limited exposure to guaranteed minimum income benefits (GMIB) and guaranteed minimum withdrawal benefits (GMWB)
GMDB “at risk” is $5.6 billion, on $45 billion of variable annuity account values (1) GMDB limited to contract value after 10 years on 28% of annuities business (1) (2)
Fixed annuities: Reduced contract minimum crediting rates; selective product offerings
(1) As of September 30, 2004
(2) Based on variable annuity account values
Investor Day 12.02.04
70
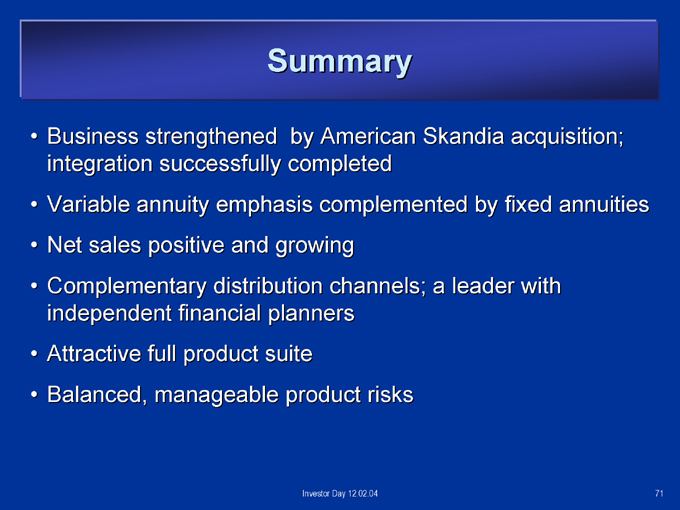
Summary
Business strengthened by American Skandia acquisition; integration successfully completed Variable annuity emphasis complemented by fixed annuities Net sales positive and growing Complementary distribution channels; a leader with independent financial planners Attractive full product suite Balanced, manageable product risks
Investor Day 12.02.04
71

Investor Day
December 2, 2004
Investor Day 12.02.04
72

International Division
Rodger Lawson
Vice Chairman, International Insurance and Investments Division
Investor Day 12.02.04
73
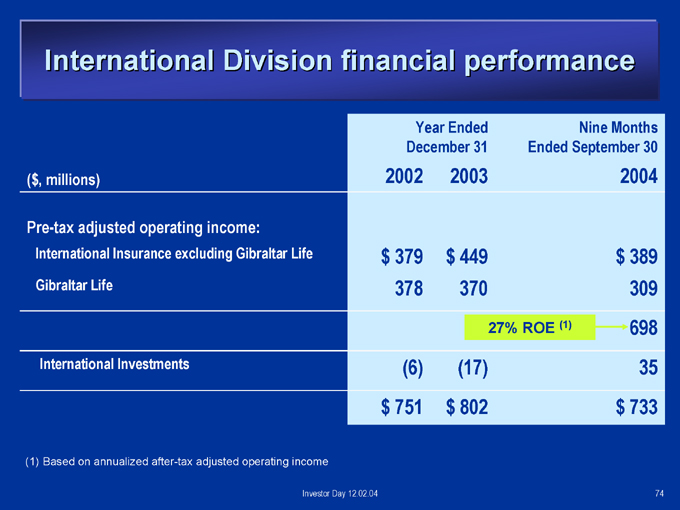
International Division financial performance
Year Ended Nine Months
December 31 Ended September 30
$, millions) 2002 2003 2004
Pre-tax adjusted operating income:
International Insurance excluding Gibraltar Life $ 379 $ 449 $ 389
Gibraltar Life 378 370 309
27% ROE (1) 698
International Investments (6) (17) 35
$ 751 $ 802 $ 733
(1) Based on annualized after-tax adjusted operating income
Investor Day 12.02.04 74
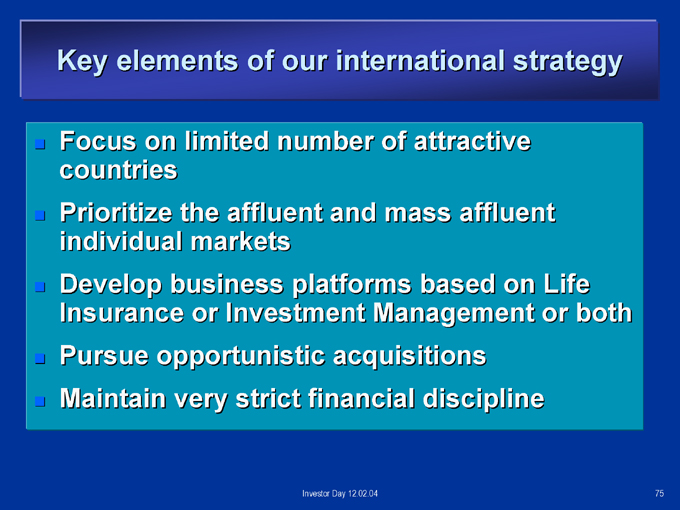
Key elements of our international strategy
Focus on limited number of attractive countries Prioritize the affluent and mass affluent individual markets Develop business platforms based on Life Insurance or Investment Management or both Pursue opportunistic acquisitions Maintain very strict financial discipline
Investor Day 12.02.04
75

Life Planning insurance
Value Proposition – Life Planners
– A highly trained, professional field force focused on providing life insurance plans tailored to the specific needs of each individual client
Competitive Advantage
– Client focus
– Needs based selling
– Industry leadership service capability
Product Strategy
– Focuses on protection life insurance in a predominantly standardized product environment
Investor Day 12.02.04 76
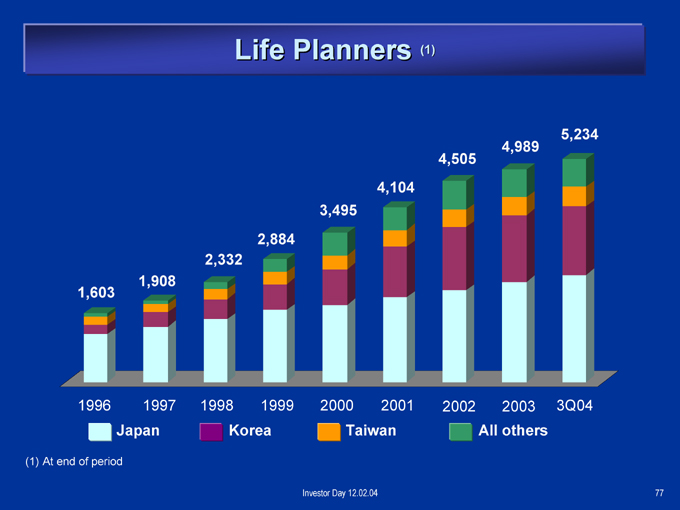
Life Planners (1)
5,234 4,989 4,505 4,104 3,495 2,884 2,332 1,908 1,603
1996 1997 1998 1999 2000 2001 2002 2003 3Q04
Japan Korea Taiwan All others
(1) At end of period
Investor Day 12.02.04 77
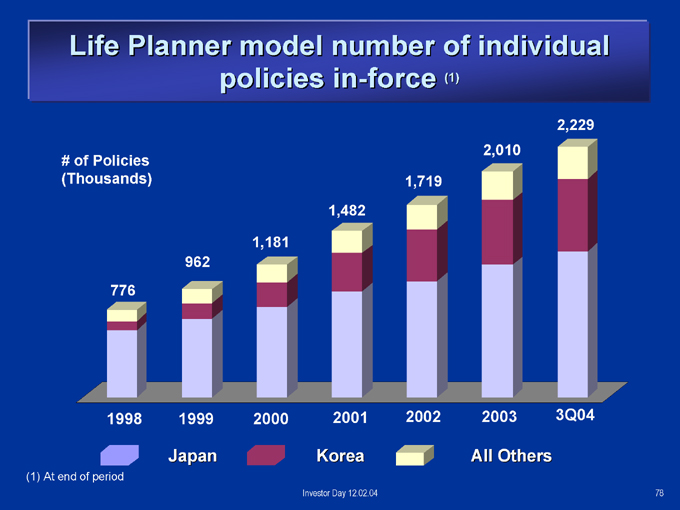
Life Planner model number of individual policies in-force (1)
2,229 2,010 # of Policies (Thousands) 1,719 1,482
1,181 962 776
1998 1999 2000 2001 2002 2003 3Q04
Japan Korea All Others
(1) At end of period
Investor Day 12.02.04 78

Life Planner productivity (1)
Japan
Korea
8.5
4.6
12 8 4 0
7.0 2.2
Prudential of Japan Top 5
Prudential of Korea Top 3
(1) Policies per Life Planner per month, based on new business, for the twelve months ended March 31, 2004. Industry data include medical riders; Prudential data do not. Industry data based on company information and Prudential calculations.
Investor Day 12.02.04
79

Life Planner retention and policy persistency
Life Planner model 2000 2001 2002 2003 3Q04
12-month Retention 75% 66% 72% 75% 74%
24-month Retention 65% 61% 55% 57% 58%
13-month policy
94% 93% 93% 93% 93%
persistency(1)
25-month policy
88% 88% 86% 87% 86%
persistency(1)
Renewal policy
95% 94% 95% 94% 94%
persistency(1)
(1) Persistency is reported on a face amount basis
Investor Day 12.02.04
80
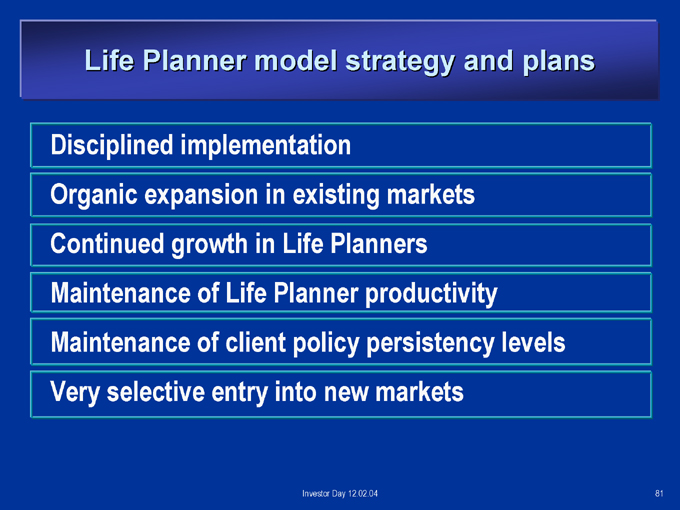
Life Planner model strategy and plans
Disciplined implementation
Organic expansion in existing markets Continued growth in Life Planners Maintenance of Life Planner productivity Maintenance of client policy persistency levels Very selective entry into new markets
Investor Day 12.02.04 81
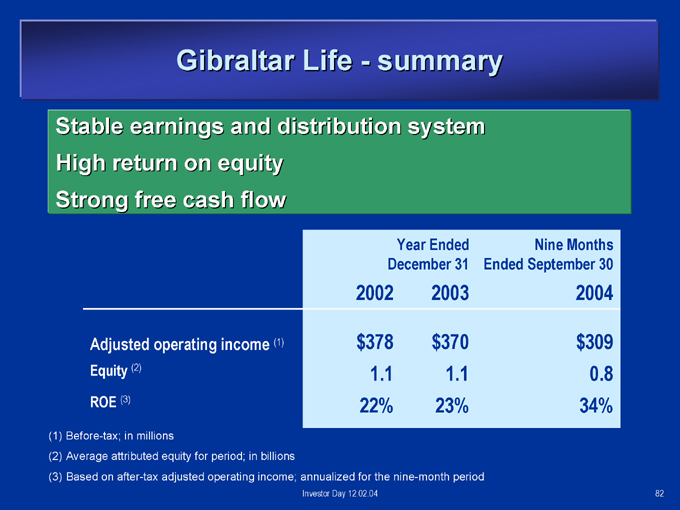
Gibraltar Life—summary
Stable earnings and distribution system High return on equity Strong free cash flow
Year Ended Nine Months
December 31 Ended September 30
2002 2003 2004
Adjusted operating income (1) $378 $370 $309
Equity (2) 1.1 1.1 0.8
ROE (3) 22% 23% 34%
(1) Before-tax; in millions
(2) Average attributed equity for period; in billions
(3) Based on after-tax adjusted operating income; annualized for the nine-month period
Investor Day 12.02.04 82
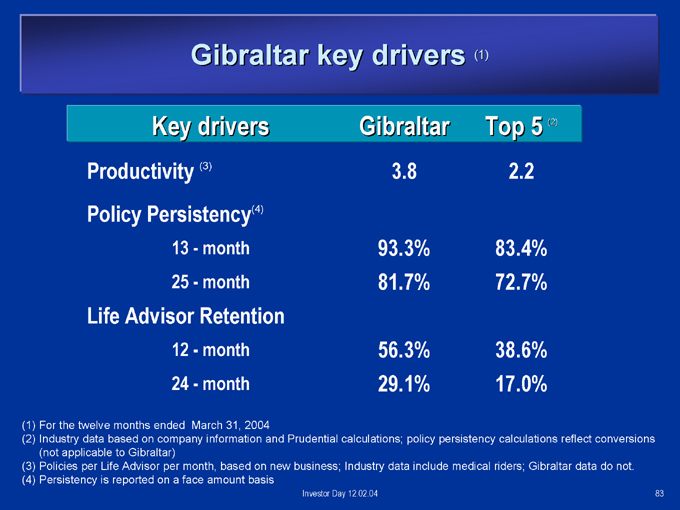
Gibraltar key drivers (1)
Key drivers Gibraltar Top 5 (2)
Productivity (3) 3.8 2.2
Policy Persistency(4)
13—month 93.3% 83.4%
25—month 81.7% 72.7%
Life Advisor Retention
12—month 56.3% 38.6%
24—month 29.1% 17.0%
(1) For the twelve months ended March 31, 2004
(2) Industry data based on company information and Prudential calculations; policy persistency calculations reflect conversions (not applicable to Gibraltar) (3) Policies per Life Advisor per month, based on new business; Industry data include medical riders; Gibraltar data do not. (4) Persistency is reported on a face amount basis
Investor Day 12.02.04 83
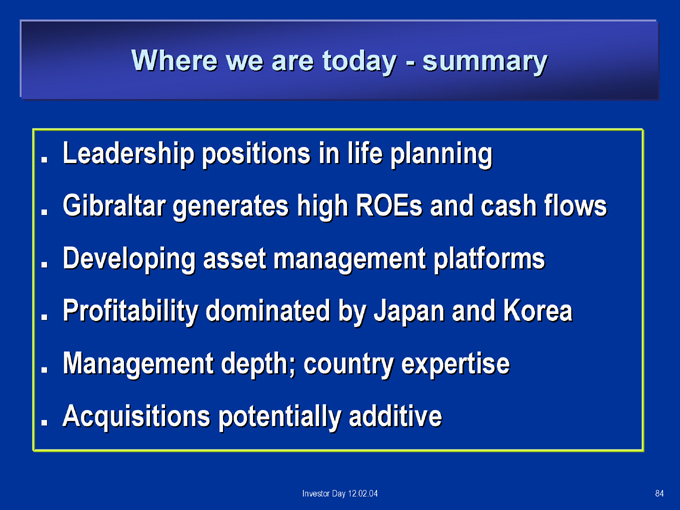
Where we are today—summary
Leadership positions in life planning
Gibraltar generates high ROEs and cash flows Developing asset management platforms Profitability dominated by Japan and Korea Management depth; country expertise Acquisitions potentially additive
Investor Day 12.02.04
84

Investor Day
December 2, 2004
Investor Day 12.02.04
85

International Insurance Finance
John Hanrahan
Chief Financial Officer, International Insurance
Investor Day 12.02.04
86
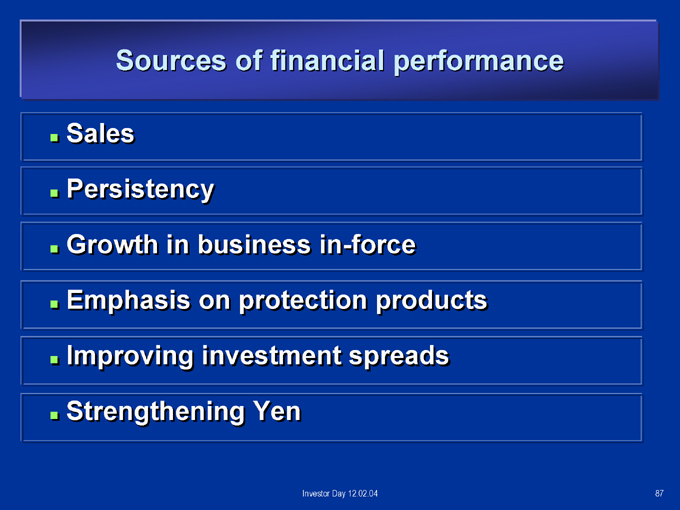
Sources of financial performance
Sales
Persistency
Growth in business in-force Emphasis on protection products Improving investment spreads Strengthening Yen
Investor Day 12.02.04 87
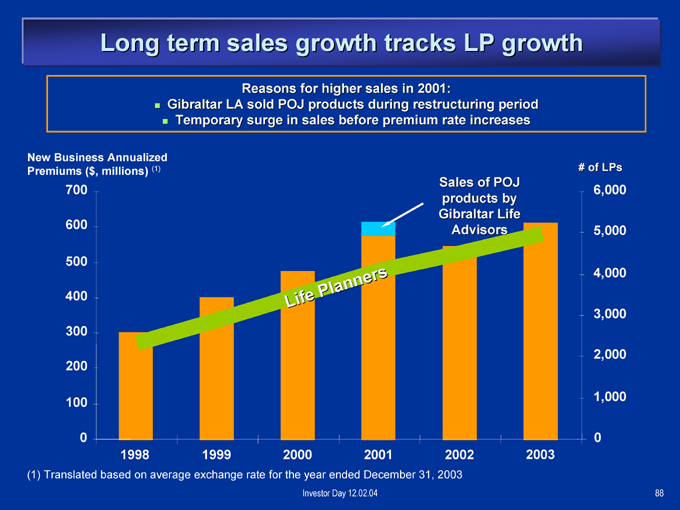
Long term sales growth tracks LP growth
Reasons for higher sales in 2001:
Gibraltar LA sold POJ products during restructuring period
Temporary surge in sales before premium rate increases
New Business Annualized Premiums ($, millions) (1)
700
600
500 400 300 200
100
0
L i f e
P l a n n e r s
Sales of POJ products by Gibraltar Life Advisors
1998 1999 2000 2001 2002 2003
# of LPs
6,000 5,000 4,000 3,000 2,000 1,000 0
(1) Translated based on average exchange rate for the year ended December 31, 2003
Investor Day 12.02.04
88
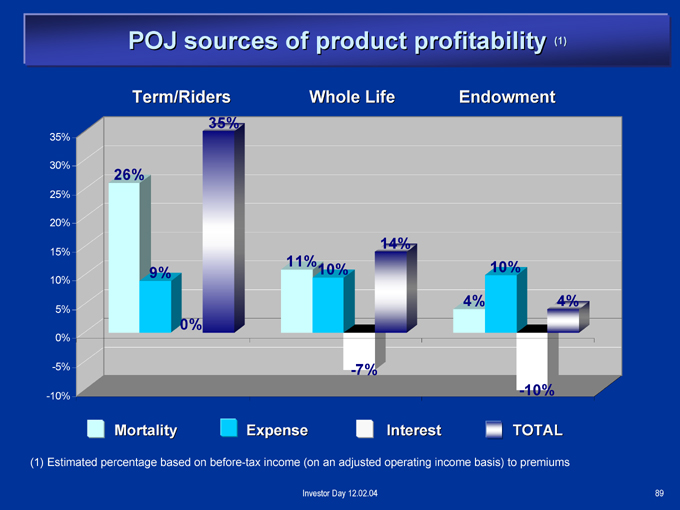
POJ sources of product profitability (1)
Term/Riders Whole Life Endowment
35%
30%
25%
20%
15%
10%
5%
0%
-5%
-10%
35%
26%
9%
0%
11%10%
14%
4%
10%
4%
-7%
-10%
Mortality
Expense
Interest
TOTAL
(1) Estimated percentage based on before-tax income (on an adjusted operating income basis) to premiums
Investor Day 12.02.04
89
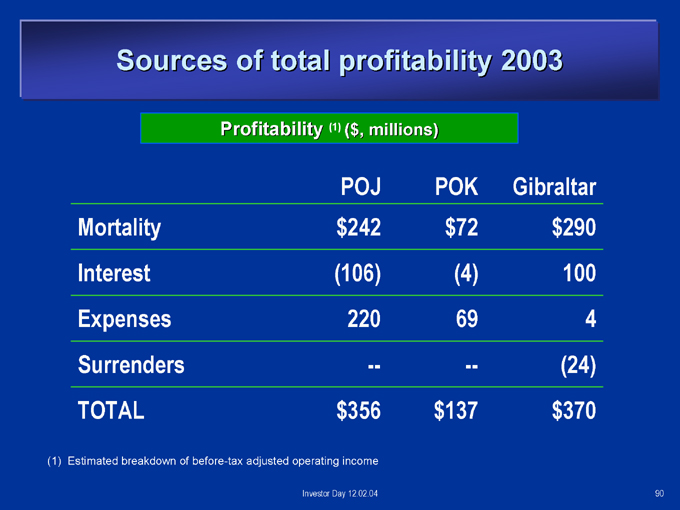
Sources of total profitability 2003
Profitability (1) ($, millions)
POJ POK Gibraltar
Mortality $ 242 $ 72 $ 290
Interest (106) (4) 100
Expenses 220 69 4
Surrenders — — (24)
TOTAL $ 356 $ 137 $ 370
(1) Estimated breakdown of before-tax adjusted operating income
Investor Day 12.02.04
90
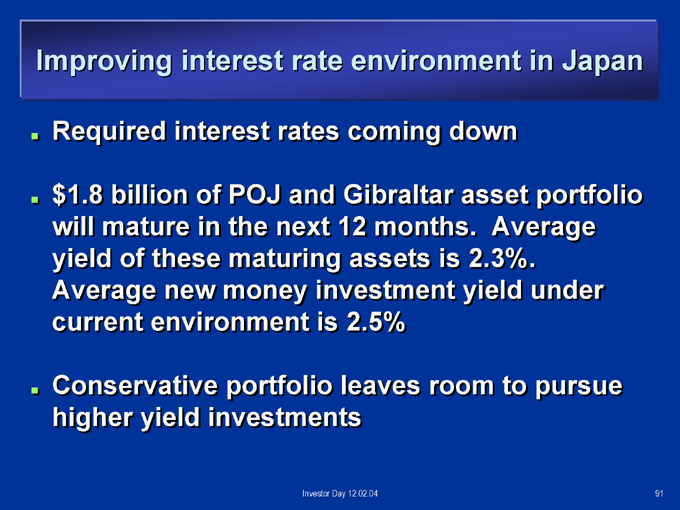
Improving interest rate environment in Japan
Required interest rates coming down
$1.8 billion of POJ and Gibraltar asset portfolio will mature in the next 12 months. Average yield of these maturing assets is 2.3%. Average new money investment yield under current environment is 2.5%
Conservative portfolio leaves room to pursue higher yield investments
Investor Day 12.02.04
91
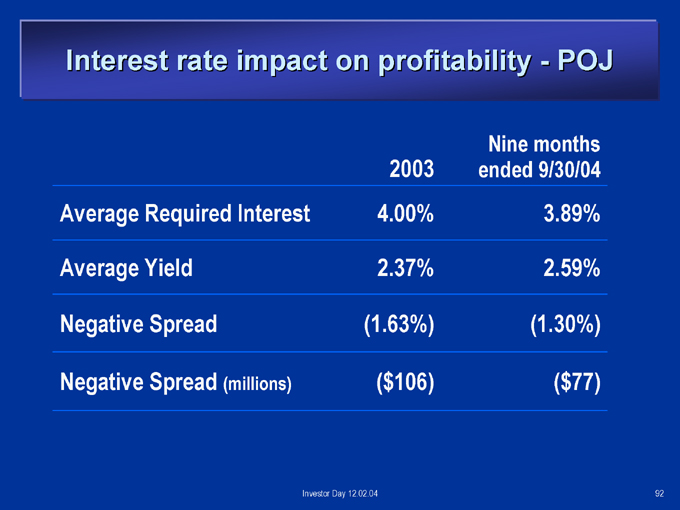
Interest rate impact on profitability—POJ
Nine months
2003 ended 9/30/04
Average Required Interest 4.00% 3.89%
Average Yield 2.37% 2.59%
Negative Spread (1.63%) (1.30%)
Negative Spread (millions) ($106) ($77)
Investor Day 12.02.04
92
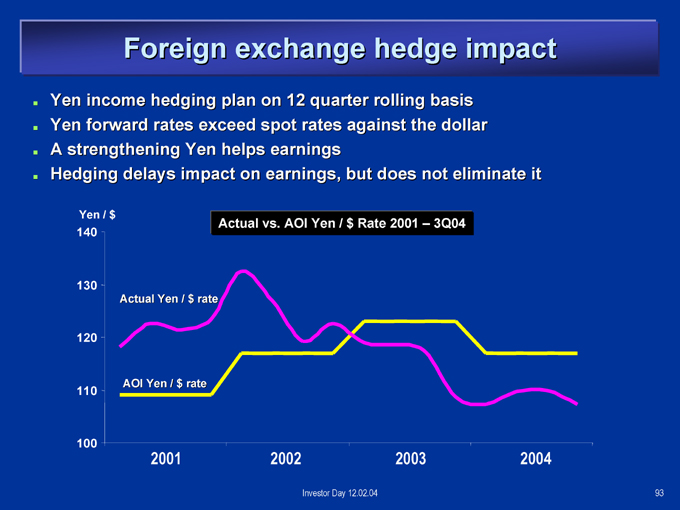
Foreign exchange hedge impact
Yen income hedging plan on 12 quarter rolling basis Yen forward rates exceed spot rates against the dollar A strengthening Yen helps earnings Hedging delays impact on earnings, but does not eliminate it
Yen / $
Actual vs. AOI Yen / $ Rate 2001 – 3Q04
140
130
Actual Yen / $ rate
120
AOI Yen / $ rate
110
100
2001 2002 2003 2004
Investor Day 12.02.04
93
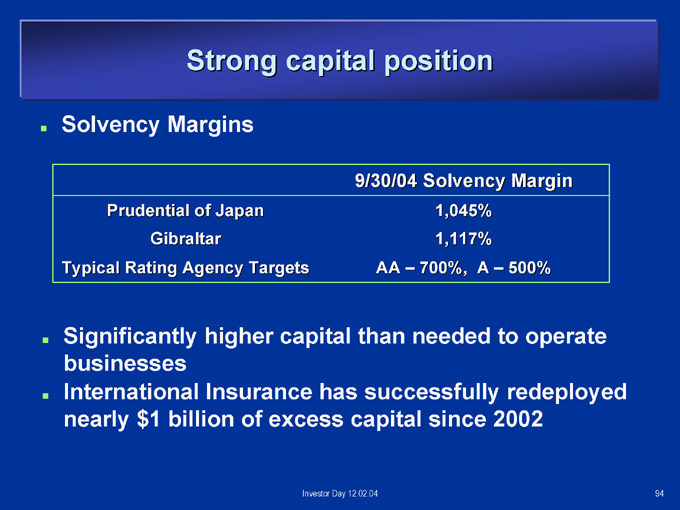
Strong capital position
Solvency Margins
9/30/04 Solvency Margin
Prudential of Japan Gibraltar Typical Rating Agency Targets
1,045% 1,117% AA – 700%, A – 500%
Significantly higher capital than needed to operate businesses International Insurance has successfully redeployed nearly $1 billion of excess capital since 2002
Investor Day 12.02.04
94
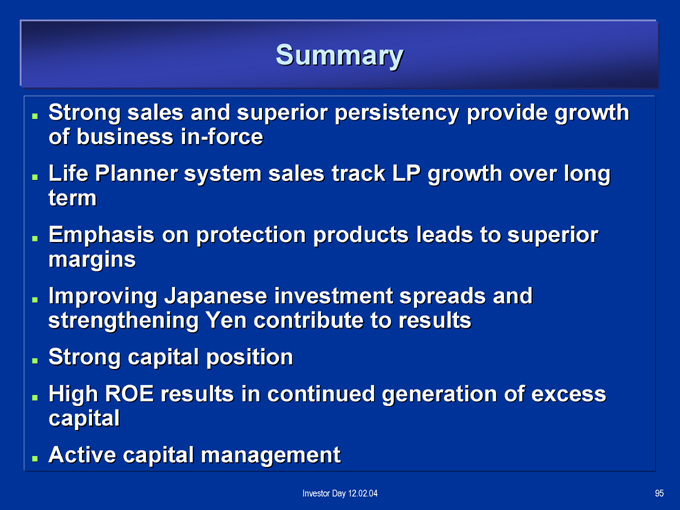
Summary
Strong sales and superior persistency provide growth of business in-force Life Planner system sales track LP growth over long term Emphasis on protection products leads to superior margins Improving Japanese investment spreads and strengthening Yen contribute to results Strong capital position High ROE results in continued generation of excess capital Active capital management
Investor Day 12.02.04
95

Investor Day
December 2, 2004
Investor Day 12.02.04 96

Financial Outlook
Richard J. Carbone
Chief Financial Officer
Investor Day 12.02.04
97
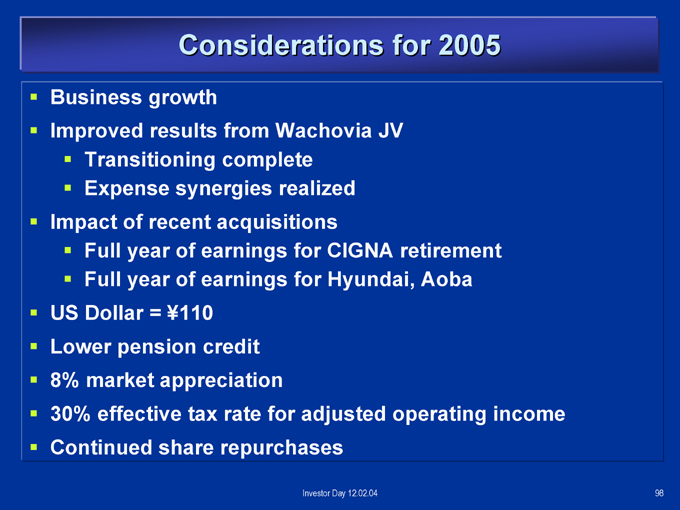
Considerations for 2005
Business growth
Improved results from Wachovia JV
Transitioning complete Expense synergies realized
Impact of recent acquisitions
Full year of earnings for CIGNA retirement Full year of earnings for Hyundai, Aoba
US Dollar = ¥110 Lower pension credit 8% market appreciation
30% effective tax rate for adjusted operating income Continued share repurchases
Investor Day 12.02.04
98
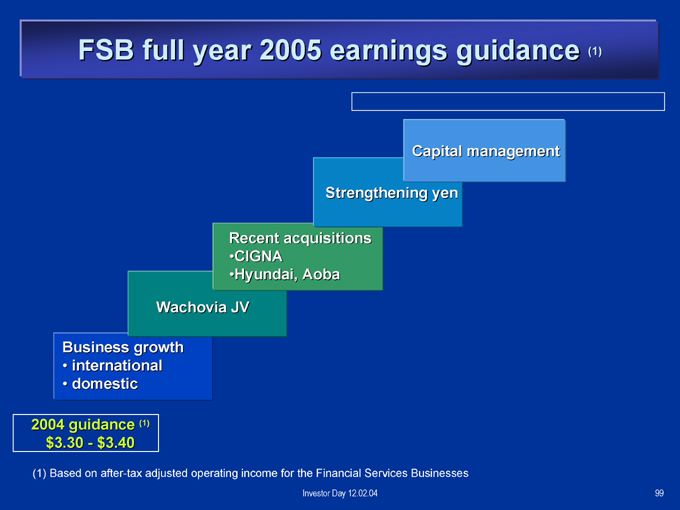
FSB full year 2005 earnings guidance (1)
Capital management
Strengthening yen
Recent acquisitions CIGNA
Hyundai, Aoba
Wachovia JV
Business growth • international • domestic
2004 guidance (1) $3.30—$3.40
(1) Based on after-tax adjusted operating income for the Financial Services Businesses
Investor Day 12.02.04 99

Investor Day
December 2, 2004
Investor Day 12.02.04
100

Closing Comments
Art Ryan
Chairman and CEO
Investor Day 12.02.04 101

Investor Day
December 2, 2004
Investor Day 12.02.04 102