SLIDE PRESENTATION OF PRUDENTIAL FINANCIAL, INC. IN TOKYO ON SEPT. 14, 2006.
Published on
Exhibit 99.0
Tokyo Investor Day
September 14, 2006 Tokyo, Japan
Forward-Looking Statements
Certain of the statements included in this presentation constitute forward-looking statements within the meaning of the U.S. Private Securities Litigation Reform Act of 1995. It is possible that actual results may differ materially from any expectations or predictions expressed in this presentation. Words such as “expects,” “believes,” “anticipates,” “includes,” “plans,” “assumes,” “estimates,” “projects,” “intends,” “should,” “will,” “shall,” or variations of such words are generally part of forward-looking statements. Forward-looking statements are made based on management’s current expectations and beliefs concerning future developments and their potential effects upon Prudential Financial, Inc. and its subsidiaries. There can be no assurance that future developments affecting Prudential Financial, Inc. and its subsidiaries will be those anticipated by management. These forward-looking statements are not a guarantee of future performance and involve risks and uncertainties, and there are certain important factors that could cause actual results to differ, possibly materially, from expectations or estimates reflected in such forward-looking statements, including, among others: (1) general economic, market and political conditions, including the performance and fluctuations of stock, real estate, and other financial markets; (2) interest rate fluctuations; (3) reestimates of our reserves for future policy benefits and claims; (4) differences between actual experience regarding mortality, morbidity, persistency, surrender experience, interest rates or market returns and the assumptions we use in pricing our products, establishing liabilities and reserves or for other purposes; (5) changes in our assumptions related to deferred policy acquisition costs, valuation of business acquired or goodwill; (6) changes in our claims-paying or credit ratings; (7) investment losses and defaults; (8) competition in our product lines and for personnel; (9) changes in tax law; (10) economic, political, currency and other risks relating to our international operations; (11) fluctuations in foreign currency exchange rates and foreign securities markets; (12) regulatory or legislative changes; (13) adverse determinations in litigation or regulatory matters and our exposure to contingent liabilities, including in connection with our divestiture or winding down of businesses; (14) domestic or international military actions, natural or man-made disasters including terrorist activities or pandemic disease, or other events resulting in catastrophic loss of life; (15) ineffectiveness of risk management policies and procedures in identifying, monitoring and managing risks; (16) effects of acquisitions, divestitures and restructurings, including possible difficulties in integrating and realizing the projected results of acquisitions; (17) changes in statutory or U.S. GAAP accounting principles, practices or policies; (18) changes in assumptions for retirement expense; (19) Prudential Financial, Inc.’s primary reliance, as a holding company, on dividends or distributions from its subsidiaries to meet debt payment obligations and continue share repurchases, and the applicable regulatory restrictions on the ability of the subsidiaries to pay such dividends or distributions; and (20) risks due to the lack of legal separation between our Financial Services Businesses and our Closed Block Business. Prudential Financial, Inc. does not intend, and is under no obligation, to update any particular forward-looking statement included in this presentation. The information referred to above, as well as the risks of our businesses described in our Annual Report on Form 10-K for the year ended December 31, 2005, should be considered by readers when reviewing forward-looking statements contained in this presentation.
Prudential Financial, Inc. of the United States is not affiliated with Prudential PLC which is headquartered in the United Kingdom.
Tokyo Investor Day 9.14.06
| 1 |
|
Non-GAAP Measure
This presentation includes references to “adjusted operating income”, and return on equity, or ROE. ROE is determined by dividing after-tax adjusted operating income by average attributed equity excluding unrealized gains and losses on investments. Adjusted operating income is a non-GAAP measure of performance of our Financial Services Businesses. Adjusted operating income excludes “Realized investment gains (losses), net,” as adjusted, and related charges and adjustments. A significant element of realized losses is impairments and losses from sales of credit-impaired securities, the timing of which depends largely on market credit cycles and can vary considerably across periods. The timing of other sales that would result in gains or losses is largely subject to our discretion and influenced by market opportunities. Realized investment gains (losses) representing profit or loss of certain of our businesses which primarily originate investments for sale or syndication to unrelated investors, and those associated with terminating hedges of foreign currency earnings and current period yield adjustments are included in adjusted operating income. Adjusted operating income also excludes investment gains and losses on trading account assets supporting insurance liabilities and changes in experience-rated contractholder liabilities due to asset value changes, because these recorded changes in asset and liability values will ultimately accrue to contractholders. Trends in the underlying profitability of our businesses can be more clearly identified without the fluctuating effects of these transactions. In addition, adjusted operating income excludes the results of divested businesses, which are not relevant to our ongoing operations. Discontinued operations, which is presented as a separate component of net income under GAAP, is also excluded from adjusted operating income. We believe that the presentation of adjusted operating income as we measure it for management purposes enhances understanding of the results of operations of the Financial Services Businesses by highlighting the results from ongoing operations and the underlying profitability of our businesses. However, adjusted operating income is not a substitute for income determined in accordance with GAAP, and the excluded items are important to an understanding of our overall results of operations. The comparable GAAP presentation and the reconciliation between the two are set out on the following page. Additional information regarding adjusted operating income can be found in our Form 10-K and Form 10-Q SEC filings, and in our earnings press releases and Quarterly Financial Supplements, which can be found on our Web site at www.investor.prudential.com.
Tokyo Investor Day 9.14.06
| 2 |
|
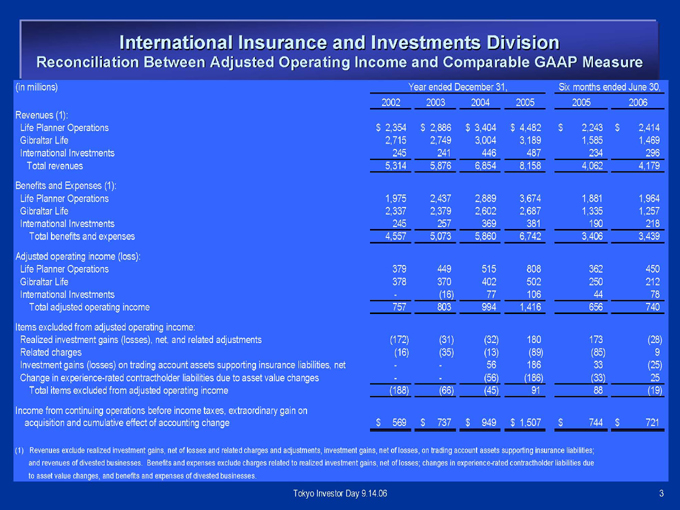
International Insurance and Investments DivisionReconciliation Between Adjusted Operating Income and Comparable GAAP MeasureOperating
(in millions)
Year ended December 31, Six months ended June 30,
20022003 2004 2005 2005 2006 Revenues (1): Life Planner Operations$ 2,354 $ 2,886 $ 3,404 $ 4,482 $ 2,243 $ 2,414 Gibraltar Life2,715 2,749 3,004 3,189 1,585 1,469 InternationalInvestments 245 241 446 487 234 296 Total revenues5,314 5,876 6,854 8,158 4,062 4,179 Benefits and Expenses(1): Life Planner Operations 1,975 2,437 2,889 3,674 1,8811,964 Gibraltar Life 2,337 2,379 2,602 2,687 1,335 1,257International Investments 245 257 369 381 190 218 Totalbenefits and expenses 4,557 5,073 5,860 6,742 3,4063,439 Adjusted operating income (loss): Life Planner Operations 379 449515 808 362 450 Gibraltar Life 378 370 402 502250 212 International Investments - (16) 77 106 4478 Total adjusted operating income 757 803 994 1,416 656740 Items excluded from adjusted operating income: Realized investment gains(losses), net, and related adjustments (172) (31) (32) 180173 (28) Related charges (16) (35) (13) (89) (85) 9Investment gains (losses) on trading account assets supporting insuranceliabilities, net - - 56 186 33 (25) Change inexperience-rated contractholder liabilities due to asset value changes -- (56) (186) (33) 25 Total items excluded from adjustedoperating income (188) (66) (45) 91 88 (19) Income fromcontinuing operations before income taxes, extraordinary gain on acquisition andcumulative effect of accounting change $ 569 $ 737 $ 949 $ 1,507 $744 $ 721(1) Revenues exclude realized investment gains, net of losses and relatedcharges and adjustments, investment gains, net of losses, on trading accountassets supporting insurance liabilities; and revenues of divested businesses.Benefits and expenses exclude charges related to realized investment gains, netof losses; changes in experience-rated contractholder liabilities due to assetvalue changes, and benefits and expenses of divested businesses.
Tokyo Investor Day 9.14.06
3
Tokyo Investor Day
Rodger Lawson
Vice Chairman
International Insurance and Investments Division
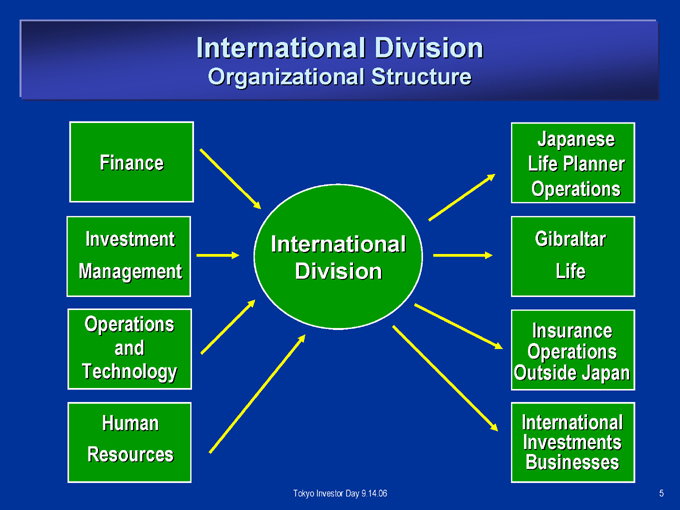
International Division
Organizational Structure
Finance
Investment Management
Operations and Technology
Human Resources
International Division
Japanese Life Planner Operations
Gibraltar Life
Insurance Operations Outside Japan
International Investments Businesses
Tokyo Investor Day 9.14.06
| 5 |
|
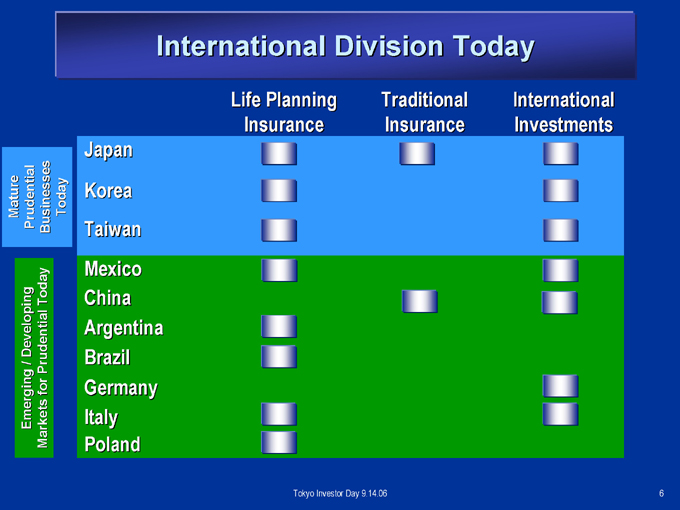
International Division Today
Mature Prudential Businesses Today
Emerging / Developing Markets for Prudential Today
Life Planning Insurance
Traditional Insurance
International Investments
Japan Korea Taiwan Mexico China Argentina Brazil Germany Italy Poland
Tokyo Investor Day 9.14.06
| 6 |
|
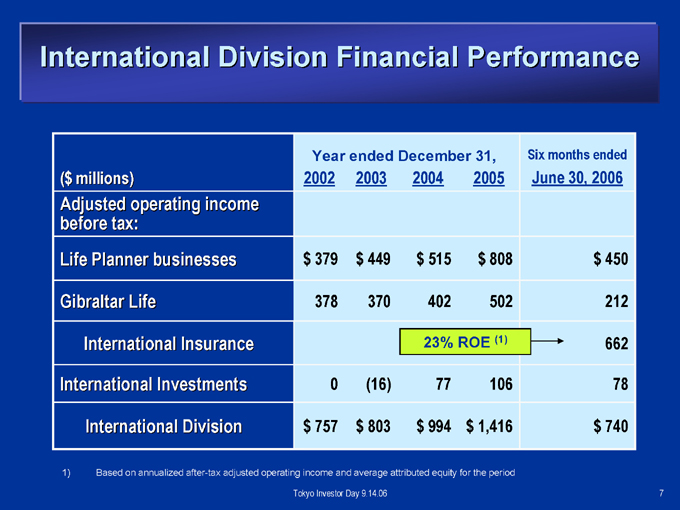
International Division Financial Performance
| Year |
|
ended December 31, Six months ended June 30, 2006 |
| 2002 |
|
2005 ($ millions) 2003 2004 |
| Adjusted |
|
operating income before tax: |
| Life |
|
Planner businesses $379 $449 $515 $808 $450 |
| Gibraltar |
|
Life 378 370 402 502 212 |
| International |
|
Insurance 23% ROE (1) 662 |
| International |
|
Investments 0 (16) 77 106 78 |
| International |
|
Division $757 $803 $994 $1,416 $740 |
1) Based on annualized after-tax adjusted operating income and average attributed equity for the period
Tokyo Investor Day 9.14.06
| 7 |
|
Our Division Goals
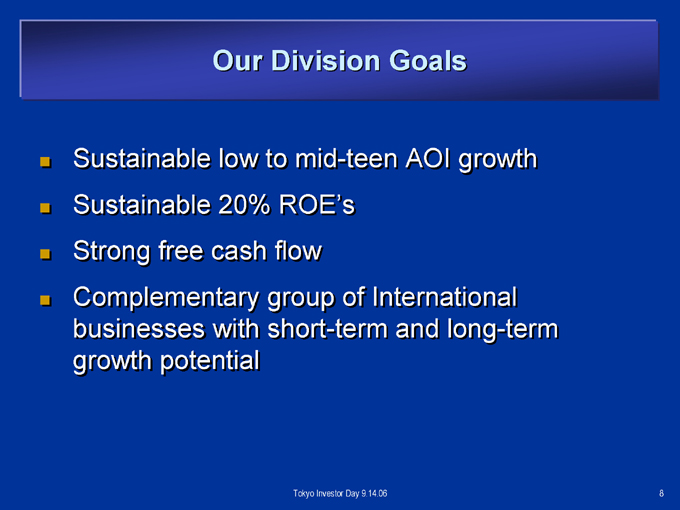
Sustainable low to mid-teen AOI growth Sustainable 20% ROE’s Strong free cash flow Complementary group of International businesses with short-term and long-term growth potential
Tokyo Investor Day 9.14.06
| 8 |
|
Key Elements of Our International Strategy
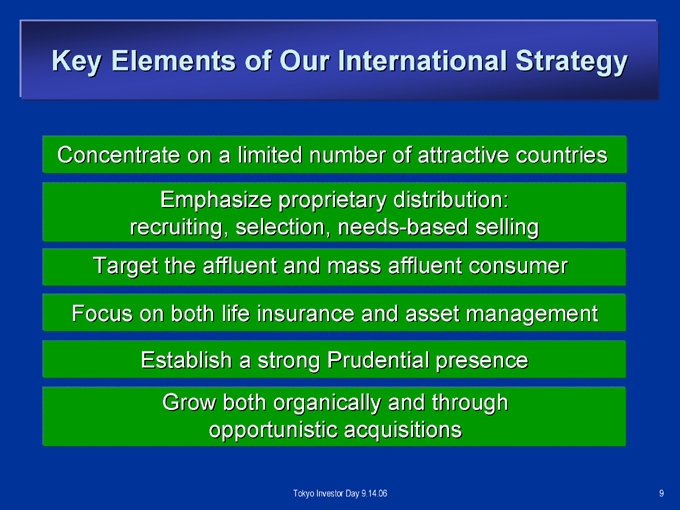
Concentrate on a limited number of attractive countries Emphasize proprietary distribution: recruiting, selection, needs-based selling Target the affluent and mass affluent consumer
Focus on both life insurance and asset management
Establish a strong Prudential presence Grow both organically and through opportunistic acquisitions
Tokyo Investor Day 9.14.06
9

Life Planning Insurance
Distribution: Competitive Advantage
– Very selective recruiting
– Highly trained, professional field force
– Financial planning approach; needs-based selling
Emphasis on Protection Products
– Life insurance plans tailored to specific client needs
– U.S. dollar products and “third-sector” features complement portfolio
Compensation Aligns Customer / Agent / Company Interests
– Variable compensation structure
– Rewards productivity and persistency
Tokyo Investor Day 9.14.06
10
Business Model Needs-Based Selling
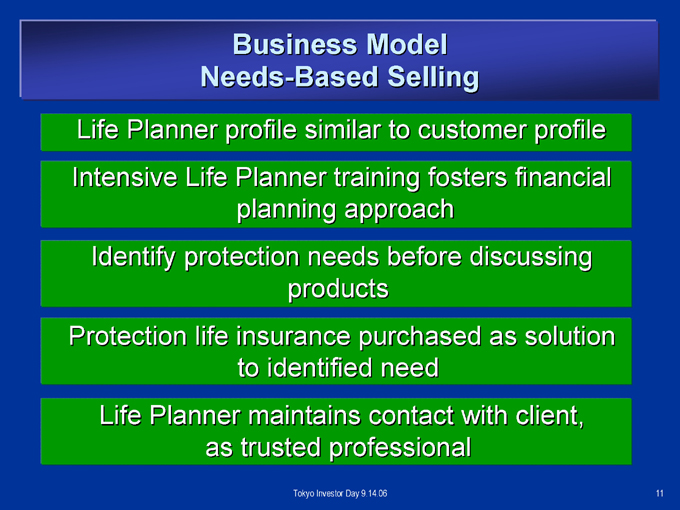
Life Planner profile similar to customer profile Intensive Life Planner training fosters financial planning approach Identify protection needs before discussing products Protection life insurance purchased as solution to identified need Life Planner maintains contact with client, as trusted professional
Tokyo Investor Day 9.14.06
11
The Beneficial Cycle
Proven Execution Track Record
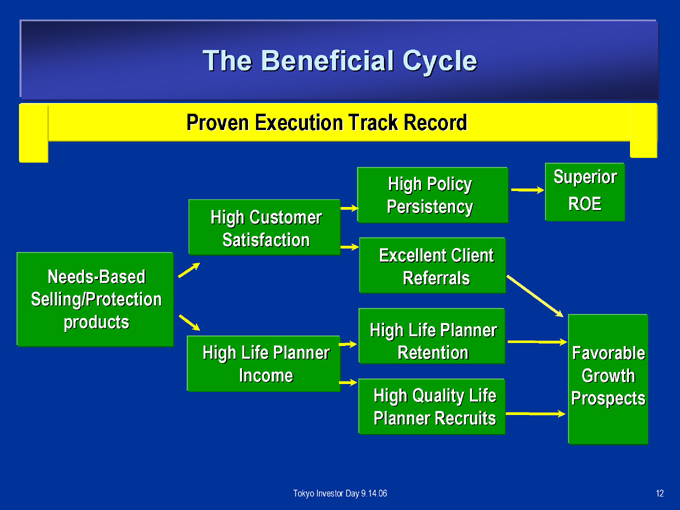
Needs-Based Selling/Protection products
High Customer Satisfaction
High Life Planner Income
High Policy Persistency
Excellent Client Referrals
High Life Planner Retention
High Quality Life Planner Recruits
Superior ROE
Favorable Growth Prospects
Tokyo Investor Day 9.14.06
12
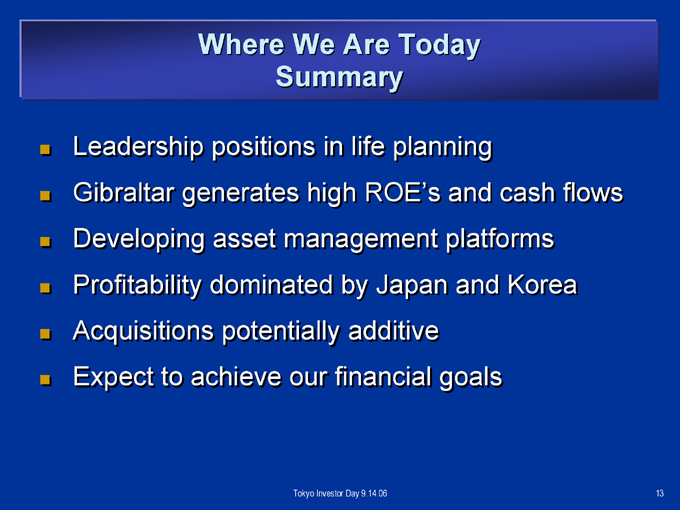
Where We Are Today Summary
Leadership positions in life planning
Gibraltar generates high ROE’s and cash flows Developing asset management platforms Profitability dominated by Japan and Korea Acquisitions potentially additive Expect to achieve our financial goals
Tokyo Investor Day 9.14.06
13

International Insurance Finance
John Hanrahan
Chief Financial Officer Prudential International Insurance
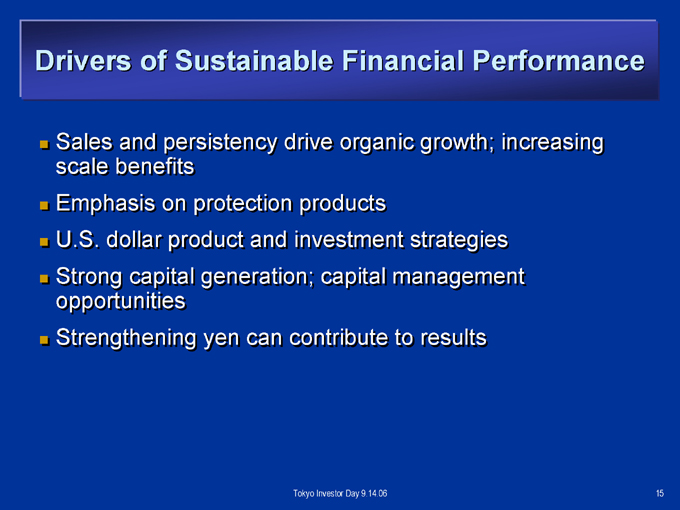
Drivers of Sustainable Financial Performance
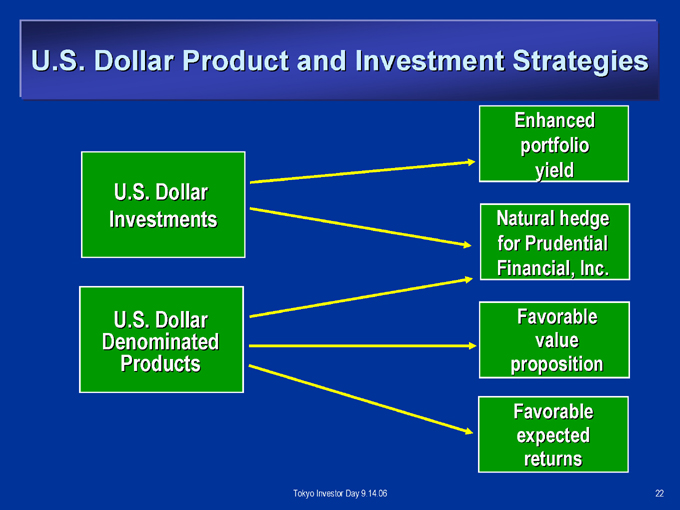
Sales and persistency drive organic growth; increasing scale benefits Emphasis on protection products U.S. dollar product and investment strategies
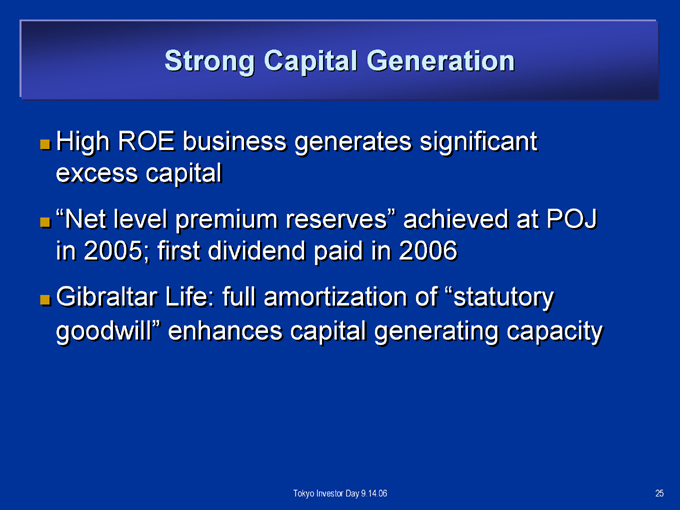
Strong capital generation; capital management opportunities Strengthening yen can contribute to results
Tokyo Investor Day 9.14.06
15
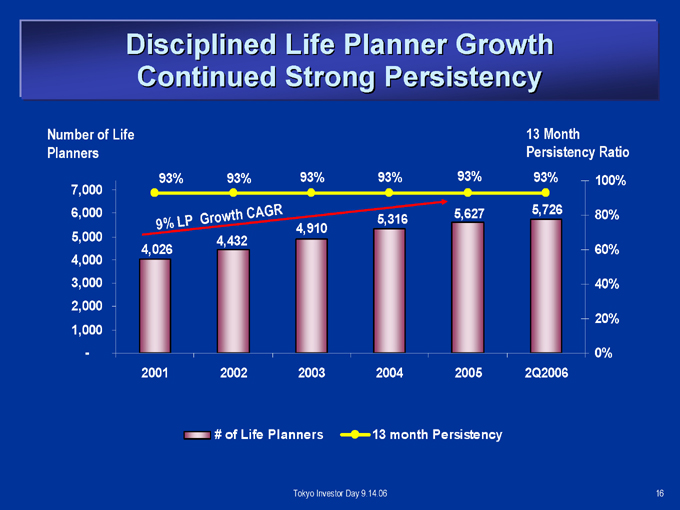
Disciplined Life Planner Growth Continued Strong Persistency
Number of Life Planners
7,000 6,000 5,000 4,000 3,000 2,000 1,000 -
2001 2002 2003 2004 2005 2Q2006
93% 93% 93% 93% 93% 93%
9% LP Growth CAGR
4,026
4,432
4,910
5,316
5,627
5,726
13 Month Persistency Ratio
100% 80% 60% 40% 20% 0%
# of Life Planners
13 month Persistency
Tokyo Investor Day 9.14.06
16
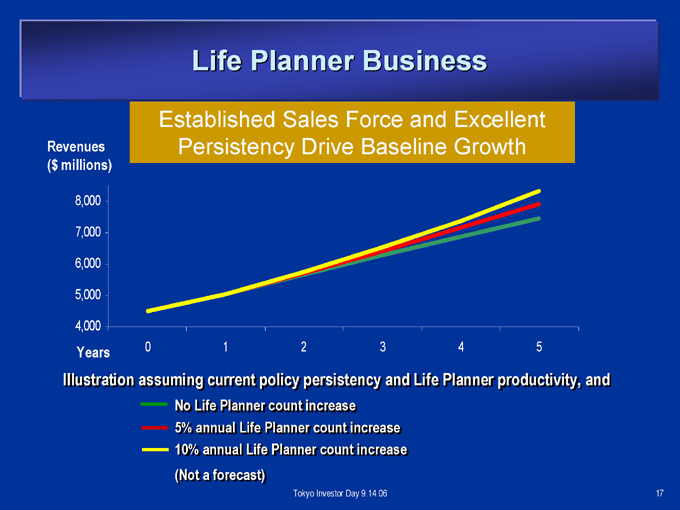
Life Planner Business
Established Sales Force and Excellent Persistency Drive Baseline Growth
Revenues ($ millions)
8,000 7,000 6,000 5,000 4,000
Years
0 1 2 3 4 5
Illustration assuming current policy persistency and Life Planner productivity, and
No Life Planner count increase 5% annual Life Planner count increase 10% annual Life Planner count increase (Not a forecast)
Tokyo Investor Day 9.14.06
17
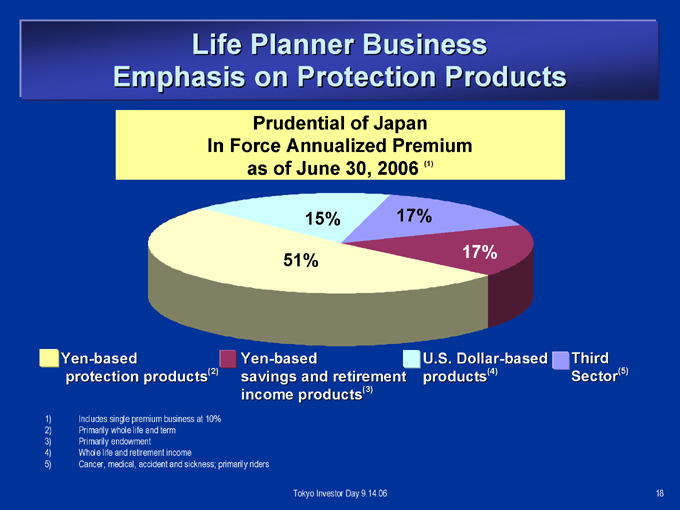
Life Planner Business Emphasis on Protection Products
Prudential of Japan In Force Annualized Premium as of June 30, 2006 (1)
15%
51%
17%
17%
Yen-based protection products(2)
Yen-based savings and retirement income products(3)
U.S. Dollar-based products(4)
Third Sector(5)
1) Includes single premium business at 10%
2) Primarily whole life and term
3) Primarily endowment
4) Whole life and retirement income
5) Cancer, medical, accident and sickness; primarily riders
Tokyo Investor Day 9.14.06
18
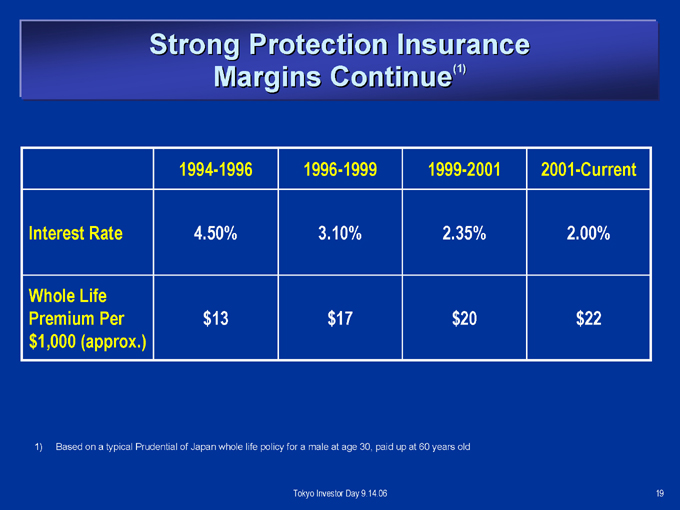
Strong Protection Insurance Margins Continue(1)
| 1994-1996 |
|
1996-1999 1999-2001 2001-Current |
| Interest |
|
Rate 4.50% 3.10% 2.35% 2.00% |
| Whole |
|
Life |
| Premium |
|
Per $13 $17 $20 $22 |
| $1,000 |
|
(approx.) |
1) Based on a typical Prudential of Japan whole life policy for a male at age 30, paid up at 60 years old
Tokyo Investor Day 9.14.06
19
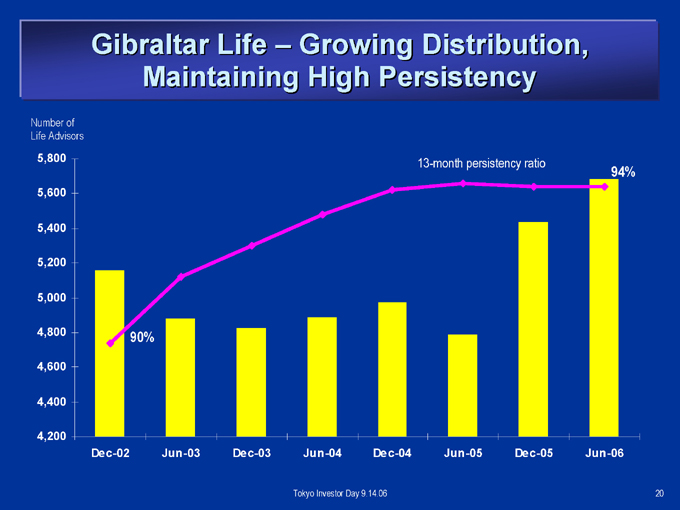
Gibraltar Life – Growing Distribution, Maintaining High Persistency
Number of Life Advisors
5,800 5,600 5,400 5,200 5,000 4,800 4,600 4,400 4,200
Dec-02 Jun-03 Dec-03 Jun-04 Dec-04 Jun-05 Dec-05 Jun-06
90%
13-month persistency ratio
94%
Tokyo Investor Day 9.14.06
20
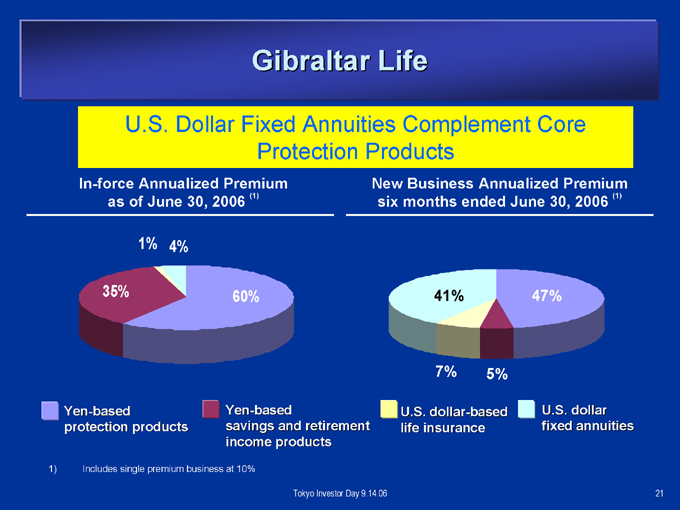
Gibraltar Life
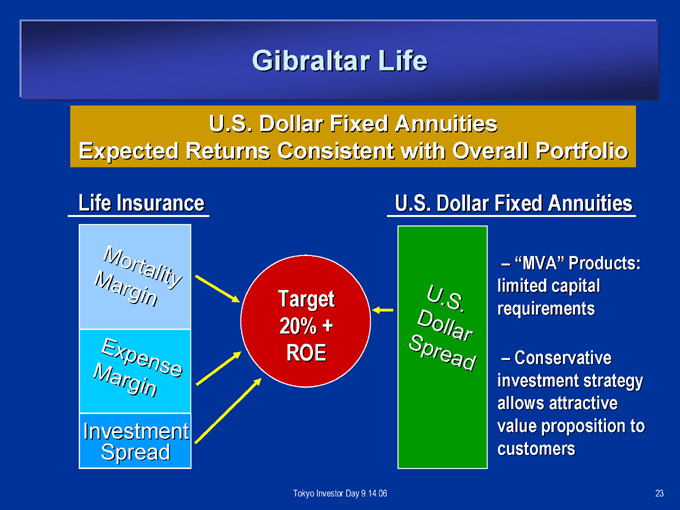
U.S. Dollar Fixed Annuities Complement Core Protection Products
In-force Annualized Premium as of June 30, 2006 (1)
1%
4%
35%
60%
Yen-based protection products
Yen-based savings and retirement income products
New Business Annualized Premium six months ended June 30, 2006 (1)
41%
47%
7%
5%
U.S. dollar-based life insurance
U.S. dollar fixed annuities
1) Includes single premium business at 10%
Tokyo Investor Day 9.14.06
21
U.S. Dollar Product and Investment Strategies
U.S. Dollar Investments
U.S. Dollar Denominated Products
Enhanced portfolio yield
Natural hedge for Prudential Financial, Inc.
Favorable value proposition
Favorable expected returns
Tokyo Investor Day 9.14.06
22
Gibraltar Life
U.S. Dollar Fixed Annuities
Expected Returns Consistent with Overall Portfolio
Life Insurance
Mortality Margin
Expense Margin
Investment Spread
Target 20% + ROE
U.S. Dollar Fixed Annuities
U.S. Dollar Spread
– “MVA” Products: limited capital requirements
– Conservative investment strategy allows attractive value proposition to customers
Tokyo Investor Day 9.14.06
23
Improving Investment Portfolio Returns(1)
Total POJ
4.00% 3.50% 3.00% 2.50% 2.00% 1.50% 1.00% 0.50% 0.00%
1Q04 2Q04 3Q04 4Q04 1Q05 2Q05 3Q05 4Q05 1Q06 2Q06
($ millions)
40 30 20 10 -(10) (20) (30) (40)
Normalized Investment Spread Amount ($millions) Normalized Yield Crediting Rate
1) Excludes US dollar reinsurance activity, Prudential’s Tokyo office building, and one-time activities Tokyo Investor Day 9.14.06
24
Strong Capital Generation
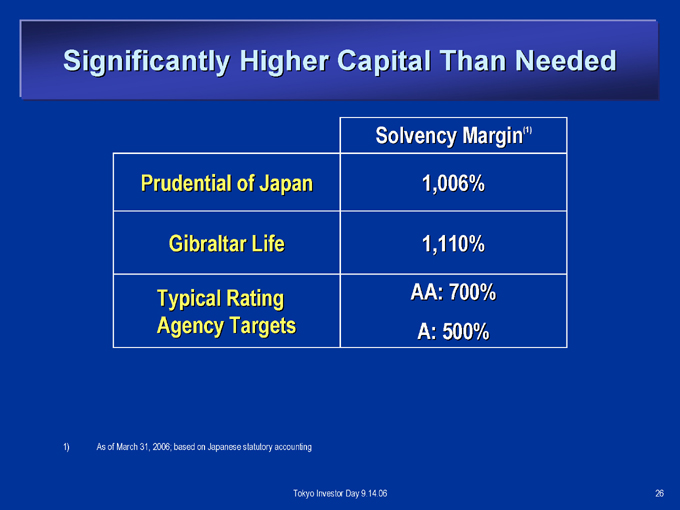
High ROE business generates significant excess capital “Net level premium reserves” achieved at POJ in 2005; first dividend paid in 2006 Gibraltar Life: full amortization of “statutory goodwill” enhances capital generating capacity
Tokyo Investor Day 9.14.06
25
Significantly Higher Capital Than Needed
Solvency Margin(1)
| Prudential |
|
of Japan 1,006% |
| Gibraltar |
|
Life 1,110% |
| Typical |
|
Rating AA: 700% |
| Agency |
|
Targets A: 500% |
1) As of March 31, 2006; based on Japanese statutory accounting
Tokyo Investor Day 9.14.06
26
Capital Management Opportunities
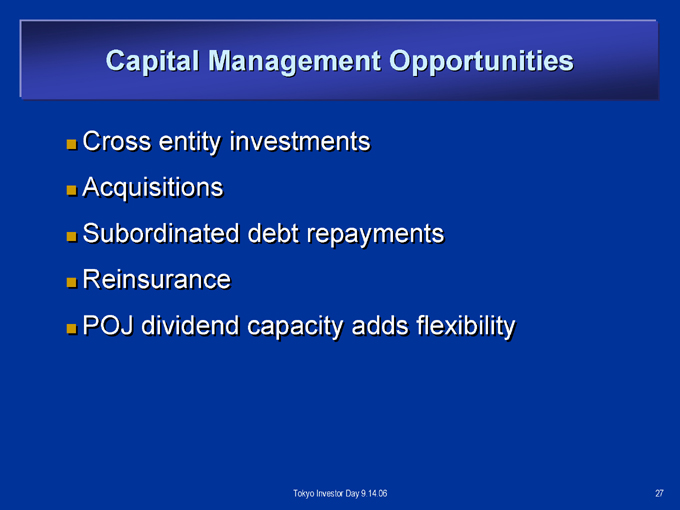
Cross entity investments Acquisitions Subordinated debt repayments Reinsurance POJ dividend capacity adds flexibility
Tokyo Investor Day 9.14.06
27
Foreign Exchange Income Hedges
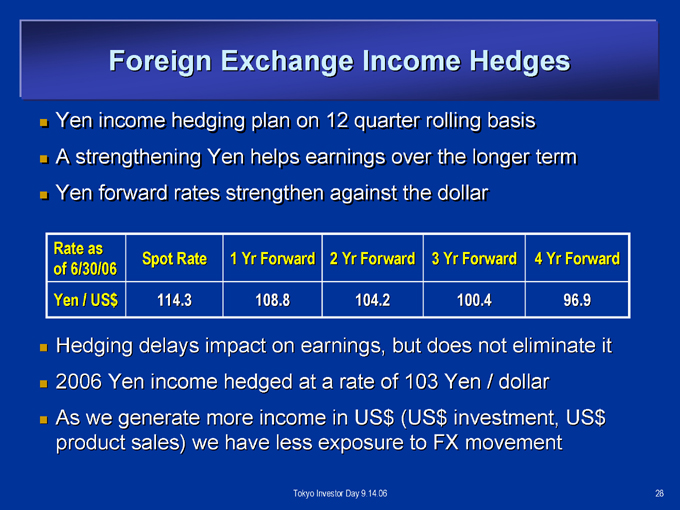
Yen income hedging plan on 12 quarter rolling basis A strengthening Yen helps earnings over the longer term Yen forward rates strengthen against the dollar
| Rate |
|
as of 6/30/06 Spot Rate 1 Yr Forward 2 Yr Forward 3 Yr Forward 4 Yr Forward |
| Yen |
|
/ US$ 114.3 108.8 104.2 100.4 96.9 |
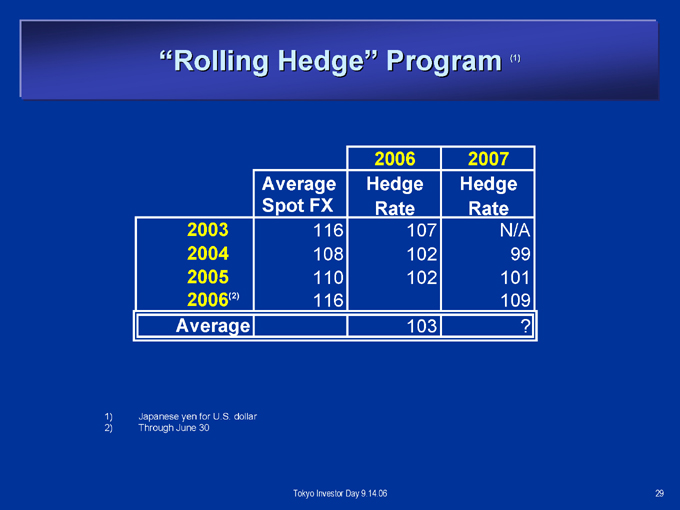
Hedging delays impact on earnings, but does not eliminate it 2006 Yen income hedged at a rate of 103 Yen / dollar As we generate more income in US$ (US$ investment, US$ product sales) we have less exposure to FX movement
Tokyo Investor Day 9.14.06
28
“Rolling Hedge” Program (1)
| Average |
|
Spot FX 2006 Hedge Rate 2007 Hedge Rate |
| 2003 |
|
116 107 N/A |
| 2004 |
|
108 102 99 |
| 2005 |
|
110 102 101 |
| 2006(2) |
|
116 109 |
| Average |
|
103 ? |
1) Japanese yen for U.S. dollar
2) Through June 30
Tokyo Investor Day 9.14.06
29
Summary
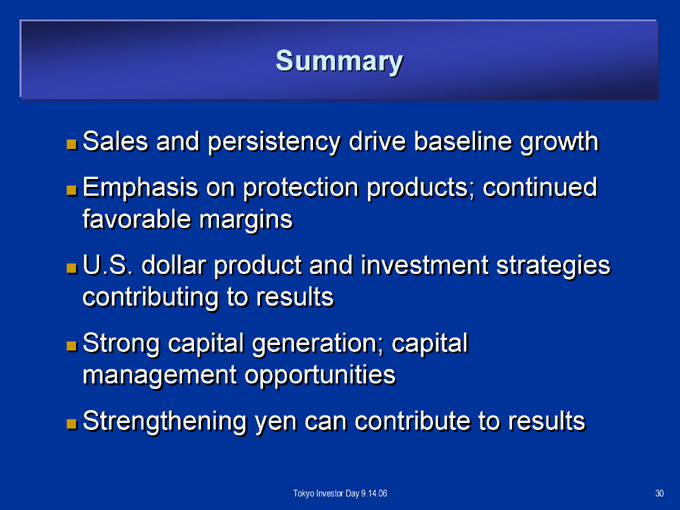
Sales and persistency drive baseline growth Emphasis on protection products; continued favorable margins U.S. dollar product and investment strategies contributing to results Strong capital generation; capital management opportunities Strengthening yen can contribute to results
Tokyo Investor Day 9.14.06
30
Japanese Insurance Operations
Kazuo Maeda
Co-President
Prudential International Insurance
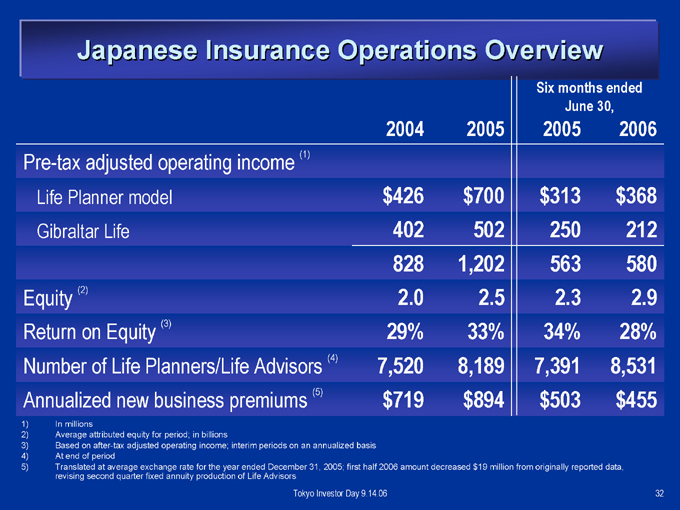
Japanese Insurance Operations Overview
| Six |
|
months ended June 30, |
| 2004 |
|
2005 2005 2006 |
| Pre-tax |
|
adjusted operating income (1) |
| Life |
|
Planner model $426 $700 $313 $368 |
| Gibraltar |
|
Life 402 502 250 212 |
| 828 |
|
1,202 563 580 |
| Equity |
|
(2) 2.0 2.5 2.3 2.9 |
| Return |
|
on Equity (3) 29% 33% 34% 28% |
| Number |
|
of Life Planners/Life Advisors (4) 7,520 8,189 7,391 8,531 |
| Annualized |
|
new business premiums (5) $719 $894 $503 $455 |
1) In millions
2) Average attributed equity for period; in billions
3) Based on after-tax adjusted operating income; interim periods on an annualized basis
4) At end of period
5) Translated at average exchange rate for the year ended December 31, 2005; first half 2006 amount decreased $19 million from originally reported data, revising second quarter fixed annuity production of Life Advisors
Tokyo Investor Day 9.14.06
32
Life Insurance Market in Japan
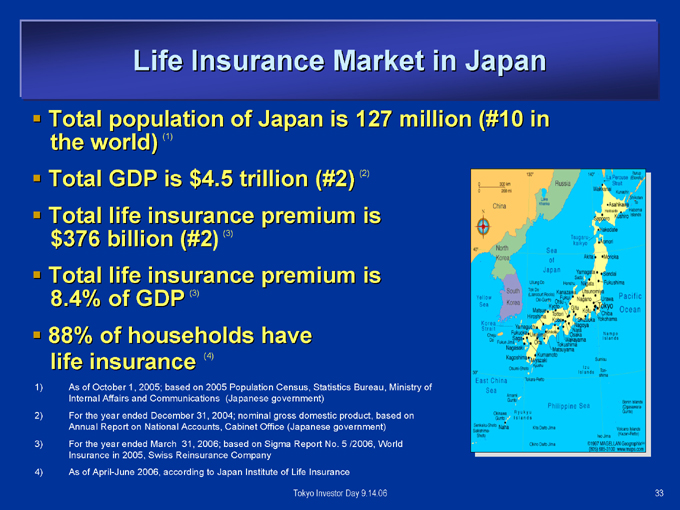
Total population of Japan is 127 million (#10 in the world) (1)
Total GDP is $4.5 trillion (#2) (2) Total life insurance premium is $376 billion (#2) (3) Total life insurance premium is 8.4% of GDP (3) 88% of households have life insurance (4)
1) As of October 1, 2005; based on 2005 Population Census, Statistics Bureau, Ministry of Internal Affairs and Communications (Japanese government)
2) For the year ended December 31, 2004; nominal gross domestic product, based on Annual Report on National Accounts, Cabinet Office (Japanese government)
3) For the year ended March 31, 2006; based on Sigma Report No. 5 /2006, World Insurance in 2005, Swiss Reinsurance Company
4) As of April-June 2006, according to Japan Institute of Life Insurance
Tokyo Investor Day 9.14.06
33
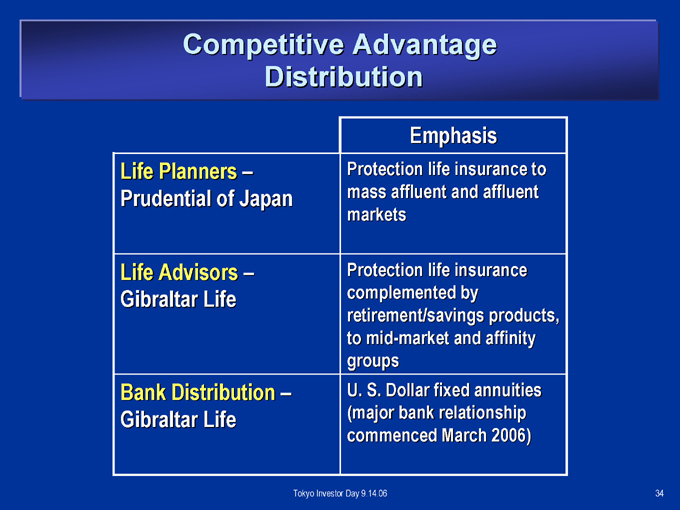
Competitive Advantage Distribution
Emphasis
| Life |
|
Planners – Prudential of Japan Protection life insurance to mass affluent and affluent markets |
Life Advisors – Gibraltar Life Protection life insurance complemented by retirement/savings products, to mid-market and affinity groups
| Bank |
|
Distribution – Gibraltar Life U. S. Dollar fixed annuities (major bank relationship commenced March 2006) |
Tokyo Investor Day 9.14.06
34
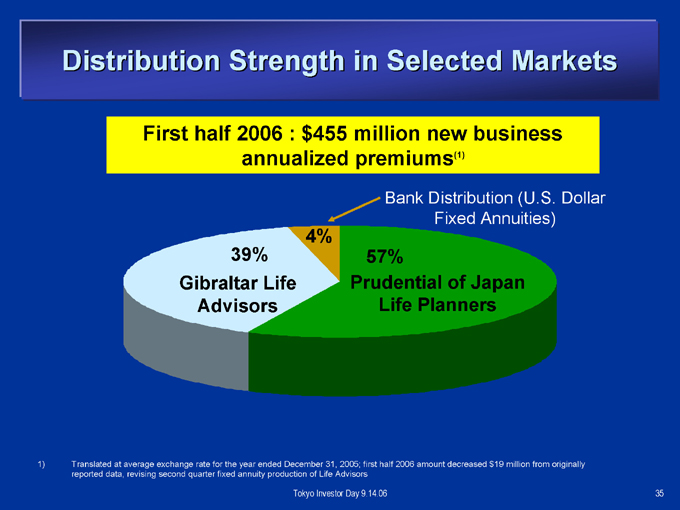
Distribution Strength in Selected Markets
First half 2006 : $455 million new business annualized premiums(1)
Bank Distribution (U.S. Dollar Fixed Annuities)
4%
39%
Gibraltar Life Advisors
57%
Prudential of Japan Life Planners
1) Translated at average exchange rate for the year ended December 31, 2005; first half 2006 amount decreased $19 million from originally reported data, revising second quarter fixed annuity production of Life Advisors
Tokyo Investor Day 9.14.06
35
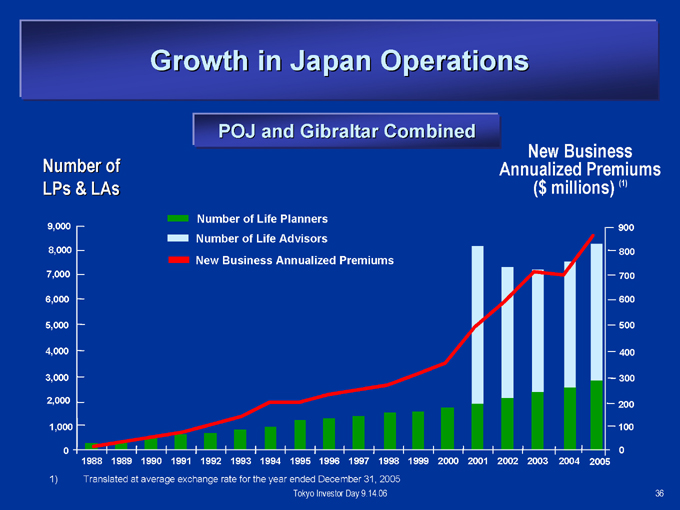
Growth in Japan Operations
POJ and Gibraltar Combined
Number of LPs & LAs
9,000 8,000 7,000 6,000
5,000
4,000
3,000
2,000
1,000
0
Number of Life Planners Number of Life Advisors
New Business Annualized Premiums
1988 1989 1990 1991 1992 1993 1994 1995 1996 1997 1998 1999 2000 2001 2002 2003 2004 2005
New Business Annualized Premiums ($ millions) (1)
900 800 700 600
500 400 300
200 100 0
1) Translated at average exchange rate for the year ended December 31, 2005
Tokyo Investor Day 9.14.06
36
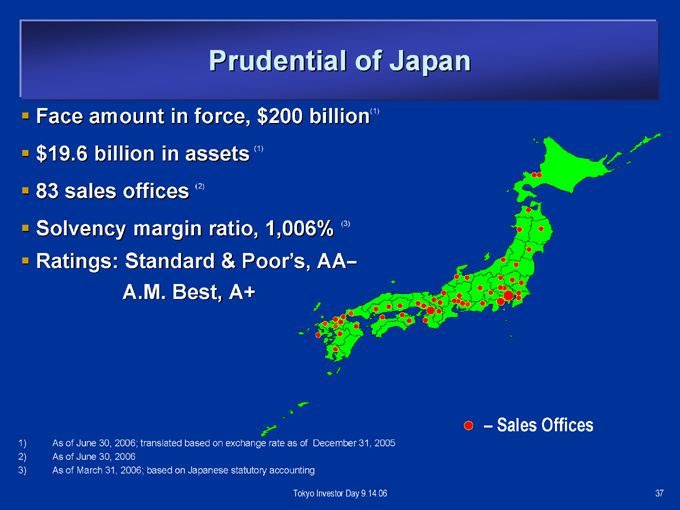
Prudential of Japan
Face amount in force, $200 billion(1) $19.6 billion in assets (1) 83 sales offices (2) Solvency margin ratio, 1,006% (3) Ratings: Standard & Poor’s, AA–
A.M. Best, A+
– Sales Offices
1) As of June 30, 2006; translated based on exchange rate as of December 31, 2005
2) As of June 30, 2006
3) As of March 31, 2006; based on Japanese statutory accounting
Tokyo Investor Day 9.14.06
37

Business Model
Life Planner – Needs-Based Selling
Life Planner – a selective, high quality sales force
– Only 2-4 out of 100 candidates are hired —
– Well trained and professional
– Customer focused
– Disciplined, and demonstrates “missionary zeal”
Profile of a typical POJ new Life Planner
– Age 32 years old
– College graduate
– Good sales experience outside the life insurance industry
– Married with children
– First job change
– POJ policyholder
– Referred by another POJ Life Planner
– Annual income in the previous job was about $50,000
Tokyo Investor Day 9.14.06
38
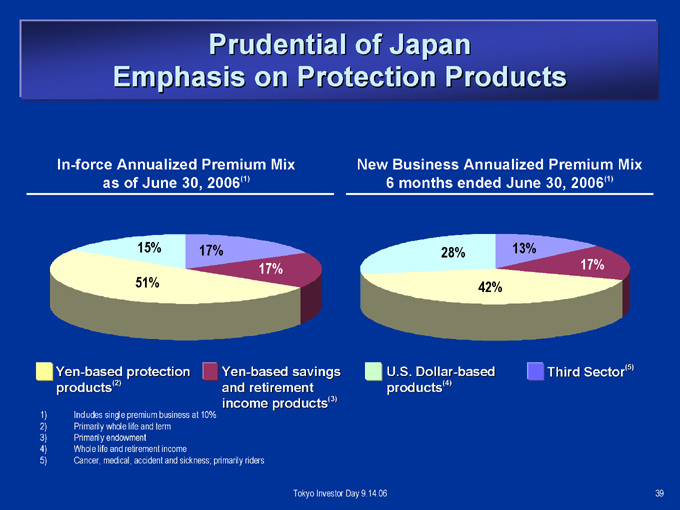
Prudential of Japan Emphasis on Protection Products
In-force Annualized Premium Mix as of June 30, 2006(1)
15%
17%
17%
51%
Yen-based protection products(2)
Yen-based savings and retirement income products(3)
New Business Annualized Premium Mix 6 months ended June 30, 2006(1)
28%
13%
17%
42%
U.S. Dollar-based products(4)
Third Sector(5)
1) Includes single premium business at 10%
2) Primarily whole life and term
3) Primarily endowment
4) Whole life and retirement income
5) Cancer, medical, accident and sickness; primarily riders
Tokyo Investor Day 9.14.06
39
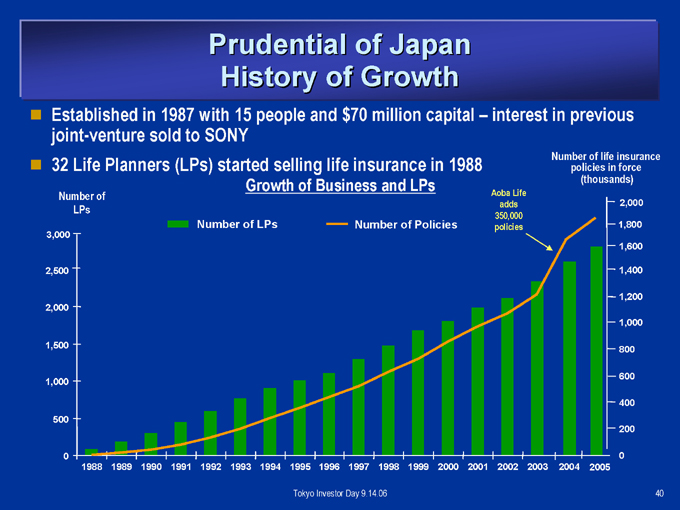
Prudential of Japan History of Growth
Established in 1987 with 15 people and $70 million capital – interest in previous joint-venture sold to SONY
32 Life Planners (LPs) started selling life insurance in 1988
Growth of Business and LPs
Number of LPs
Number of LPs
Number of Policies
Aoba Life adds 350,000 policies
Number of life insurance policies in force (thousands)
3,000 2,500 2,000 1,500 1,000 500 0
1988 1989 1990 1991 1992 1993 1994 1995 1996 1997 1998 1999 2000 2001 2002 2003 2004 2005
2,000 1,800 1,600 1,400
1,200 1,000 800 600 400 200 0
Tokyo Investor Day 9.14.06
40
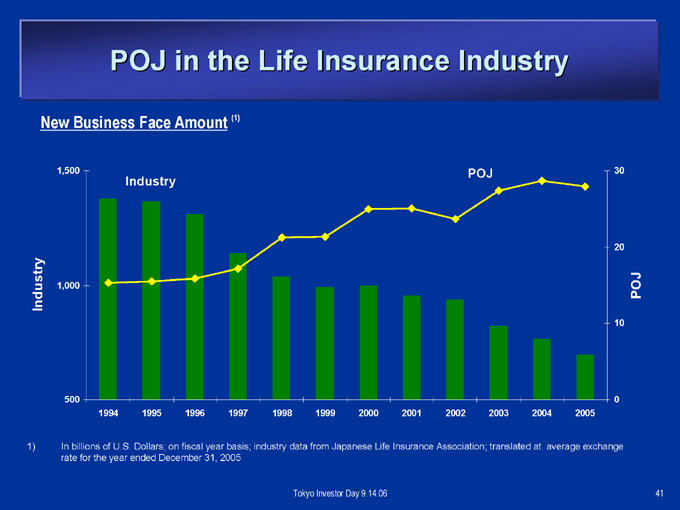
POJ in the Life Insurance Industry
New Business Face Amount (1)
Industry
1,500 1,000 500
Industry
POJ
1994 1995 1996 1997 1998 1999 2000 2001 2002 2003 2004 2005
30 20 10 0
POJ
1) In billions of U.S. Dollars; on fiscal year basis; industry data from Japanese Life Insurance Association; translated at average exchange rate for the year ended December 31, 2005
Tokyo Investor Day 9.14.06
41
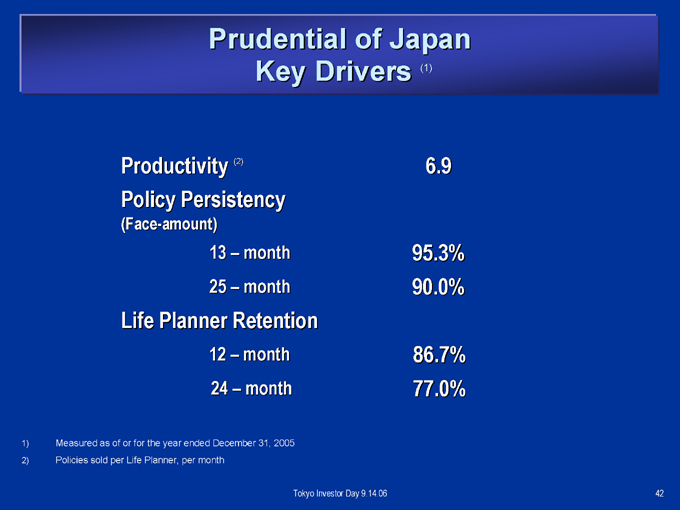
Prudential of Japan Key Drivers (1)
| Productivity |
|
(2) 6.9 |
| Policy |
|
Persistency |
| (Face-amount) |
|
| 13 |
|
– month 95.3% |
| 25 |
|
– month 90.0% |
| Life |
|
Planner Retention |
| 12 |
|
– month 86.7% |
| 24 |
|
– month 77.0% |
1) Measured as of or for the year ended December 31, 2005
2) Policies sold per Life Planner, per month
Tokyo Investor Day 9.14.06
42
Prudential of Japan Outlook
Continued demand for death protection insurance Customers increasingly selective of insurers Changing strategies of competitors
Death Protection
Medical insurance, nursing care, and variable annuities
Recovery of the Japanese economy: “business insurance” opportunity
Tokyo Investor Day 9.14.06
43
Gibraltar Life “Prudentialized” 2001 — 2004
Acquired by Prudential Financial in 2001 Leveraged Life Planner model
– Variable compensation structure
– Needs-based selling—
– Emphasis on protection products
– Focus on key drivers
Strengthened management team Built infrastructure Cultivated affinity group relationships
Tokyo Investor Day 9.14.06
44
Gibraltar Life: Building on a Sound
Foundation, 2005
Enhanced investment portfolio Growing Life Advisor distribution
Introduced products targeted to customer base and Life Advisor distribution Commenced bank distribution for selected products
Tokyo Investor Day 9.14.06
45
Gibraltar Life: U.S. Dollar Fixed Annuities Complement Product Line
New Business
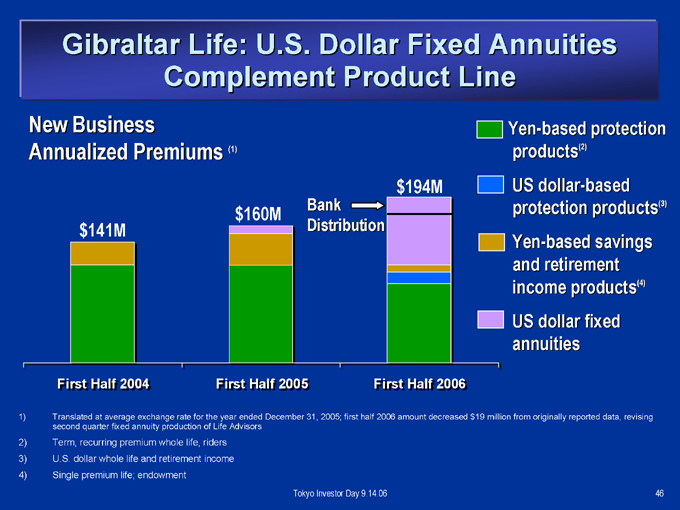
Annualized Premiums (1) $141M $160M
Bank
Distribution $194M
Yen-based protection products(2) US dollar-based protection products(3) Yen-based savings and retirement income products(4) US dollar fixed annuities
First Half 2004
First Half 2005
First Half 2006
1) Translated at average exchange rate for the year ended December 31, 2005; first half 2006 amount decreased $19 million from originally reported data, revising second quarter fixed annuity production of Life Advisors
2) Term, recurring premium whole life, riders
3) U.S. dollar whole life and retirement income
4) Single premium life; endowment
Tokyo Investor Day 9.14.06
46
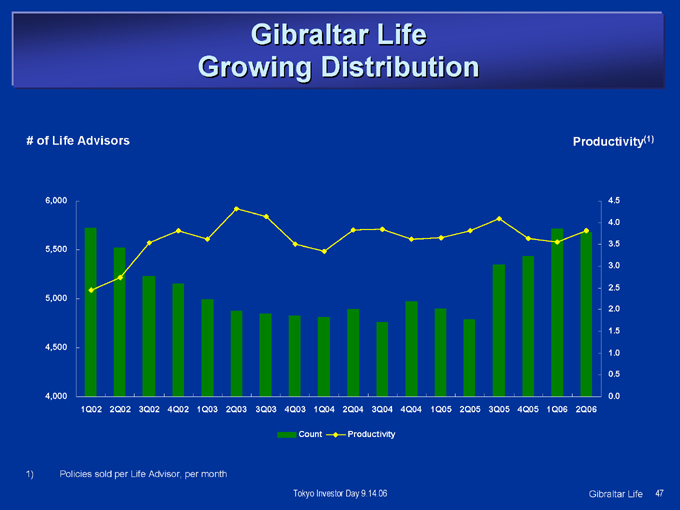
Gibraltar Life Growing Distribution
# of Life Advisors
6,000 5,500 5,000 4,500 4,000
1Q02 2Q02 3Q02 4Q02 1Q03 2Q03 3Q03 4Q03 1Q04 2Q04 3Q04 4Q04 1Q05 2Q05 3Q05 4Q05 1Q06 2Q06
Productivity(1)
4.5 4.0 3.5 3.0 2.5 2.0 1.5 1.0 0.5 0.0
Count
Productivity
1) Policies sold per Life Advisor, per month
Tokyo Investor Day 9.14.06
Gibraltar Life
47
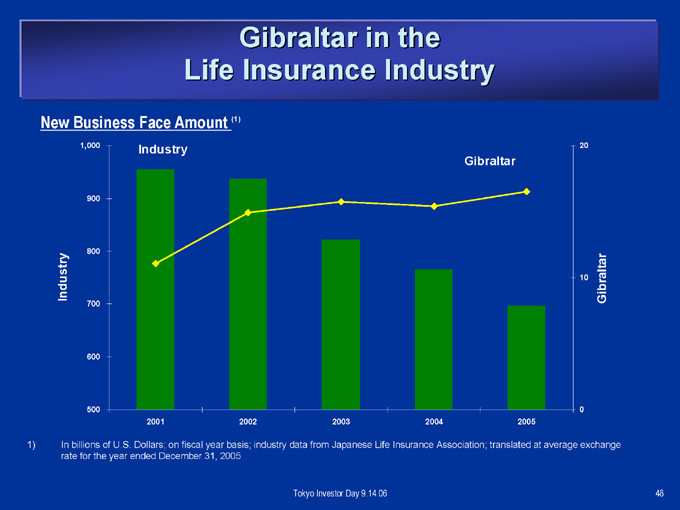
Gibraltar in the Life Insurance Industry
New Business Face Amount (1)
Industry
1,000 900 800 700 600 500
Industry
Gibraltar
2001 2002 2003 2004 2005
20 10 0
Gibraltar
1) In billions of U.S. Dollars; on fiscal year basis; industry data from Japanese Life Insurance Association; translated at average exchange rate for the year ended December 31, 2005
Tokyo Investor Day 9.14.06
48
Gibraltar Life
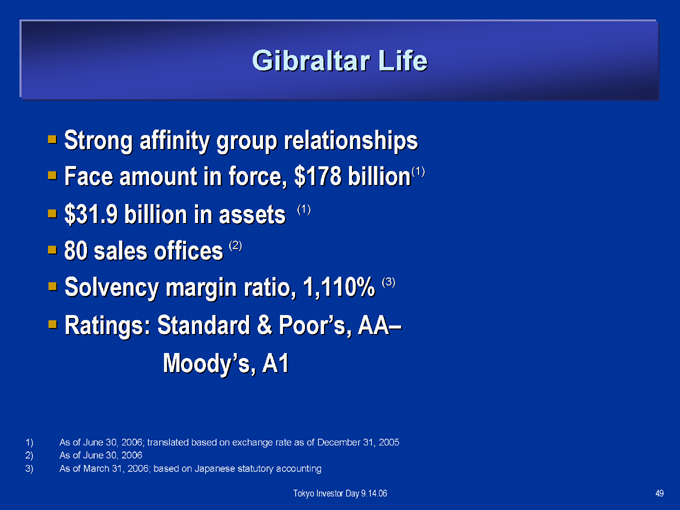
Strong affinity group relationships Face amount in force, $178 billion(1) $31.9 billion in assets (1) 80 sales offices (2) Solvency margin ratio, 1,110% (3) Ratings: Standard & Poor’s, AA–Moody’s, A1
1) As of June 30, 2006; translated based on exchange rate as of December 31, 2005
2) As of June 30, 2006
3) As of March 31, 2006; based on Japanese statutory accounting
Tokyo Investor Day 9.14.06
49
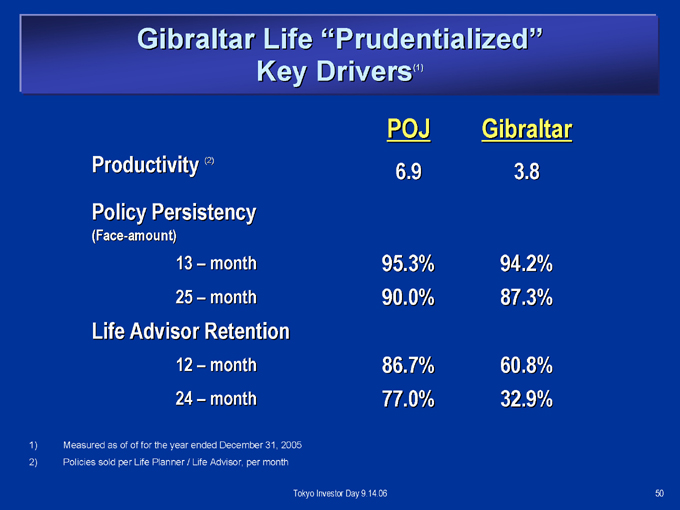
Gibraltar Life “Prudentialized” Key Drivers(1)
| POJ |
|
Gibraltar |
| Productivity |
|
(2) 6.9 3.8 |
| Policy |
|
Persistency |
| (Face-amount) |
|
| 13 |
|
– month 95.3% 94.2% |
| 25 |
|
– month 90.0% 87.3% |
| Life |
|
Advisor Retention |
| 12 |
|
– month 86.7% 60.8% |
| 24 |
|
– month 77.0% 32.9% |
1) Measured as of of for the year ended December 31, 2005
2) Policies sold per Life Planner / Life Advisor, per month
Tokyo Investor Day 9.14.06
50
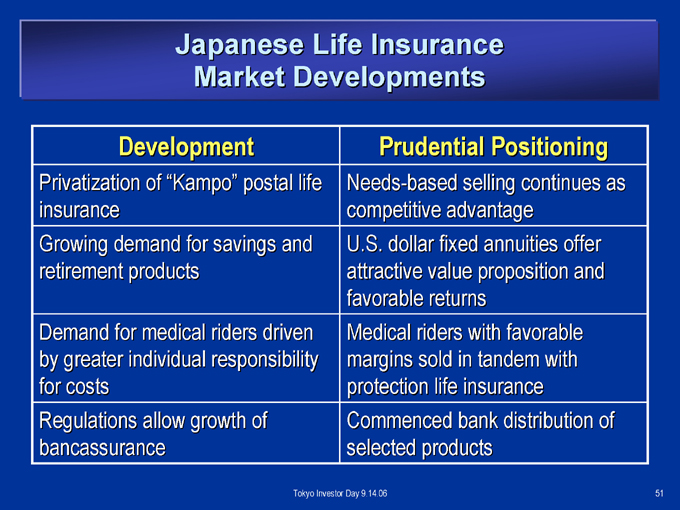
Japanese Life Insurance Market Developments
| Development |
|
Prudential Positioning |
| Privatization |
|
of “Kampo” postal life insurance Needs-based selling continues as competitive advantage |
Growing demand for savings and retirement products U.S. dollar fixed annuities offer attractive value proposition and favorable returns
Demand for medical riders driven by greater individual responsibility for costs Medical riders with favorable margins sold in tandem with protection life insurance
| Regulations |
|
allow growth of bancassurance Commenced bank distribution of selected products |
Tokyo Investor Day 9.14.06
51
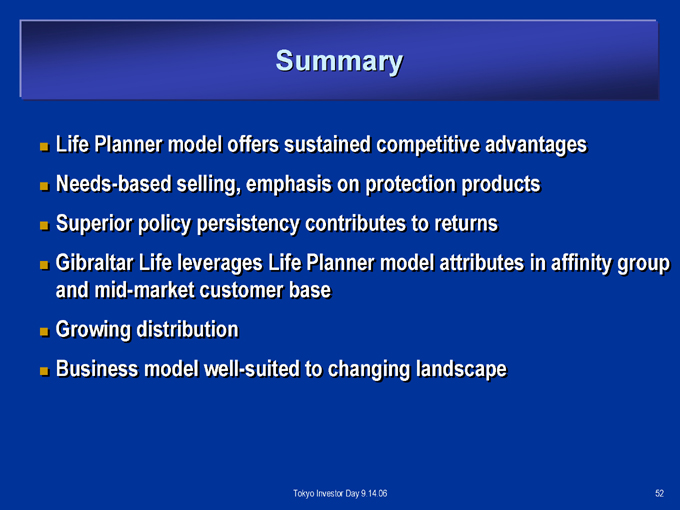
Summary
Life Planner model offers sustained competitive advantages Needs-based selling, emphasis on protection products Superior policy persistency contributes to returns
Gibraltar Life leverages Life Planner model attributes in affinity group and mid-market customer base Growing distribution Business model well-suited to changing landscape
Tokyo Investor Day 9.14.06
52
International Insurance Operations Outside Japan
Tim Feige
Co-President
Prudential International Insurance
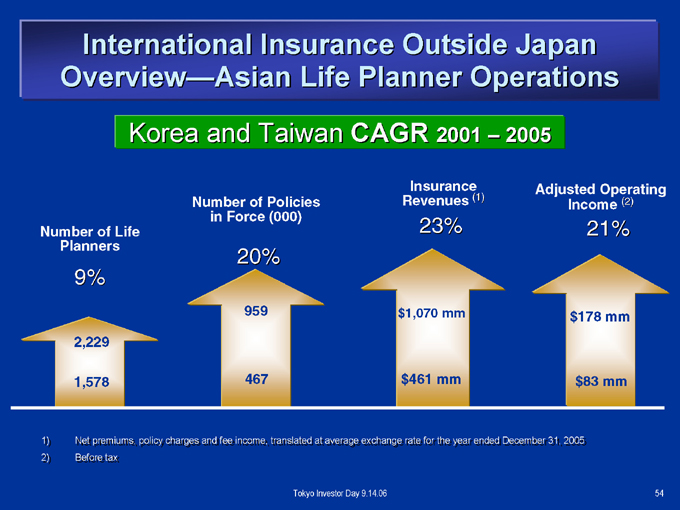
International Insurance Outside Japan Overview—Asian Life Planner Operations
Korea and Taiwan CAGR 2001 – 2005
Number of Life Planners
9%
2,229
1,578
Number of Policies in Force (000)
20%
959
467
Insurance Revenues (1)
23% $1,070 mm $461 mm
Adjusted Operating Income (2)
21% $178 mm $83 mm
1) Net premiums, policy charges and fee income, translated at average exchange rate for the year ended December 31, 2005
2) Before tax
Tokyo Investor Day 9.14.06
54
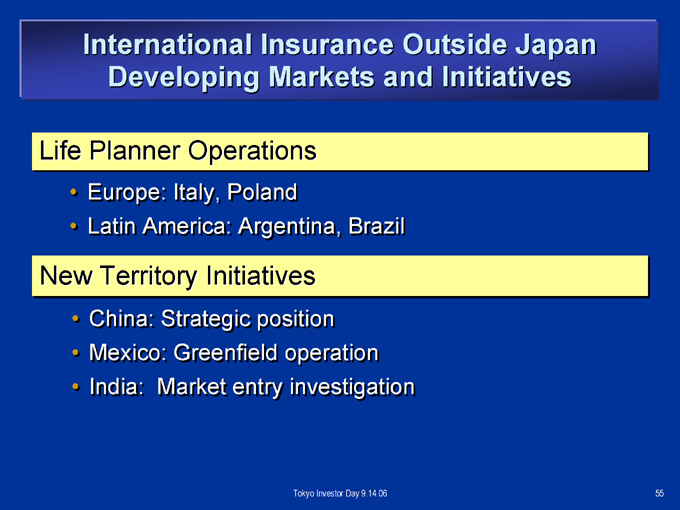
International Insurance Outside Japan Developing Markets and Initiatives
Life Planner Operations
Europe: Italy, Poland
Latin America: Argentina, Brazil
New Territory Initiatives
China: Strategic position Mexico: Greenfield operation India: Market entry investigation
Tokyo Investor Day 9.14.06
55
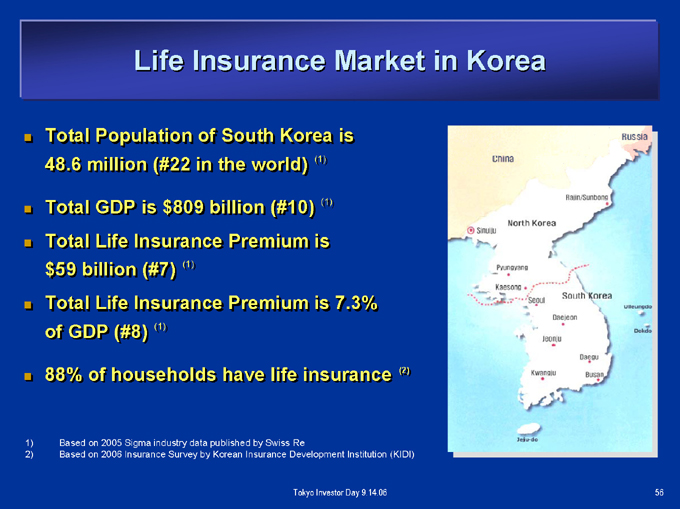
Life Insurance Market in Korea
Total Population of South Korea is 48.6 million (#22 in the world) (1)
Total GDP is $809 billion (#10) (1) Total Life Insurance Premium is $59 billion (#7) (1) Total Life Insurance Premium is 7.3% of GDP (#8) (1)
88% of households have life insurance (2)
1) Based on 2005 Sigma industry data published by Swiss Re
2) Based on 2006 Insurance Survey by Korean Insurance Development Institution (KIDI)
Tokyo Investor Day 9.14.06
56
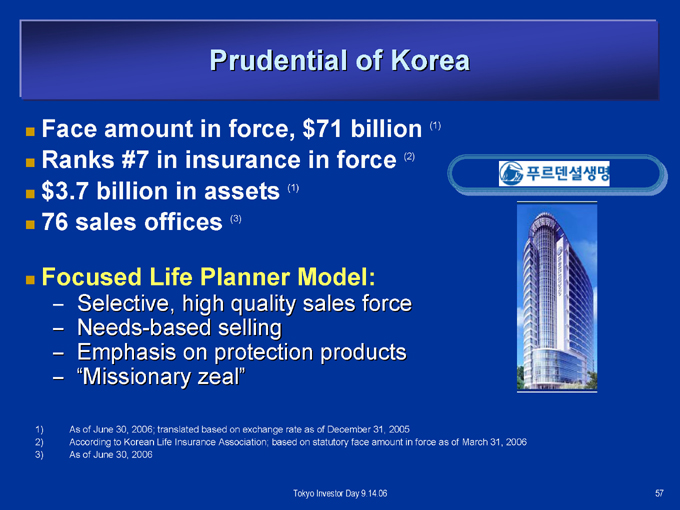
Prudential of Korea
Face amount in force, $71 billion (1) Ranks #7 in insurance in force (2) $3.7 billion in assets (1) 76 sales offices (3)
Focused Life Planner Model:
– Selective, high quality sales force
– Needs-based selling
– Emphasis on protection products
– “Missionary zeal”
1) As of June 30, 2006; translated based on exchange rate as of December 31, 2005
2) According to Korean Life Insurance Association; based on statutory face amount in force as of March 31, 2006
3) As of June 30, 2006
Tokyo Investor Day 9.14.06
57
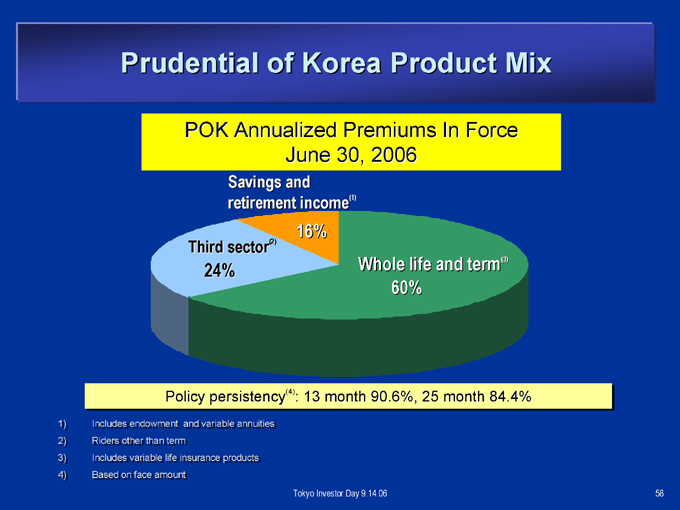
Prudential of Korea Product Mix
POK Annualized Premiums In Force June 30, 2006
Savings and retirement income(1)
Third sector(2)
24%
16%
Whole life and term(3) 60%
Policy persistency(4): 13 month 90.6%, 25 month 84.4%
1) Includes endowment and variable annuities 2) Riders other than term 3) Includes variable life insurance products 4) Based on face amount on
Tokyo Investor Day 9.14.06
58
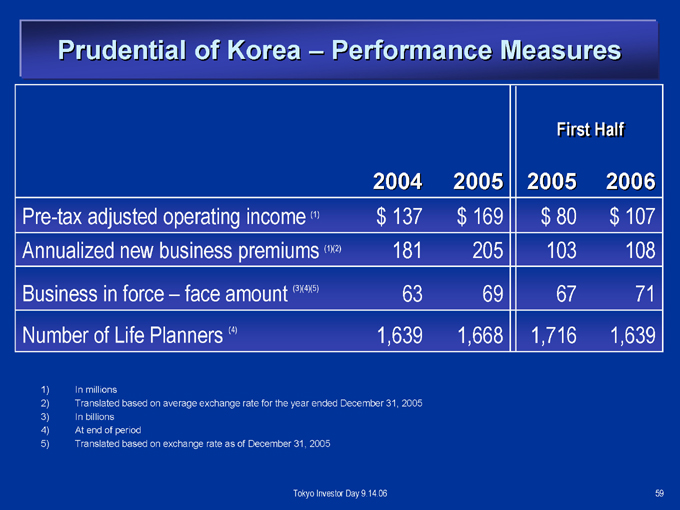
Prudential of Korea – Performance Measures
| First |
|
Half |
| 2004 |
|
2005 2005 2006 |
| Pre-tax |
|
adjusted operating income (1) $137 $169 $80 $107 |
| Annualized |
|
new business premiums (1)(2) 181 205 103 108 |
| Business |
|
in force – face amount (3)(4)(5) 63 69 67 71 |
| Number |
|
of Life Planners (4) 1,639 1,668 1,716 1,639 |
1) In millions
2) Translated based on average exchange rate for the year ended December 31, 2005
3) In billions
4) At end of period
5) Translated based on exchange rate as of December 31, 2005
Tokyo Investor Day 9.14.06
59

Prudential of Korea
Strong Business Model in Challenging Market
| Life |
|
Planner Count (1) Sales (2) Revenue (3) AOI |
| First |
|
Half 2006 versus -4% 4% 13% 34% |
| First |
|
Half |
| 2005 |
|
Continued growth: revenues, adjusted operating income Sales and Life Planner count affected by current competitive conditions Maintaining Life Planner model discipline: selective recruiting, emphasis on protection products, pricing, compensation
1) At end of period
2) Annualized new business premiums translated at average exchange rate for the year ended December 31, 2005 3) Adjusted operating income basis; translated at average exchange rate for the year ended December 31, 2005
Tokyo Investor Day 9.14.06
60
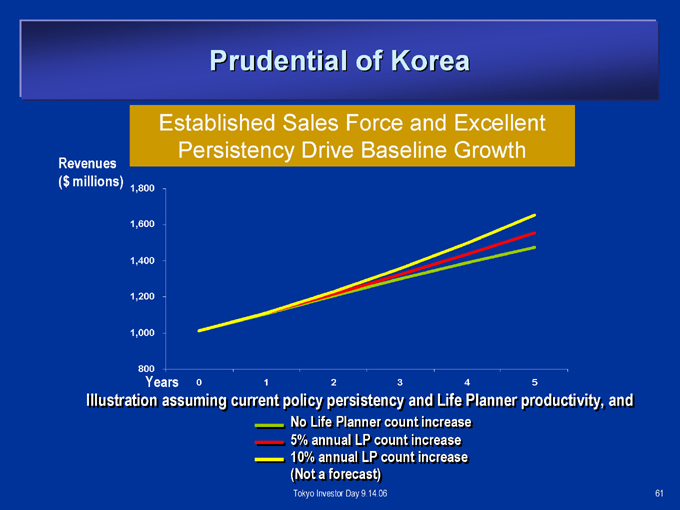
Prudential of Korea
Established Sales Force and Excellent Persistency Drive Baseline Growth
Revenues ($ millions)
1,800 1,600 1,400 1,200 1,000 800
Years 0 1 2 3 4 5
Illustration assuming current policy persistency and Life Planner productivity, and
No Life Planner count increase 5% annual LP count increase 10% annual LP count increase (Not a forecast)
Tokyo Investor Day 9.14.06
61
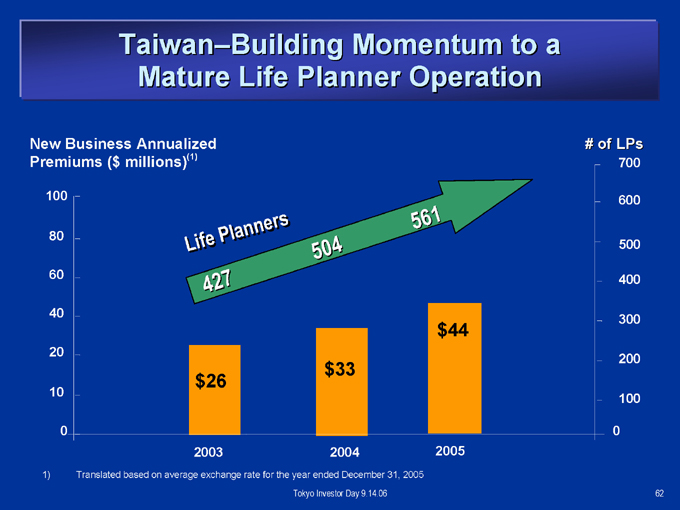
Taiwan–Building Momentum to a Mature Life Planner Operation
New Business Annualized Premiums ($ millions)(1)
100 80 60 40 20 10 0
Life Planners
427
504
561 $26 $33 $44
2003 2004 2005
# of LPs
700
600
500
400
300
200
100
0
1) Translated based on average exchange rate for the year ended December 31, 2005
Tokyo Investor Day 9.14.06
62
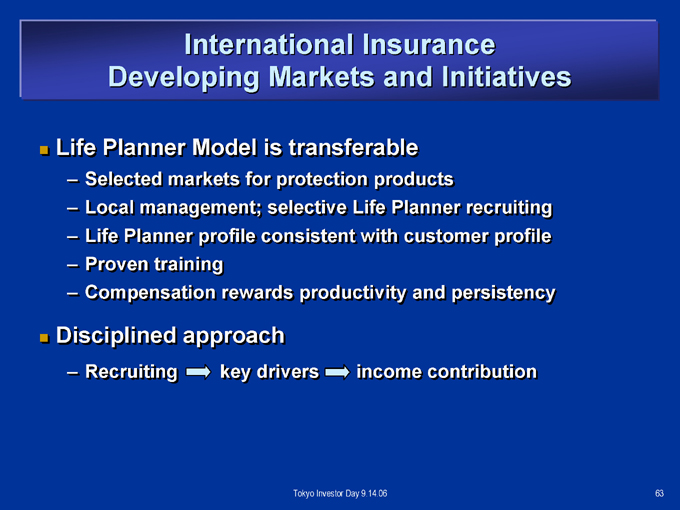
International Insurance Developing Markets and Initiatives
Life Planner Model is transferable
– Selected markets for protection products
– Local management; selective Life Planner recruiting
– Life Planner profile consistent with customer profile
– Proven training
– Compensation rewards productivity and persistency
Disciplined approach
– Recruiting key drivers income contribution
Tokyo Investor Day 9.14.06
63
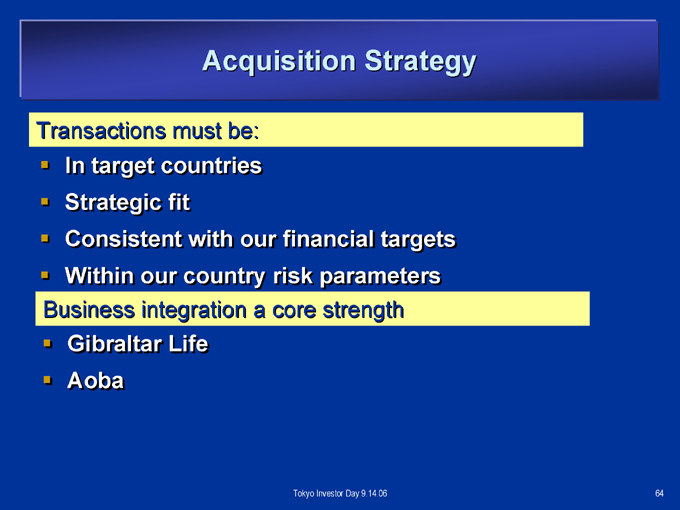
Acquisition Strategy
Transactions must be:
In target countries Strategic fit
Consistent with our financial targets Within our country risk parameters
Business integration a core strength
Gibraltar Life Aoba
Tokyo Investor Day 9.14.06
64
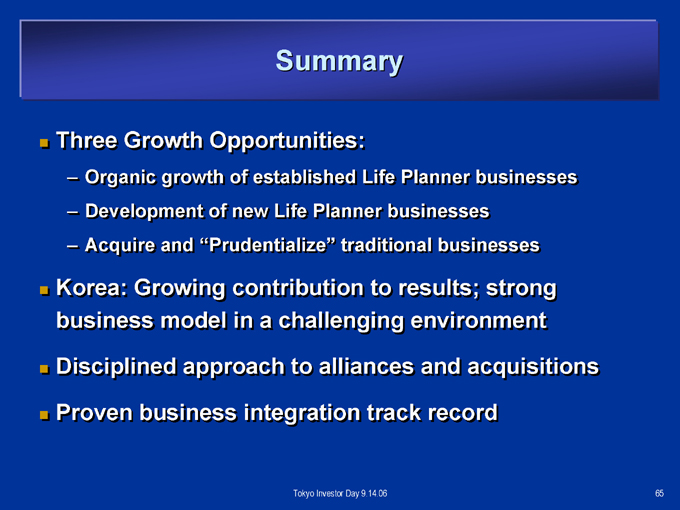
Summary
Three Growth Opportunities:
– Organic growth of established Life Planner businesses
– Development of new Life Planner businesses
– Acquire and “Prudentialize” traditional businesses
Korea: Growing contribution to results; strong business model in a challenging environment Disciplined approach to alliances and acquisitions Proven business integration track record
Tokyo Investor Day 9.14.06
65

Life Planners
The Heart of Our Business Model
Nick Miyazaki
Chief Marketing Officer
Life Planner Operations Prudential International Insurance

The Life Planner Career
Strong values and beliefs: protection life insurance serves society A career that”s “right” for 2-4 of 100 candidates Comprehensive, ongoing training Customer needs drive sales Compensation rewards productivity, persistency Entrepreneurial success while “making the world a better place”
Tokyo Investor Day 9.14.06
67

Life Planner Values and Beliefs
Life insurance protection serves society’s greater good Financial security and peace of mind are of great value Customer needs come first; products serve those needs Continuing, caring service is part of the customer relationship The Life Planner is a trusted advisor
Tokyo Investor Day 9.14.06
68
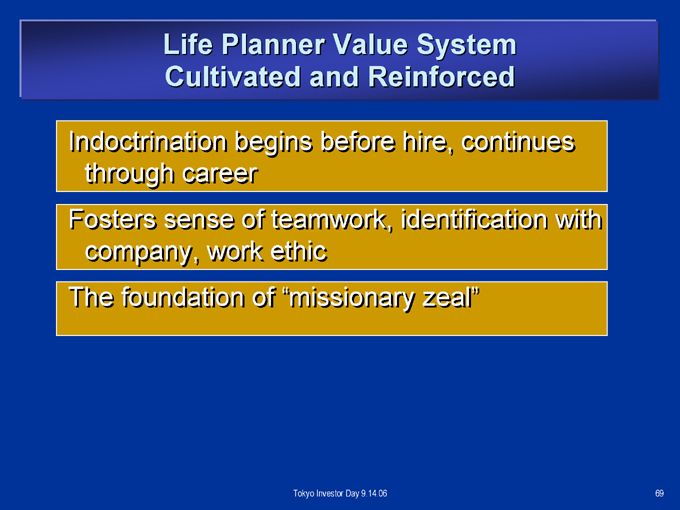
Life Planner Value System Cultivated and Reinforced
Indoctrination begins before hire, continues through career Fosters sense of teamwork, identification with company, work ethic The foundation of “missionary zeal”
Tokyo Investor Day 9.14.06
69
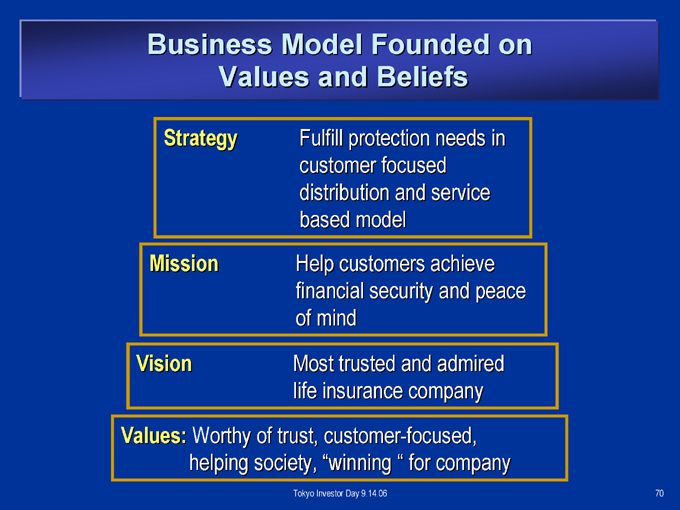
Business Model Founded on Values and Beliefs
Strategy
Fulfill protection needs in customer focused distribution and service based model
Mission
Help customers achieve financial security and peace of mind
Vision
Most trusted and admired life insurance company
Values: Worthy of trust, customer-focused, helping society, “winning “ for company
Tokyo Investor Day 9.14.06
70
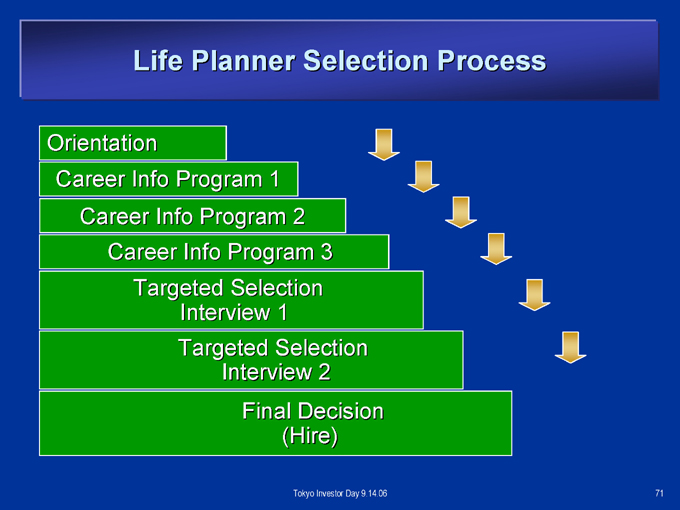
Life Planner Selection Process
Orientation
Career Info Program 1 Career Info Program 2 Career Info Program 3 Targeted Selection Interview 1 Targeted Selection Interview 2 Final Decision (Hire)
Tokyo Investor Day 9.14.06
71

Life Planner Selection Process What Makes the Grade
Impact
Oral communications skills Listening skills Energy Persuasiveness and salesmanship High objectives and standards Motivation; self starter Mental resilience Trainability
Tokyo Investor Day 9.14.06
72
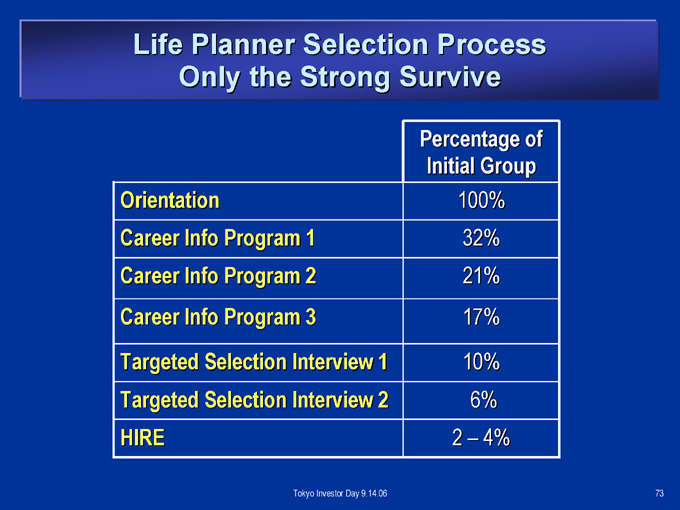
Life Planner Selection Process Only the Strong Survive
Percentage of Initial Group
| Orientation |
|
100% |
| Career |
|
Info Program 1 32% |
| Career |
|
Info Program 2 21% |
| Career |
|
Info Program 3 17% |
| Targeted |
|
Selection Interview 1 10% |
| Targeted |
|
Selection Interview 2 6% |
| HIRE |
|
2 – 4% |
Tokyo Investor Day 9.14.06
73
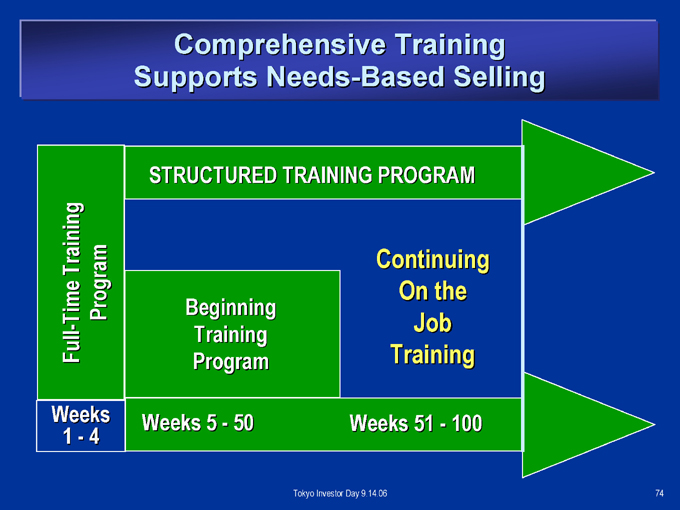
Comprehensive Training Supports Needs-Based Selling
Full-Time Training Program
STRUCTURED TRAINING PROGRAM
Beginning Training Program
Continuing On the Job Training
Weeks 1—4
Weeks 5—50
Weeks 51—100
Tokyo Investor Day 9.14.06
74
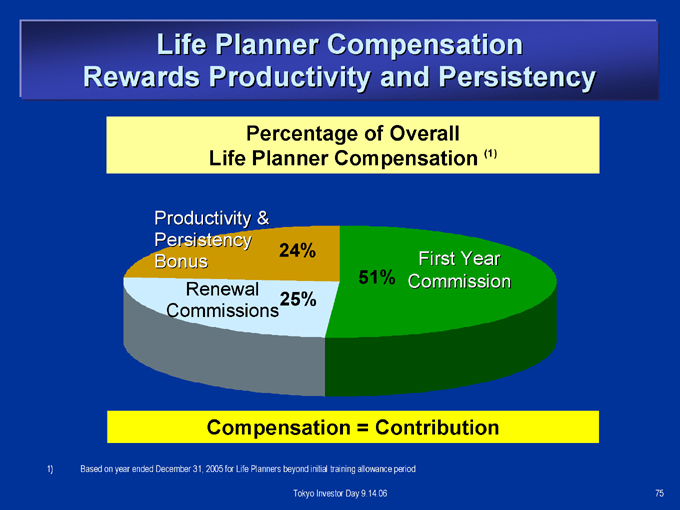
Life Planner Compensation Rewards Productivity and Persistency
Percentage of Overall Life Planner Compensation (1)
Productivity & Persistency Bonus
24%
Renewal Commissions
25%
51%
First Year Commission
Compensation = Contribution
1) Based on year ended December 31, 2005 for Life Planners beyond initial training allowance period Tokyo Investor Day 9.14.06
75
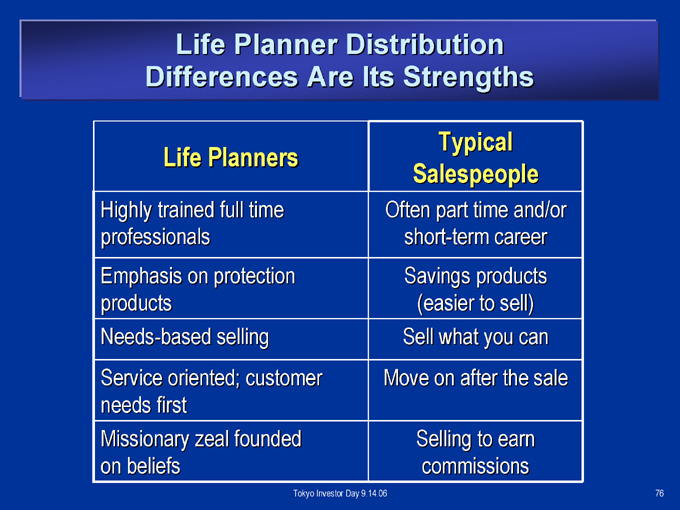
Life Planner Distribution Differences Are Its Strengths
Typical Salespeople Life Planners
Highly trained full time professionals Often part time and/or short-term career Emphasis on protection products Savings products (easier to sell) Needs-based selling Sell what you can Service oriented; customer needs first Move on after the sale Missionary zeal founded on beliefs Selling to earn commissions
Tokyo Investor Day 9.14.06
76