SLIDE PRESENTATION OF PRUDENTIAL FINANCIAL, INC.
Published on
 1 Investor Day 12.04.07 Prudential Financial, Inc. Investor Day December 4, 2007 Prudential Financial, Inc. Investor Day December 4, 2007 Exhibit 99.1 |
 2 Investor Day December 4, 2007 Investor Day December 4, 2007 Eric Durant Senior Vice President Investor Relations Eric Durant Senior Vice President Investor Relations |
 3 Investor Day 12.04.07 Forward-Looking Statements Certain of the statements included in this presentation constitute forward-looking statements within the meaning of the U.S. Private Securities Litigation Reform Act of 1995. It is possible that actual results may differ materially from any expectations or predictions expressed in this presentation. Words such as “expects,” “believes,” “anticipates,” “includes,” “plans,” “assumes,” “estimates,” “projects,” “intends,” “should,” “will,” “shall,” or variations of such words are generally part of forward-looking statements. Forward-looking statements are made based on management’s current expectations and beliefs concerning future developments and their potential effects upon Prudential Financial, Inc. and its subsidiaries. There can be no assurance that future developments affecting Prudential Financial, Inc. and its subsidiaries will be those anticipated by management. These forward-looking statements are not a guarantee of future performance and involve risks and uncertainties, and there are certain important factors that could cause actual results to differ, possibly materially, from expectations or estimates reflected in such forward-looking statements, including, among others: (1) general economic, market and political conditions, including the performance and fluctuations of stock, real estate, and other financial markets; (2) interest rate fluctuations; (3) reestimates of our reserves for future policy benefits and claims; (4) differences between actual experience regarding mortality, morbidity, persistency, surrender experience, interest rates or market returns and the assumptions we use in pricing our products, establishing liabilities and reserves or for other purposes; (5) changes in our assumptions related to deferred policy acquisition costs, valuation of business acquired or goodwill; (6) changes in our claims-paying or credit ratings; (7) investment losses and defaults; (8) competition in our product lines and for personnel; (9) changes in tax law; (10) economic, political, currency and other risks relating to our international operations; (11) fluctuations in foreign currency exchange rates and foreign securities markets; (12) regulatory or legislative changes; (13) adverse determinations in litigation or regulatory matters and our exposure to contingent liabilities, including in connection with our divestiture or winding down of businesses; (14) domestic or international military actions, natural or man-made disasters including terrorist activities or pandemic disease, or other events resulting in catastrophic loss of life; (15) ineffectiveness of risk management policies and procedures in identifying, monitoring and managing risks; (16) effects of acquisitions, divestitures and restructurings, including possible difficulties in integrating and realizing the projected results of acquisitions; (17) changes in statutory or U.S. GAAP accounting principles, practices or policies; (18) changes in assumptions for retirement expense; (19) Prudential Financial, Inc.’s primary reliance, as a holding company, on dividends or distributions from its subsidiaries to meet debt payment obligations and continue share repurchases, and the applicable regulatory restrictions on the ability of the subsidiaries to pay such dividends or distributions; and (20) risks due to the lack of legal separation between our Financial Services Businesses and our Closed Block Business. Prudential Financial, Inc. does not intend, and is under no obligation, to update any particular forward-looking statement included in this presentation. _______________________________________________________________________________
Prudential Financial, Inc. of the United States is not affiliated with Prudential PLC which is headquartered in the United Kingdom. |
 4 Investor Day 12.04.07 Non–GAAP Measure Adjusted operating income is a non-GAAP measure of performance of our Financial Services Businesses. Adjusted operating income excludes "Realized investment gains (losses), net," as adjusted, and related charges and adjustments. A significant element of realized investment gains and losses are impairments and credit-related and interest rate-related gains and losses. Impairments and losses from sales of credit-impaired securities, the timing of which depends largely on market credit cycles, can vary considerably across periods. The timing of other sales that would result in gains or losses, such as interest rate-related gains or losses, is largely subject to our discretion and influenced by market opportunities as well as our tax profile. Realized investment gains (losses) representing profit or loss of certain of our businesses which primarily originate investments for sale or syndication to unrelated investors, and those associated with terminating hedges of foreign currency earnings and current period yield adjustments are included in adjusted operating income. Realized investment gains and losses from products that are free standing derivatives or contain embedded derivatives, and from associated derivative portfolios that are part of an economic hedging program related to the risk of those products, are included in adjusted operating income. Adjusted operating income also excludes investment gains and losses on trading account assets supporting insurance liabilities and changes in experience-rated contractholder liabilities due to asset value changes, because these recorded changes in asset and liability values will ultimately accrue to contractholders. Trends in the underlying profitability of our businesses can be more clearly identified without the fluctuating effects of these transactions. In addition, adjusted operating income excludes the results of divested businesses, which are not relevant to our ongoing operations. Discontinued operations, which is presented as a separate component of net income under GAAP, is also excluded from adjusted operating income. We believe that the presentation of adjusted operating income as we measure it for management purposes enhances understanding of the results of operations of the Financial Services Businesses by highlighting the results from ongoing operations and the underlying profitability of our businesses. However, adjusted operating income is not a substitute for income determined in accordance with GAAP, and the excluded items are important to an understanding of our overall results of operations. The schedules on the following three pages provide a reconciliation of adjusted operating income for the Financial Services Businesses to income from continuing operations in accordance with GAAP. Return on equity (“ROE”) based on adjusted operating income is determined by dividing adjusted operating income after-tax (giving effect to the direct equity adjustment for earnings per share calculation), annualized for interim periods, by average attributed equity for the Financial Services Businesses excluding accumulated other comprehensive income related to unrealized gains and losses on investments for all periods and accumulated other comprehensive income related to pension and postretirement benefits for periods including and after 2004. An alternative measure to ROE based on adjusted operating income is return on average equity based on income from continuing operations. Return on average equity based on income from continuing operations represents income from continuing operations after-tax as determined in accordance with GAAP (giving effect to the direct equity adjustment for earnings per share calculation), annualized for interim periods, divided by average total attributed equity for the Financial Services Businesses. Return on average equity based on income from continuing operations is 16.82% and 14.04% for the nine months ended September 30, 2007 and 2006, respectively, and 14.67%, 15.48%, 9.23%, 5.38% and 3.79% for the years ended December 31, 2006, 2005, 2004, 2003 and 2002, respectively. Our expectations of Common Stock earnings per share and return on equity are based on after-tax adjusted operating income. Because we do not predict future realized investment gains / losses or recorded changes in asset and liability values that will ultimately accrue to contractholders, we cannot provide a measure of our Common Stock earnings per share or return on equity expectations based on income from continuing operations of the Financial Services Businesses, which is the GAAP measure most comparable to adjusted operating income. For additional information about adjusted operating income and the comparable GAAP measure please refer to our Annual Report on Form 10-K for the year ended December 31, 2006, our Quarterly Report on Form 10-Q for the quarter ended September 30, 2007 and our Current Report on Form 8-K dated October 4, 2007 on the Investor Relations Web site at www.investor.prudential.com. Additional historical information relating to the Company’s financial performance, including its third quarter 2007 Quarterly Financial Supplement, is also located on the Investor Relations website. The information referred to above and on the prior page, as well as the risks of our businesses described in our Annual Report on Form 10-K for the year ended December 31, 2006, and our Quarterly Report on Form 10-Q for the quarter ended September 30, 2007, should be considered by readers when reviewing forward-looking statements contained in this presentation. |
 5 Investor Day 12.04.07 Reconciliation between adjusted operating income and the comparable GAAP measure Reconciliation between adjusted operating income and the comparable GAAP measure Prudential Financial, Inc. (in millions, except per share data) 2002 2003 2004 2005 2006 Financial Services Businesses: Pre-tax adjusted operating income by division: Insurance Division 545 $ 788 $ 991 $ 1,227 $ 1,359 $ Investment Division 238 287 351 707 1,129 International Insurance and Investments Division 757 803 994 1,416 1,566 Corporate and other operations 133 75 161 188 47 Total pre-tax adjusted operating income 1,673 1,953 2,497 3,538 4,101 Income taxes, applicable to adjusted operating income 559 638 673 1,115 1,174 Financial Services Businesses after-tax adjusted operating income 1,114 1,315 1,824 2,423 2,927 Reconciling items: Realized investment gains (losses), net, and related charges and adjustments (856) (204) 4 561 90 Investment gains (losses) on trading account assets supporting insurance liabilities,
net - - (55) (33) 35 Change in experience-rated contractholder liabilities due to asset value changes - - 1 (44) 11 Sales practices remedies and costs (20) - - - - Divested businesses (10) (171) (24) (16) 76 Equity in earnings of operating joint ventures (7) (71) (72) (214) (322) Total reconciling items, before income taxes (893) (446) (146) 254 (110) Income taxes, not applicable to adjusted operating income (497) (148) (75) (473) (48) Total reconciling items, after income taxes (396) (298) (71) 727 (62) Income from continuing operations (after-tax) of Financial Services Businesses
before equity in earnings of operating joint ventures, extraordinary gain on
acquisition and cumulative effect of accounting change 718 1,017 1,753 3,150 2,865 Equity in earnings of operating joint ventures, net of taxes 5 45 55 142 208 Income from continuing operations (after-tax) of Financial Services Businesses
before extraordinary gain on acquisition and cumulative effect of accounting
change 723 1,062 1,808 3,292 3,073 Income (loss) from discontinued operations, net of taxes (44) (37) (76) (73) 71 Extraordinary gain on acquisition, net of taxes - - 21 - - Cumulative effect of accounting change, net of taxes - - (79) - - Net income of Financial Services Businesses 679 $ 1,025 $ 1,674 $ 3,219 $ 3,144 $ Earnings per share of Common Stock (diluted): Financial Services Businesses after-tax adjusted operating income 2.00 $ 2.51 $ 3.59 $ 4.81 $ 6.06 $ Reconciling items: Realized investment gains (losses), net, and related charges and adjustments (1.48) (0.37) 0.01 1.08 0.18 Investment gains (losses) on trading account assets supporting insurance liabilities,
net - - (0.10) (0.06) 0.07 Change in experience-rated contractholder liabilities due to asset value changes - - - (0.08) 0.02 Sales practices remedies and costs (0.03) - - - - Divested businesses (0.02) (0.31) (0.05) (0.03) 0.15 Equity in earnings of operating joint ventures (0.01) (0.13) (0.13) (0.42) (0.64) Total reconciling items, before income taxes (1.54) (0.81) (0.27) 0.49 (0.22) Income taxes, not applicable to adjusted operating income (0.86) (0.26) (0.14) (0.91) (0.10) Total reconciling items, after income taxes (0.68) (0.55) (0.13) 1.40 (0.12) Income from continuing operations (after-tax) of Financial Services Businesses
before equity in earnings of operating joint ventures, extraordinary gain on
acquisition and cumulative effect of accounting change 1.32 1.96 3.46 6.21 5.94 Equity in earnings of operating joint ventures, net of taxes 0.01 0.09 0.10 0.27 0.42 Income from continuing operations (after-tax) of Financial Services Businesses
before extraordinary gain on acquisition and cumulative effect of accounting
change 1.33 2.05 3.56 6.48 6.36 Income (loss) from discontinued operations, net of taxes (0.08) (0.07) (0.14) (0.14) 0.14 Extraordinary gain on acquisition, net of taxes - - 0.04 - - Cumulative effect of accounting change, net of taxes - - (0.15) - - Net income of Financial Services Businesses 1.25 $ 1.98 $ 3.31 $ 6.34 $ 6.50 $ Weighted average number of outstanding Common shares (diluted basis) 578.0 548.4 531.2 520.9 494.0 Reconciliation to Consolidated Net Income of Prudential Financial, Inc: Net income of Financial Services Businesses (above) 679 $ 1,025 $ 1,674 $ 3,219 $ 3,144 $ Net income (loss) of Closed Block Business (485) 239 582 321 284 Consolidated net income 194 $ 1,264 $ 2,256 $ 3,540 $ 3,428 $ Direct equity adjustments for earnings per share calculations 43 $ 60 $ 84 $ 82 $ 68 $ Year ended December 31, |
 6 Investor Day 12.04.07 Reconciliation between adjusted operating income and the comparable GAAP measure (continued) Reconciliation between adjusted operating income and the comparable GAAP measure (continued) Prudential Financial, Inc. (in millions, except per share data) Sept 30, 2006 Sept 30, 2007 Financial Services Businesses: Pre-tax adjusted operating income by division: Insurance Division 1,010 $ 1,255 $ Investment Division 768 1,086 International Insurance and Investments Division 1,168 1,410 Corporate and other operations 60 (4) Total pre-tax adjusted operating income 3,006 3,747 Income taxes, applicable to adjusted operating income 861 1,104 Financial Services Businesses after-tax adjusted operating income 2,145 2,643 Reconciling items: Realized investment gains (losses), net, and related charges and adjustments (40) 63 Investment gains (losses) on trading account assets supporting insurance liabilities,
net (8) 10 Change in experience-rated contractholder liabilities due to asset value changes 28 4 Sales practices remedies and costs - - Divested businesses 58 29 Equity in earnings of operating joint ventures (223) (323) Total reconciling items, before income taxes (185) (217) Income taxes, not applicable to adjusted operating income (91) (90) Total reconciling items, after income taxes (94) (127) Income from continuing operations (after-tax) of Financial Services Businesses
before equity in earnings of operating joint ventures, extraordinary gain on
acquisition and cumulative effect of accounting change 2,051 2,516 Equity in earnings of operating joint ventures, net of taxes 146 200 Income from continuing operations (after-tax) of Financial Services Businesses
before extraordinary gain on acquisition and cumulative effect of accounting
change 2,197 2,716 Income (loss) from discontinued operations, net of taxes 54 4 Extraordinary gain on acquisition, net of taxes - - Cumulative effect of accounting change, net of taxes - - Net income of Financial Services Businesses 2,251 $ 2,720 $ Earnings per share of Common Stock (diluted): Financial Services Businesses after-tax adjusted operating income 4.41 $ 5.69 $ Reconciling items: Realized investment gains (losses), net, and related charges and adjustments (0.08) 0.13 Investment gains (losses) on trading account assets supporting insurance liabilities,
net (0.02) 0.02 Change in experience-rated contractholder liabilities due to asset value changes 0.06 0.01 Sales practices remedies and costs - - Divested businesses 0.12 0.06 Equity in earnings of operating joint ventures (0.45) (0.68) Total reconciling items, before income taxes (0.37) (0.46) Income taxes, not applicable to adjusted operating income (0.18) (0.19) Total reconciling items, after income taxes (0.19) (0.27) Income from continuing operations (after-tax) of Financial Services Businesses
before equity in earnings of operating joint ventures, extraordinary gain on
acquisition and cumulative effect of accounting change 4.22 5.42 Equity in earnings of operating joint ventures, net of taxes 0.29 0.43 Income from continuing operations (after-tax) of Financial Services Businesses
before extraordinary gain on acquisition and cumulative effect of accounting
change 4.51 5.85 Income (loss) from discontinued operations, net of taxes 0.11 0.01 Extraordinary gain on acquisition, net of taxes - - Cumulative effect of accounting change, net of taxes - - Net income of Financial Services Businesses 4.62 $ 5.86 $ Weighted average number of outstanding Common shares (diluted basis) 497.8 471.6 Reconciliation to Consolidated Net Income of Prudential Financial, Inc: Net income of Financial Services Businesses (above) 2,251 $ 2,720 $ Net income (loss) of Closed Block Business 140 113 Consolidated net income 2,391 $ 2,833 $ Direct equity adjustments for earnings per share calculations 51 $
42 $
Nine months ended |
 7 Investor Day 12.04.07 Reconciliation between adjusted operating income and the comparable GAAP measure (continued) Reconciliation between adjusted operating income and the comparable GAAP measure (continued) Prudential Financial, Inc. COMBINED STATEMENTS OF OPERATIONS - FINANCIAL SERVICES BUSINESSES (in millions) 2002 2003 2004 2005 2006 Sept 30, 2006 Sept 30, 2007 Revenues (1): Premiums 7,195 $ 7,848 $ 8,736 $ 10,128 $ 10,287 $ 7,694 $ 8,077 $ Policy charges and fee income 1,815 1,978 2,385 2,529 2,649 1,912 2,294 Net investment income 5,017 4,913 5,771 6,861 7,657 5,647 6,240 Asset management fees, commissions and other income 3,618 2,971 2,783 3,358 3,969 2,831 3,406 Total revenues 17,645 17,710 19,675 22,876 24,562 18,084 20,017 Benefits and Expenses (1): Insurance and annuity benefits 7,662 8,158 8,897 9,990 10,423 7,818 8,104 Interest credited to policyholders' account balances 1,730 1,718 2,220 2,516 2,790 2,045 2,286 Interest expense 195 200 334 615 949 694 831 Deferral of acquisition costs (1,064) (1,270) (1,528) (1,801) (2,037) (1,492) (1,649) Amortization of acquisition costs 739 533 766 910 670 431 643 General and administrative expenses 6,710 6,418 6,489 7,108 7,666 5,582 6,055 Total benefits and expenses 15,972 15,757 17,178 19,338 20,461 15,078 16,270 Adjusted operating income before income taxes 1,673 1,953 2,497 3,538 4,101 3,006 3,747 Reconciling items: Realized investment gains (losses), net, and related adjustments (862) (161) 62 669 73 (70) 80 Related charges 6 (43) (58) (108) 17 30 (17) Total realized investment gains (losses), net, and related charges and adjustments
(856) (204) 4 561 90 (40) 63 Investment gains (losses) on trading account assets supporting insurance liabilities,
net - - (55) (33) 35 (8) 10 Change in experience-rated contractholder liabilities due to asset value changes - - 1 (44) 11 28 4 Sales practices remedies and costs (20) - - - - - - Divested businesses (10) (171) (24) (16) 76 58 29 Equity in earnings of operating joint ventures (7) (71) (72) (214) (322) (223) (323) Total reconciling items, before income taxes (893) (446) (146) 254 (110) (185) (217) Income from continuing operations before income taxes, equity inearnings of
operating joint ventures, extraordinary gain on acquisition and cumulative
effect of accounting change 780 1,507 2,351 3,792 3,991 2,821 3,530 Income tax expense 62 490 598 642 1,126 770 1,014 Income from continuing operations before equity in earnings of operating joint
ventures, extraordinary gain on acquisition and cumulative effect of
accounting change 718 $ 1,017 $ 1,753 $ 3,150 $ 2,865 $ 2,051 $ 2,516 $ (1) Revenues exclude realized investment gains, net of losses and related charges and
adjustments; investment gains, net of losses, on trading account assets supporting insurance liabilities, and revenues of divested businesses, and include revenues representing
equity in earnings of operating joint ventures. Benefits and expenses exclude charges related to realized investment gains, net of losses; change in experience-rated
contractholder liabilities due to asset value changes, benefits and expenses
of divested businesses, and sales practices remedies and costs. Year ended December 31, Nine months ended |
 8 Prudential Financial, Inc. Prudential Financial, Inc. Art Ryan CEO and Chairman Art Ryan CEO and Chairman |
 9 Investor Day 12.04.07 Where We Are Today • Balanced portfolio of businesses and risks • High ROE combined with strong capital position and cash flow generation • Growth engines in international insurance and domestic retirement and savings • Asset management capabilities complement product manufacturing and generate strong earnings • Diversified distribution channels • Acquisition and integration track record |
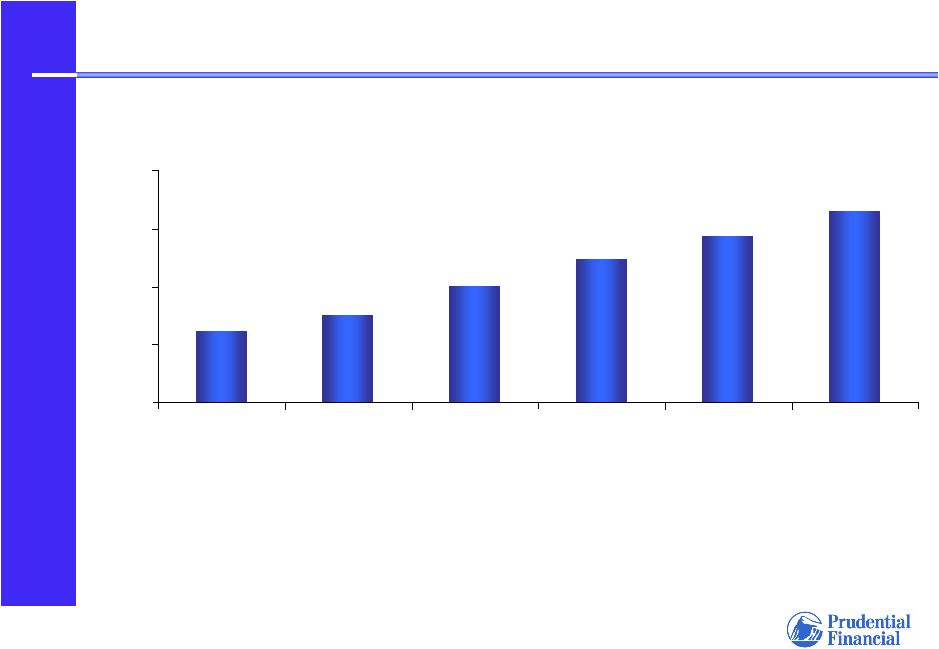 10 Investor Day 12.04.07 ROE Progress (1) 16.5% 7.5% 14.3% 12.3% 10.1% 6.1% 0.0% 5.0% 10.0% 15.0% 20.0% 2002 2003 2004 2005 2006 YTDSept07 1) For the Financial Services Businesses (FSB); based on after-tax adjusted operating income
and on attributed equity excluding accumulated other comprehensive income
related to unrealized gains and losses on investments for all periods and
accumulated other comprehensive income related to pension and postretirement benefits for periods including and after 2004; YTD September 2007 on an annualized basis. |
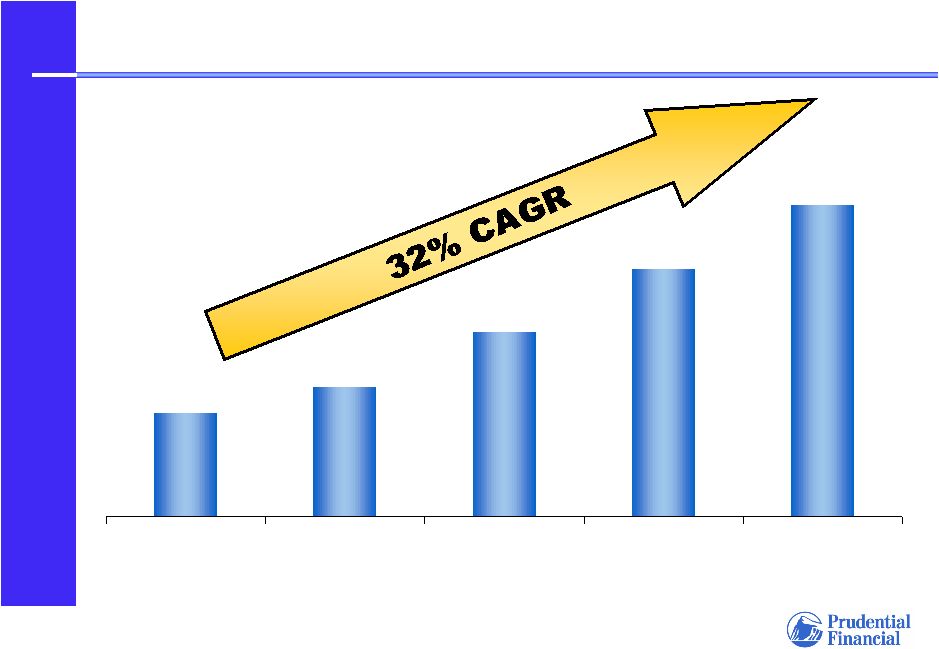 11 Investor Day 12.04.07 $2.51 $3.59 $4.81 $6.06 $2.00 2002 2003 2004 2005 2006 Earnings Per Share Growth (1) 1) Based on after-tax adjusted operating income of the FSB
|
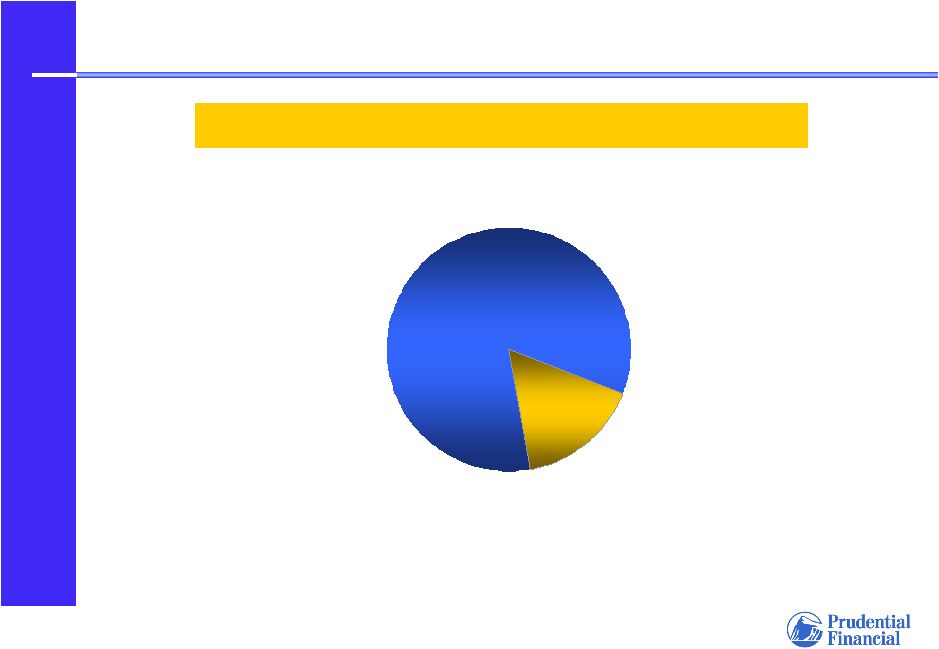 12 Investor Day 12.04.07 83% of Equity is Attributed to Operating Businesses 1) As of September 30, 2007 for the FSB; excludes accumulated other comprehensive income
related to unrealized gains and losses on investments and
pension/postretirement benefits Total Total attributed attributed equity equity of of $22.2 $22.2 billion billion (1) 17% 83% Operating Businesses Corporate & Other |
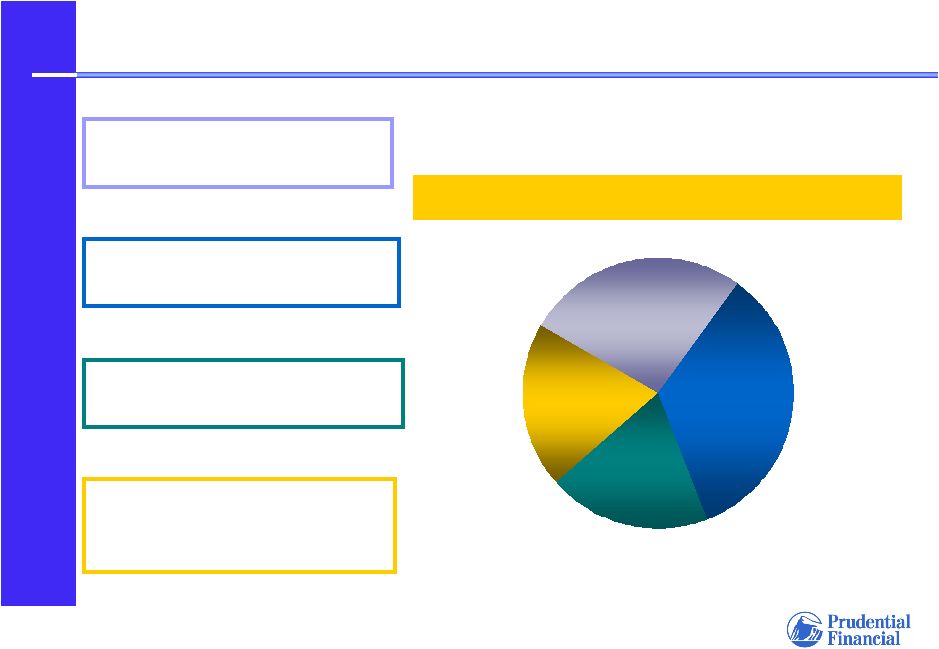 13 Investor Day 12.04.07 $3.7 $4.9 $6.4 $3.6 Attributed Equity of Operating Businesses INTERNATIONAL INSURANCE RETIREMENT & SAVINGS DOMESTIC INSURANCE Attributed Attributed equity equity $18.6 $18.6 billion billion (1) • Life Planner model • Gibraltar Life • Retirement • Individual Annuities • Individual Life • Group Insurance INVESTMENT BUSINESSES • Financial Advisory • Asset Management • International Investments 1) As of September 30, 2007 for the FSB; excludes accumulated other comprehensive income
related to unrealized gains and losses on investments and
pension/postretirement benefits |
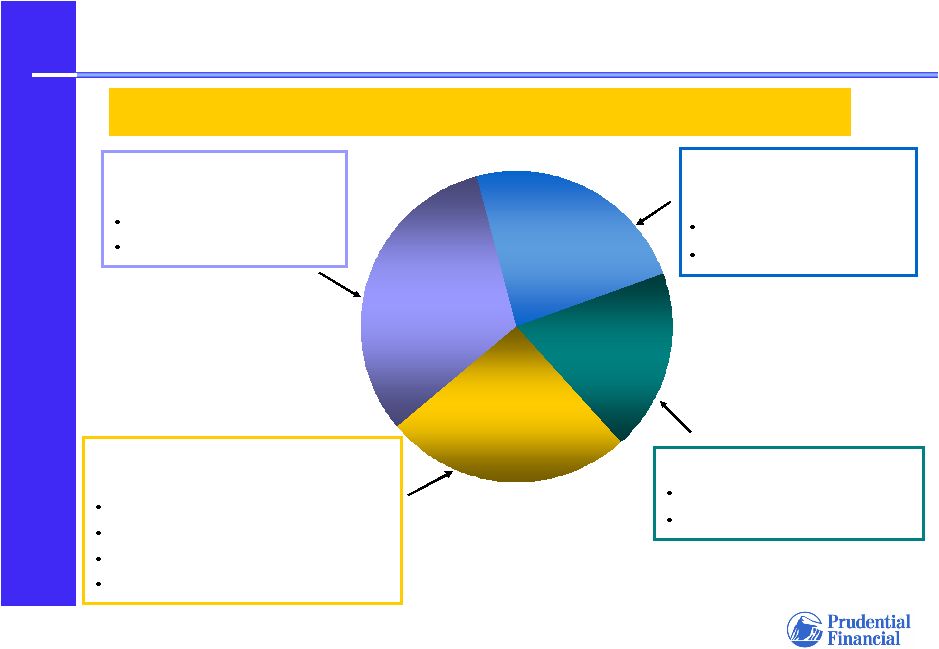 14 Investor Day 12.04.07 32% 25% 19% 24% Complementary and Diversified Businesses DOMESTIC INSURANCE Individual Life Group Insurance Adjusted Adjusted operating operating income income $3.747 $3.747 billion billion (1) (1) ) 1) Before-tax; for the FSB; for the nine months ended September 30, 2007 RETIREMENT & SAVINGS Retirement Individual Annuities INVESTMENT BUSINESSES & CORPORATE Financial Advisory Asset Management International Investments Corporate & Other INTERNATIONAL INSURANCE Life Planner model Gibraltar Life |
 15 International Division International Division Mark Grier Vice Chairman Prudential Financial, Inc. Mark Grier Vice Chairman Prudential Financial, Inc. |
 16 Investor Day 12.04.07 International Developments • • Market Needs • Distribution • Regulation |
 17 Investor Day 12.04.07 Japanese Life Planner Operations International Division Organizational Structure International Division Finance Investment Management Operations and Technology Human Resources Gibraltar Life Insurance Operations Outside Japan International Investments Businesses |
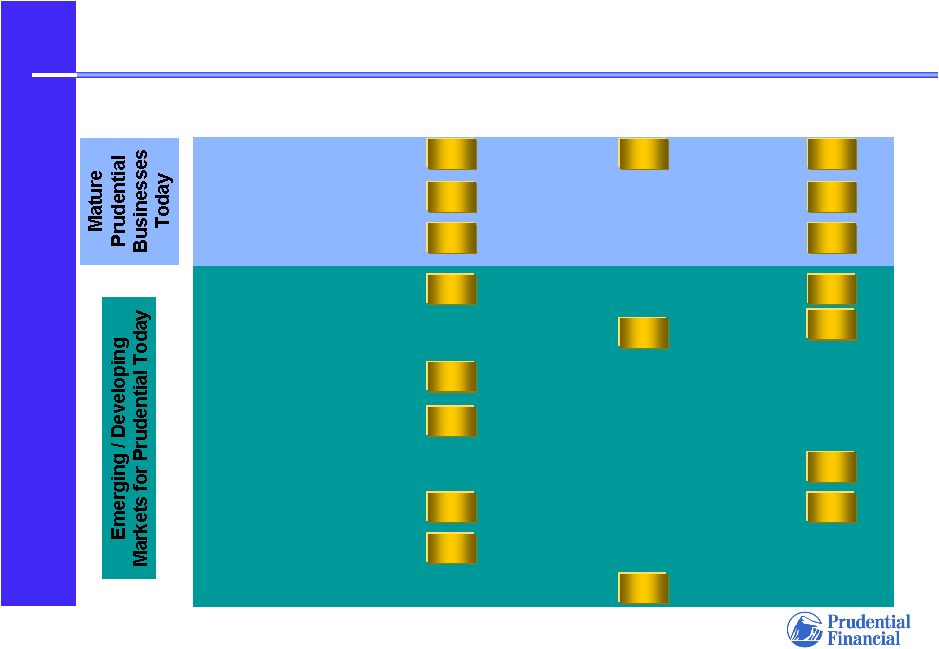 18 Investor Day 12.04.07 International Division Today India Mexico Poland Germany Brazil Argentina China Taiwan Korea Italy Life Planning Insurance Japan International Investments Traditional Insurance |
 19 Investor Day 12.04.07 Key Elements of Our International Strategy • Concentrate on a limited number of attractive countries • Emphasize proprietary distribution: recruiting, selection, needs-based selling • Target the affluent and mass affluent consumer • Focus on both life insurance and asset management • Grow both organically and through opportunistic acquisitions |
 20 Investor Day 12.04.07 Our Division Goals • Sustainable low to mid-teen AOI growth • Sustainable 20% ROE’s • Strong free cash flow • Complementary group of International businesses with short-term and long-term growth potential |
 21 Investor Day 12.04.07 Where We Are Today • Leadership positions in life planning • Gibraltar generates high ROE’s and cash flows • Developing asset management platforms • Profitability dominated by Japan and Korea • Acquisitions potentially additive • Expect to achieve our financial goals |
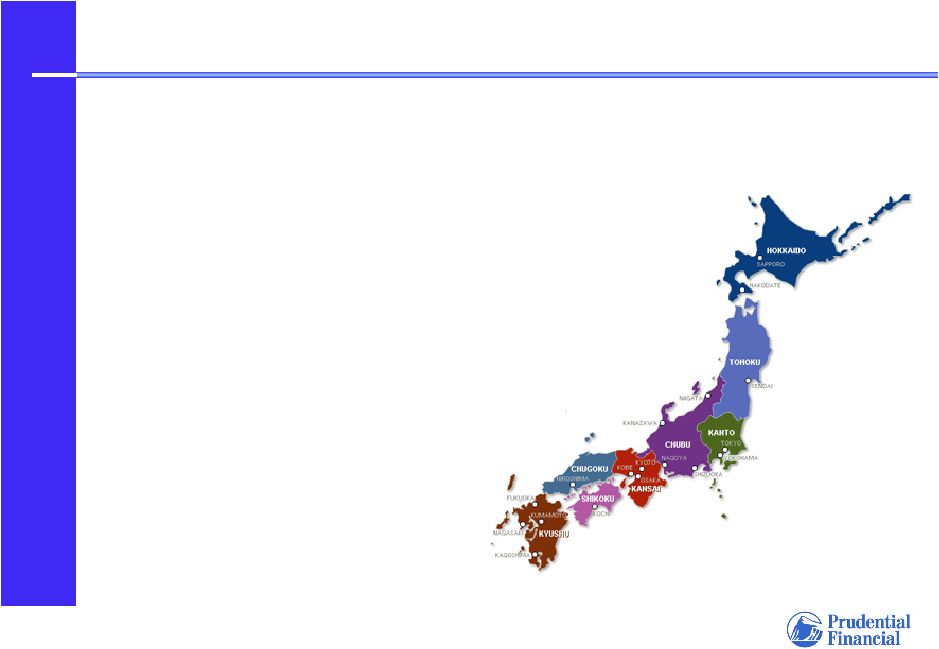 22 Investor Day 12.04.07 Japan Room for Growth in a Leading Market • Japan is world’s second largest life insurance market with a 16.4% world share (1) • 88% of households have life insurance (2) • Industry’s insurance in-force has been declining • Prudential’s market share is 4.1% and has been increasing (3) 1) World Insurance in 2006, SGMA, Swiss RE 2) As of April-June 2006, according to Japanese Institute of Life Insurance 3) Based on face amount in-force as of March 31, 2007, according to Statistics of Life
Insurance Business in Japan 2006 |
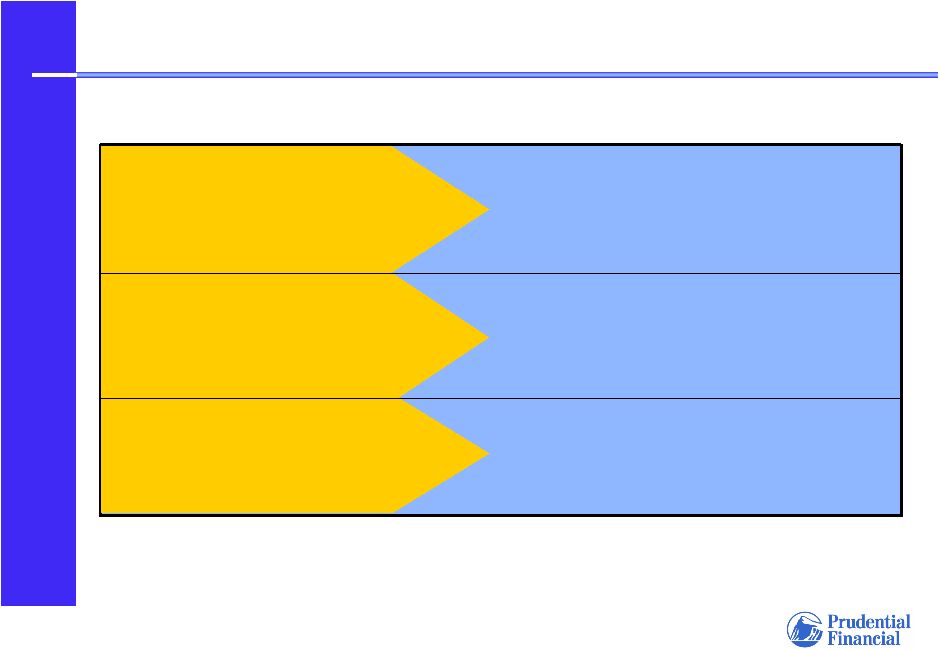 23 Investor Day 12.04.07 Competitive Advantage Life Planning Insurance • Variable compensation structure • Rewards productivity and persistency • Identify protection needs before discussing products • Protection life insurance purchased as a solution to identified need • Life Planner profile similar to customer profile • Life Planner maintains contact with client, as trusted professional Compensation structure • Aligns customer/agent/company interest Needs-based selling • Financial planning approach • Emphasis on protection products Life Planners • Very selective recruiting • Highly trained career professionals |
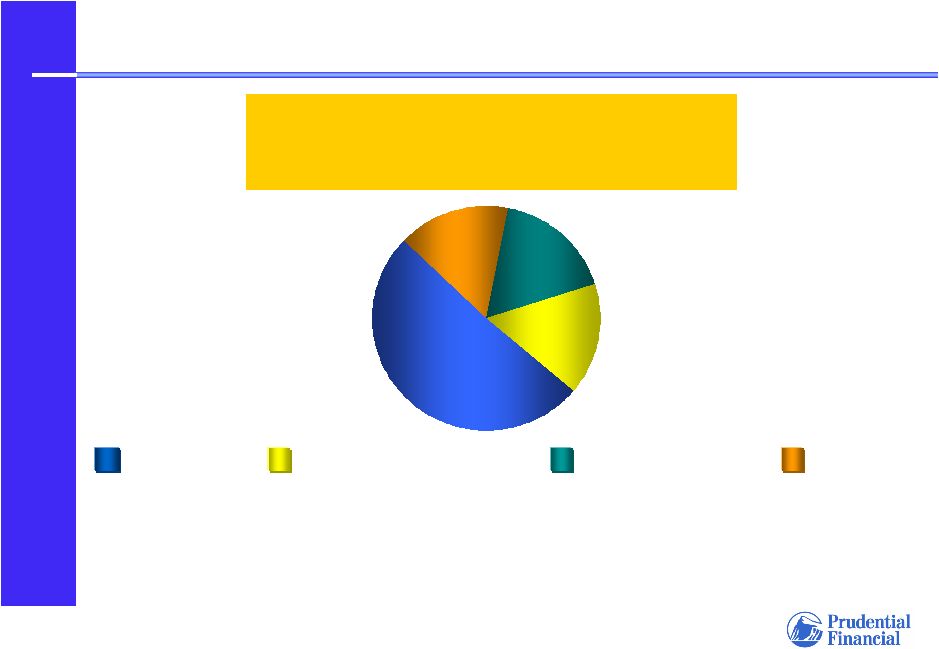 24 Investor Day 12.04.07 17% 16% 16% 51% Yen-based protection products (2) Yen-based savings and retirement income products (3) U.S. Dollar-based products (4) Prudential of Japan In Force Annualized Premium as of September 30, 2007 (1) 1) Includes single premium business at 10% 2) Primarily whole life and term 3) Primarily endowment 4) Whole life and retirement income 5) Cancer, medical, accident and sickness; primarily riders Third Sector (5) Life Planner Business Emphasis on Protection Products |
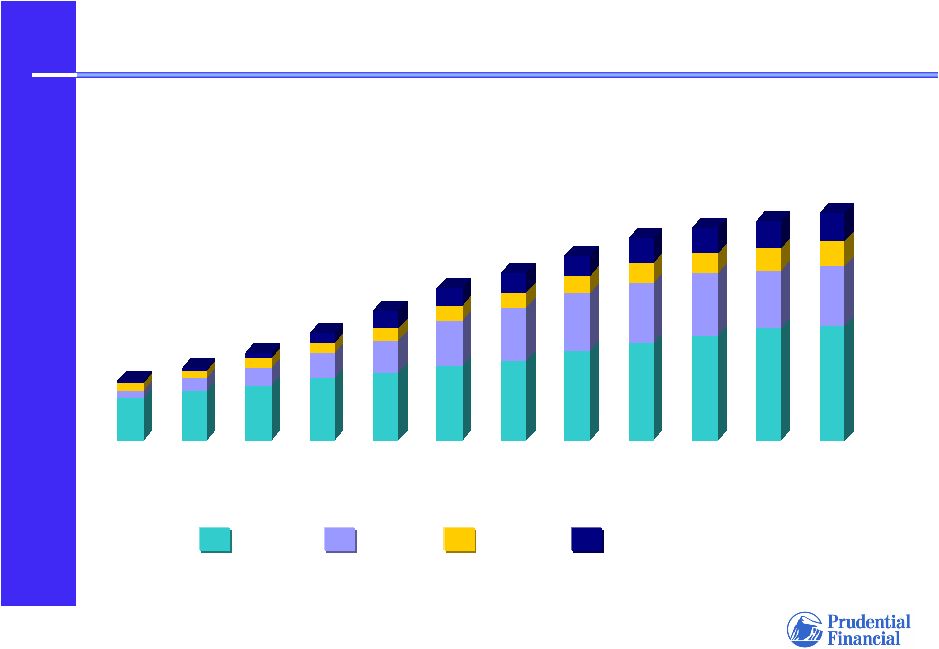 25 Investor Day 12.04.07 1997 1999 2000 2001 2002 2003 1,603 1,908 2,332 2,813 3,416 4,026 4,432 2004 2005 4,910 2006 5,316 Korea Taiwan Japan All other countries 1) At end of period 1998 1996 5,627 5,828 Life Planners (1) 3Q2007 6,038 |
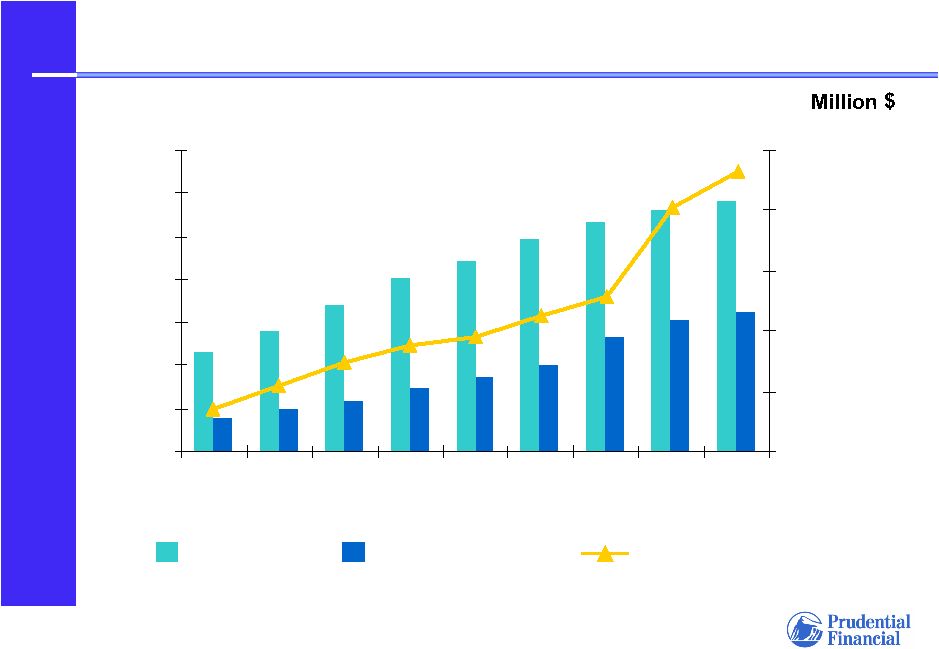 26 Investor Day 12.04.07 Growth in the Life Planner Business 1) Before-tax, GAAP exchange rate basis Units Life Planners Policies in force (000) Adjusted operating income (1) 0 1,000 2,000 3,000 4,000 5,000 6,000 7,000 1998 1999 2000 2001 2002 2003 2004 2005 2006 $- $200 $400 $600 $800 $1,000 |
 27 Investor Day 12.04.07 Gibraltar Life: “Prudentialized” Traditional Model Japanese Life Insurance Company • Variable agent compensation • Life Planner training principles adapted to traditional field force • Emphasize protection products • Introduce products targeted to customer base • Maintain and cultivate strong affinity group relationships • Develop third party distribution for selected products |
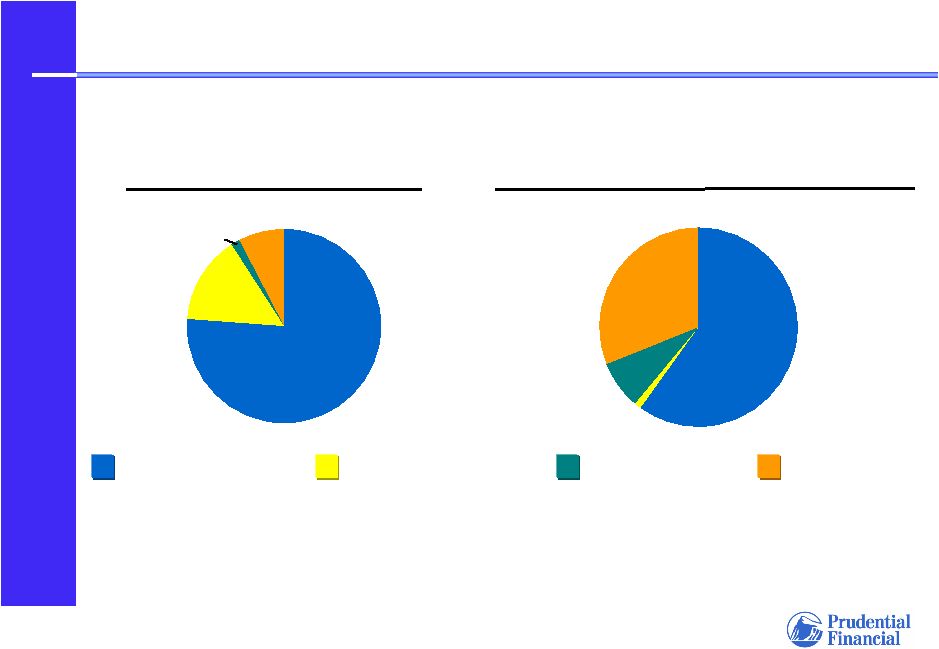 28 Investor Day 12.04.07 Gibraltar Life: Retirement Market Products Complement Core Protection Portfolio 60% 1% 8% 31% 8% 1% 76% 15% Yen-based protection products (2) In-force Annualized Premium as of September 30, 2007 (1) New Business Annualized Premium nine months ended September 30, 2007 (1) Yen-based savings and retirement income products (3) U.S. dollar-based life insurance 1) Includes single premium business at 10% 2) Primarily whole life and term 3) Primarily endowment U.S. dollar fixed annuities |
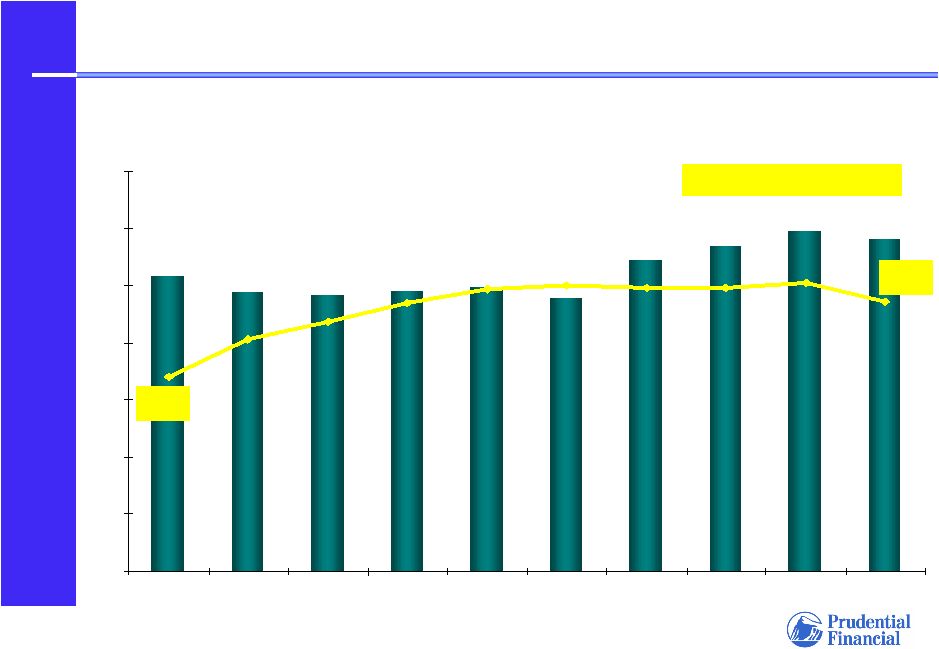 29 Investor Day 12.04.07 0 1,000 2,000 3,000 4,000 5,000 6,000 7,000 Dec-02 Jun-03 Dec-03 Jun-04 Dec-04 Jun-05 Dec-05 Jun-06 Dec-06 Jun-07 Gibraltar Life – Growing Distribution, Maintaining High Persistency 90% 94% 13 Month Persistency Ratio Number of Life Advisors |
 30 Investor Day 12.04.07 Market Developments Drive Growth Opportunities • Lifetime relationships with clients support sales through life cycle • Gibraltar’s association relationships: strong market access • U.S. dollar retirement income and fixed annuity products offer attractive value proposition, favorable returns for Prudential • Growing demand for retirement products with aging customer bases • Emphasis on protection insurance targeted to income replacement: higher income means greater need • Japan enjoys longest post- World War II economic recovery (since 2002) • Selected Gibraltar products adaptable for postal distribution • Needs-based selling continues as competitive advantage for protection products • Privatization of Japanese “Kampo” postal life insurance • Formed major bank relationships; commenced bank distribution of selected products • Transferred approximately 70 Life Planners to Gibraltar, to contribute to bank channel expansion (1) • Japan regulation changes support bancassurance sales growth; alliances emerging Prudential Positioning Development Emerging/Developing Markets Complement Long Term Prospects 1) Through September 30, 2007 |
 31 International Division International Division John Hanrahan Chief Financial Officer International Insurance and Investments John Hanrahan Chief Financial Officer International Insurance and Investments |
 32 Investor Day 12.04.07 Prudential International Insurance Sustainable Financial Performance • High ROE products generate substantial excess capital • Capital management opportunities enhance overall returns • Duration lengthening supported by long-term nature of liabilities contributes to returns • U.S. dollar investing: natural hedge for Prudential, enhanced portfolio returns • Strong persistency drives revenue growth • Margins earned throughout in-force period • Business growth increases scale benefits • Favorable mortality margins drive strong returns Investment Portfolio Strategies Capital Management Needs-Based Selling Emphasis on Protection Products |
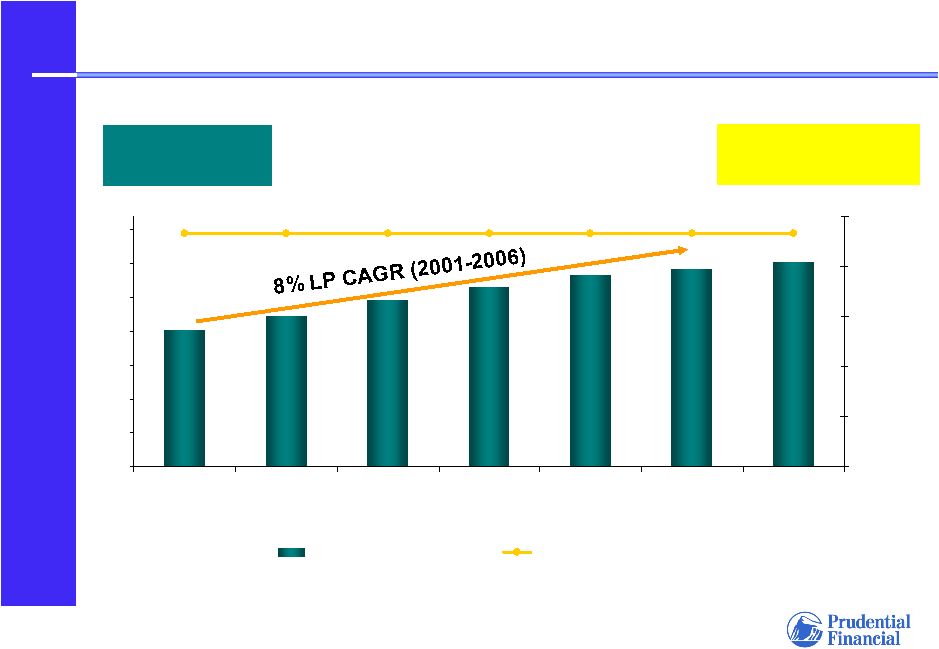 33 Investor Day 12.04.07 93% 93% 93% 93% 93% 93% 93% - 1,000 2,000 3,000 4,000 5,000 6,000 7,000 2001 2002 2003 2004 2005 2006 3Q2007 0% 20% 40% 60% 80% 100% # of Life Planners 13 Month Persistency Disciplined Life Planner Growth Continued Strong Persistency Number of Number of Life Planners Life Planners 13 Month Persistency Ratio |
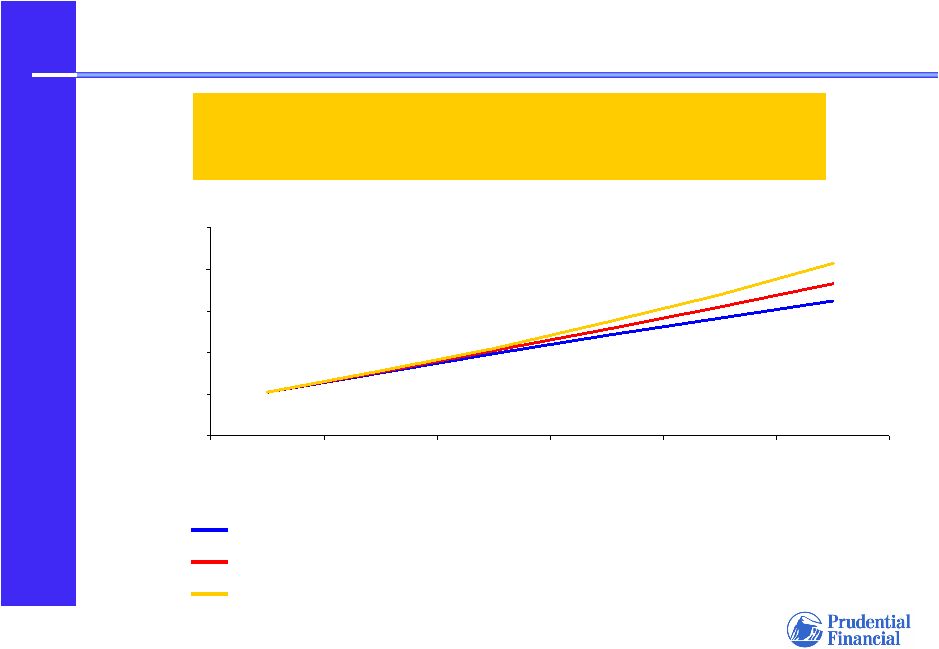 34 Investor Day 12.04.07 Life Planner Business Established Sales Force and Excellent Persistency Drive Baseline Growth Illustration assuming current policy persistency and Life Planner productivity, and
No Life Planner count increase 5% annual Life Planner count increase 10% annual Life Planner count increase (Not a forecast) Years 4,000 5,000 6,000 7,000 8,000 9,000 0 1 2 3 4 5 Revenues ($ millions) |
 35 Investor Day 12.04.07 Prudential International Insurance Capital Management Opportunities • Inter-company reinsurance arrangements • Inter-company loans • Dividends • Gibraltar subordinated debt repayment • Acquisition and expansion funding • Purchase of parent company debt |
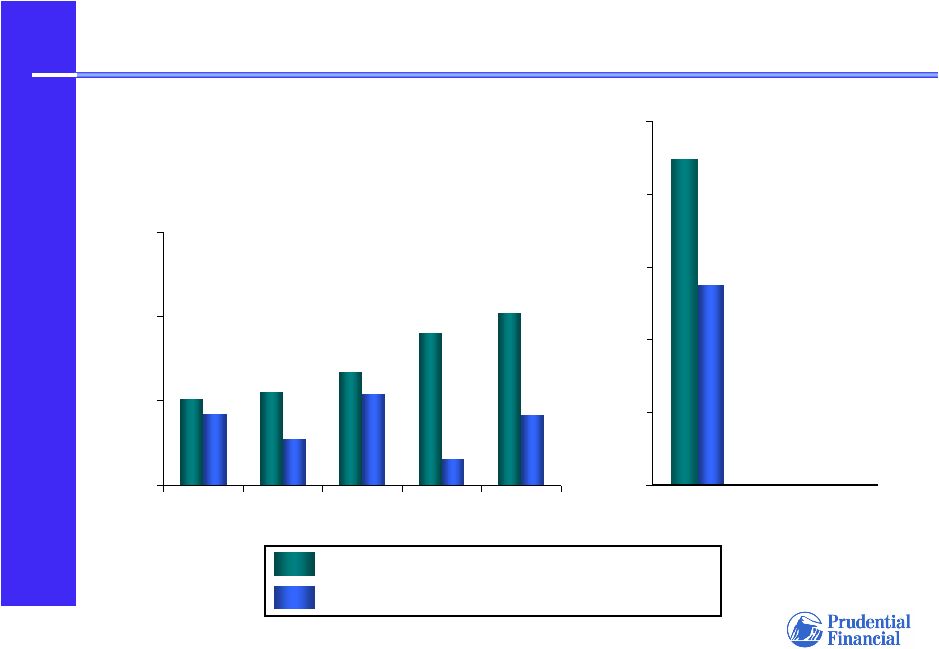 36 Investor Day 12.04.07 $0 $1,000 $2,000 $3,000 $4,000 $5,000 Prudential International Insurance Capital Redeployment $- $500 $1,000 $1,500 2002 2003 2004 2005 2006 $millions Cumulative 2002 – 9/30/07 504 419 551 273 669 541 897 151 1,016 414 4,478 2,760 After-Tax Adjusted Operating Income Capital Redeployment |
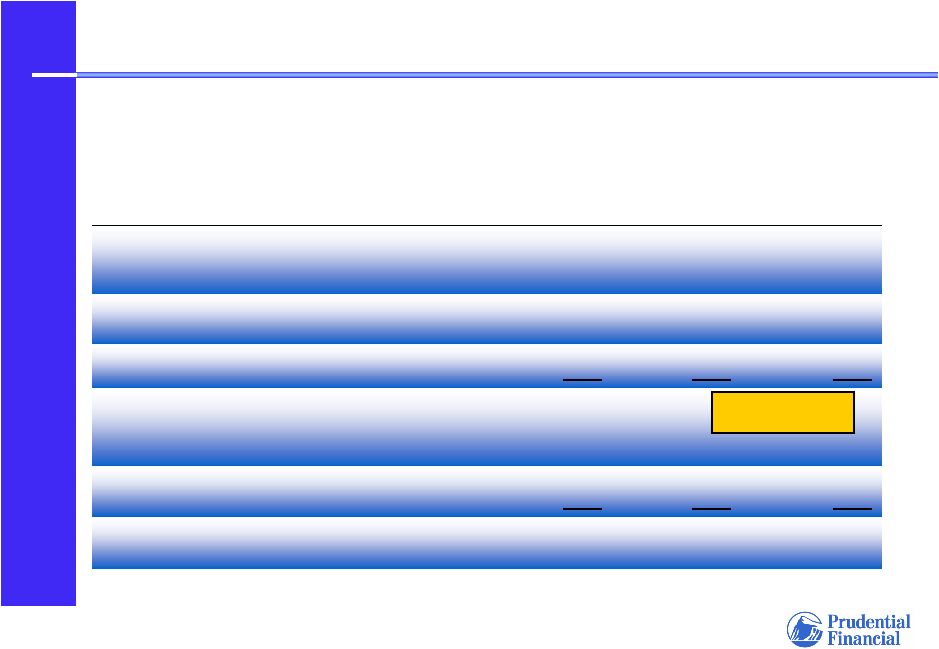 37 Investor Day 12.04.07 International Division Financial Performance 1) Based on annualized after-tax adjusted operating income $ 736 $ 930 $ 808 Life Planner businesses $ 1,410 $1,566 $1,416 International Division 219 143 106 International Investments 1,191 455 Nine months ended September 30, 2007 $1,423 493 2006 2005 ($millions) $1,310 International Insurance 502 Gibraltar Life Adjusted operating income before tax: Year ended December 31, 23.2% ROE (1) |
 38 Prudential’s U. S. Businesses Growing and Protecting Wealth in the Domestic Market Prudential’s U. S. Businesses Growing and Protecting Wealth in the Domestic Market John Strangfeld Vice Chairman Prudential Financial, Inc. John Strangfeld Vice Chairman Prudential Financial, Inc. |
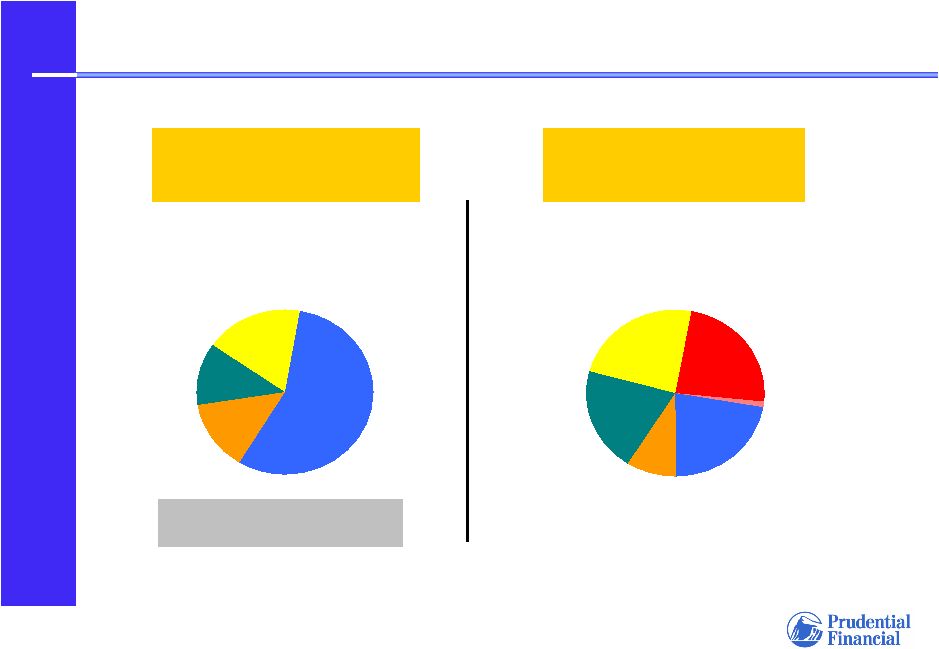 39 Investor Day 12.04.07 2002 AOI $783 million (2) 1) Insurance and Investment Divisions of Financial Services Businesses 2) Before income taxes 2002 – 2006 U.S. Business Mix (1) 2006 AOI $2,488 million (2) Individual Annuities –5% Financial Advisory –11% Individual Life 55% Group Insurance 20% Retirement 18% Individual Life 22% Retirement 20% Asset Management 23% 9% Asset Management 24% Individual
Annuities 24% Financial Advisory 1% Group Insurance |
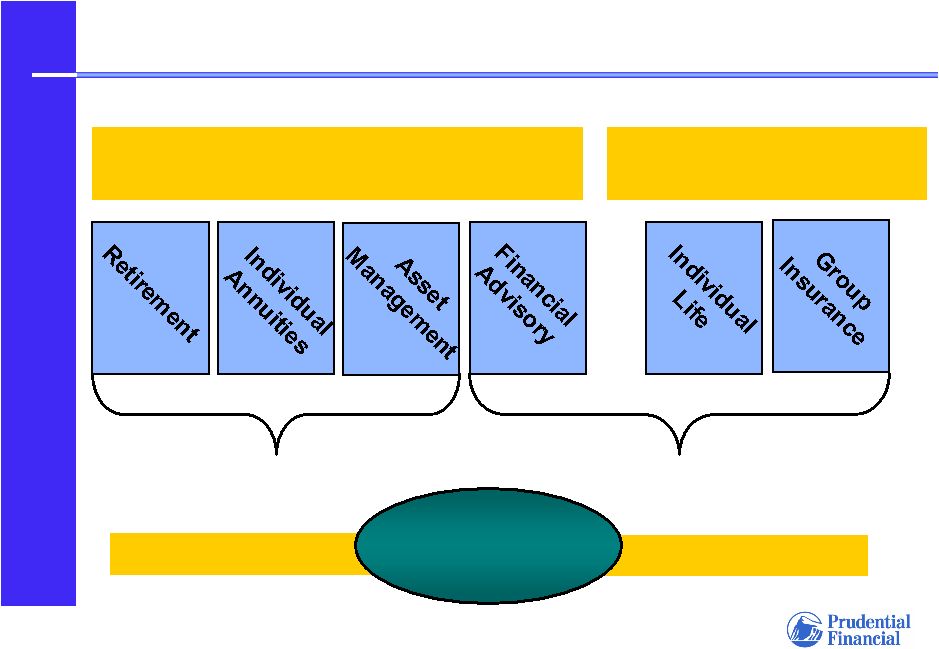 40 Investor Day 12.04.07 Domestic Business Portfolio (1) Growing Wealth 2006 AOI $1,715 million (2) Protecting Wealth 2006 AOI $773 million (2) 68%
32%
AOI AOI Contribution Contribution Favorable Growth Prospects Earnings/Cash Flow Contributors 1) Insurance and Investment Divisions of Financial Services Businesses 2) Before income taxes |
 41 Investor Day 12.04.07 Financial Advisory • Combination of Private Client Group with Wachovia July 1, 2003 • 62% Wachovia, 38% Prudential • Combined business created one of the top 5 brokerage firms in the U.S. (1) • Segment operating results represent 19.4% ROE (2) • Wachovia acquires A.G. Edwards in 2007; Prudential exercised “look-back” option 1) Based on client assets of $532.1 billion as of March 31, 2003 2) Based on annualized after-tax adjusted operating income contribution for the
nine months ended September 30, 2007 |
 42 Investor Day 12.04.07 Wachovia JV Look-Back Option Significant Upside Opportunities, Strong Downside Protection • Prudential’s ownership is diluted during two-year look-back period while business integration proceeds • After two years, Prudential can: – Restore ownership up to 38% level, at today’s price; or – Retain diluted investment stake going forward ; or – Put ownership position to Wachovia at today’s price • Prudential will retain its option to put its investment at fair market value commencing on July 1, 2008 |
 43 Investor Day 12.04.07 Domestic Protection Businesses • Maintain market position: #2 in Group Life (1) • Focus on returns: case selection; appropriate pricing • Generate strong cash flows • Optional life purchases contribute to growth prospects Group Insurance • Focus on returns through capital management, cost- effective distribution • Expanded third party distribution is growth opportunity • Deliver stable earnings and strong cash flows • Mature, low-growth industry • Overcapacity • Commodity products Individual Life Prudential Strategies Protection Marketplace 1) Based on A.M. Best ranking of statutory premiums for the year ended December 31,
2006 |
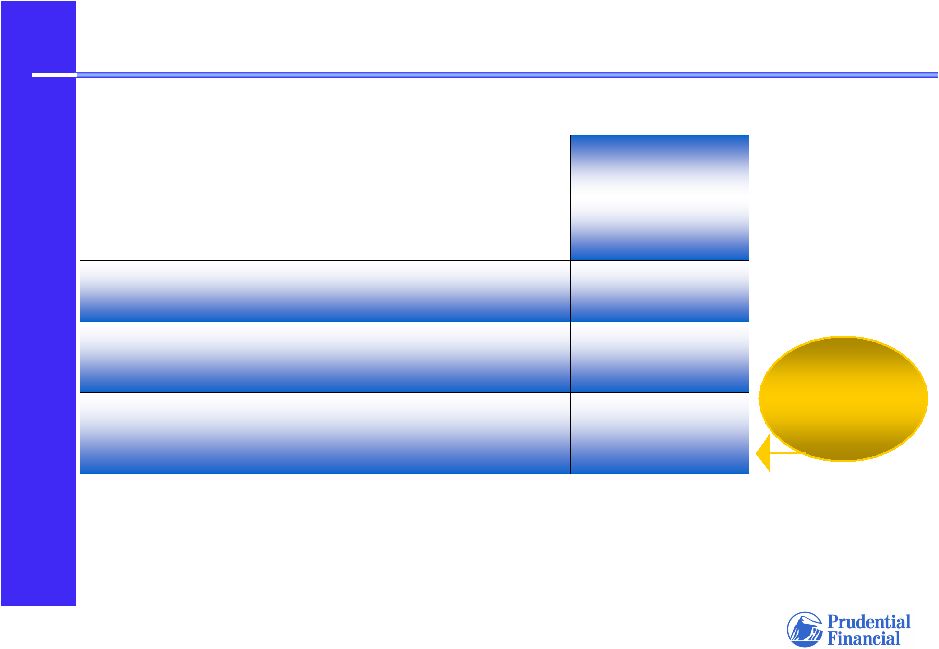 44 Investor Day 12.04.07 Individual Life ROE 1) In millions 2) Average attributed equity for the period; in billions 3) Based on annualized after-tax adjusted operating income giving effect to the direct equity adjustment 4) For the three years ended December 31, 2006 22.1 % Return on equity (3) $ 2.3 Equity (2) $ 489 Pre-tax adjusted operating income (1) Nine months ended September 30, 2007 Three-year average ROE (4) 16.1% |
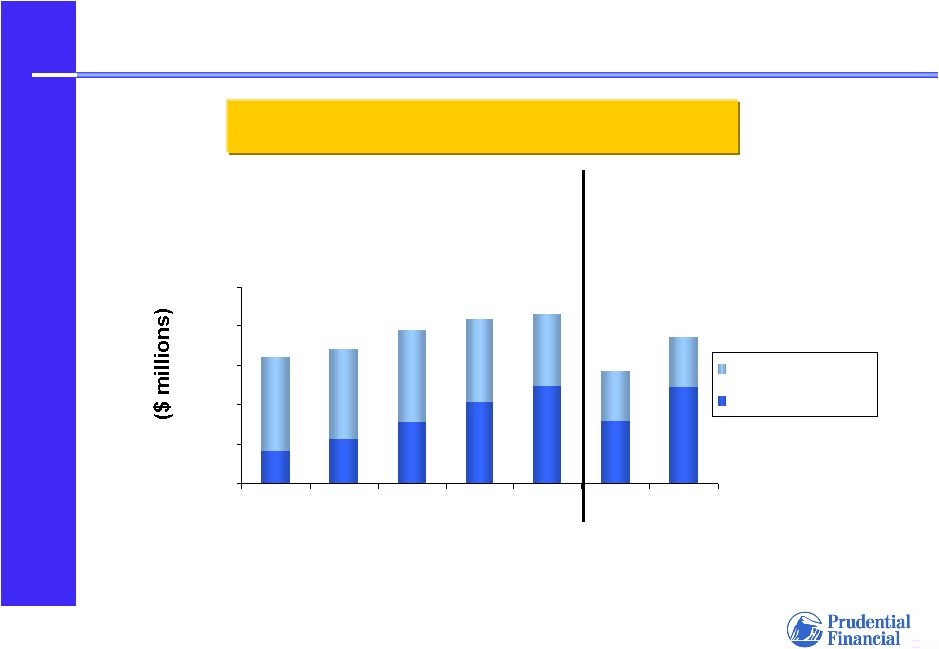 45 Investor Day 12.04.07 Individual Life Sales 1) Scheduled premiums from new sales on an annualized basis and first year excess premiums
and deposits on a cash-received basis, excluding COLI Sales by distribution channel (1) $320 $341 $391 $419 $430 $287 $372 Nine Months ended 9/30/06 Nine Months ended 9/30/07 2006 2005 2004 2003 2002 $0 $100 $200 $300 $400 $500 Prudential Agents Third Party |
 46 Investor Day 12.04.07 Group Insurance • Primarily group life business • Controlled growth – focus on margins • High persistency of quality business • Voluntary life opportunity • Return on equity of 16.6% (1) 1) Based on annualized after-tax adjusted operating income for the nine months ended
September 30, 2007 |
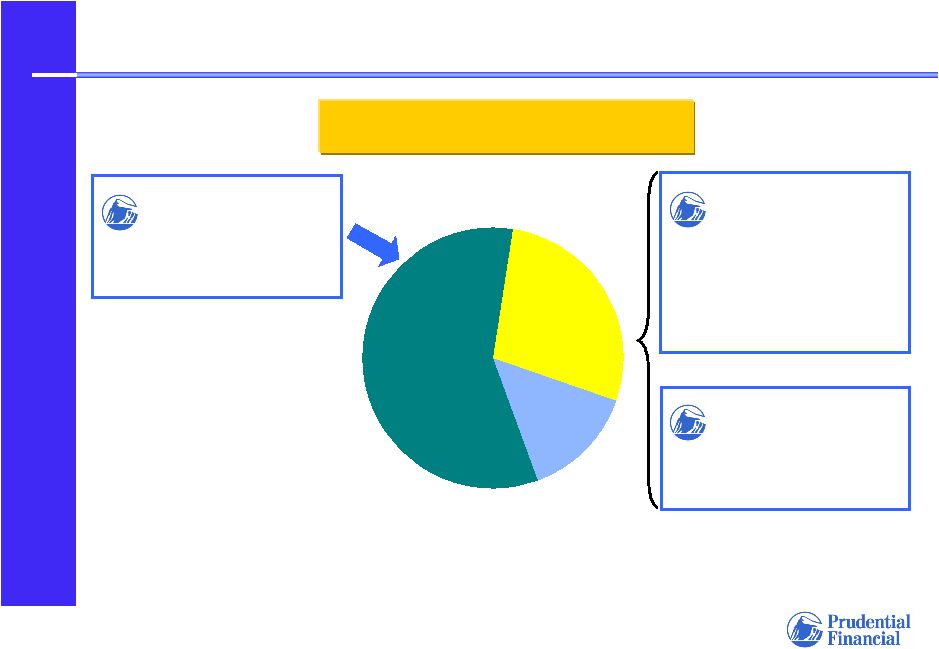 47 Investor Day 12.04.07 U.S. Retirement Market Prudential’s Key Domestic Growth Opportunity $23 Trillion Market (1) Personal Savings $13.5T Employer Controlled (DB) $6.4T Employer Sponsored (DC) $3.3T Prudential Investment Management • $430 billion AUM (2) • Top 10 DB Asset manager (3) Prudential Retirement • $157 billion account values (2) Prudential Annuities • $85 billion account values (2) 1) As of December 31, 2006 according to the Flow of Fund Accounts of the United States
(September 2007), the Investment Company Institute, and internal
calculations 2) As of September 30, 2007 3) As of December 31, 2006 according to Pensions & Investments (May 2007) |
 48 Investor Day 12.04.07 Retirement Market Trends Drive Prudential’s Growth Opportunities • Platforms, scale, business integration skills support attractive acquisitions • Industry consolidation continues • Asset management, risk management, and product skills support development of innovative solutions • Legislation and accounting changes encourage employers to transfer pension risk • A leader in Total Retirement Services • Employers seek to outsource retirement benefit programs • Implementing “auto-pilot” features and lifetime income products • Efforts to make DC plans more like DB plans • Unique standing: Market leading annuity and full service retirement provider • Risk management, product design skills and innovation culture support development of income products and features • Individuals increasingly responsible for their own retirement security • Aging baby boomers need to convert assets into income but want continued control, flexibility, upside potential Prudential Positioning Market Dynamic |
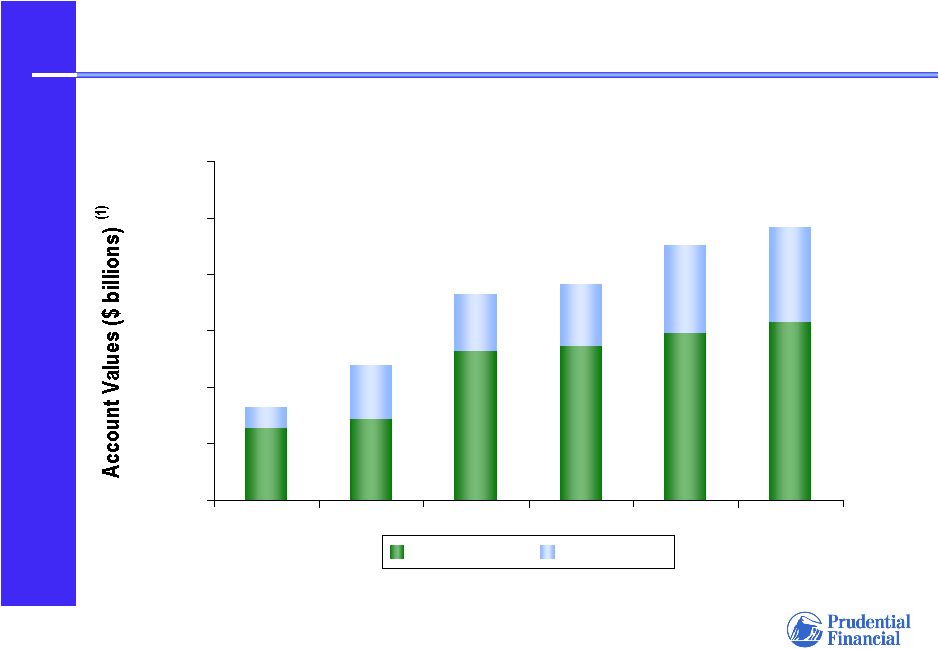 49 Investor Day 12.04.07 Retirement and Annuities A Leading Provider in a Growing Market $0 $50 $100 $150 $200 $250 $300 Retirement Annuities 12/31/02 12/31/03 12/31/04 12/31/05 12/31/06 1) Includes acquired businesses from dates of acquisitions $226 $191 $183 $120 $82 9/30/2007 $242 |
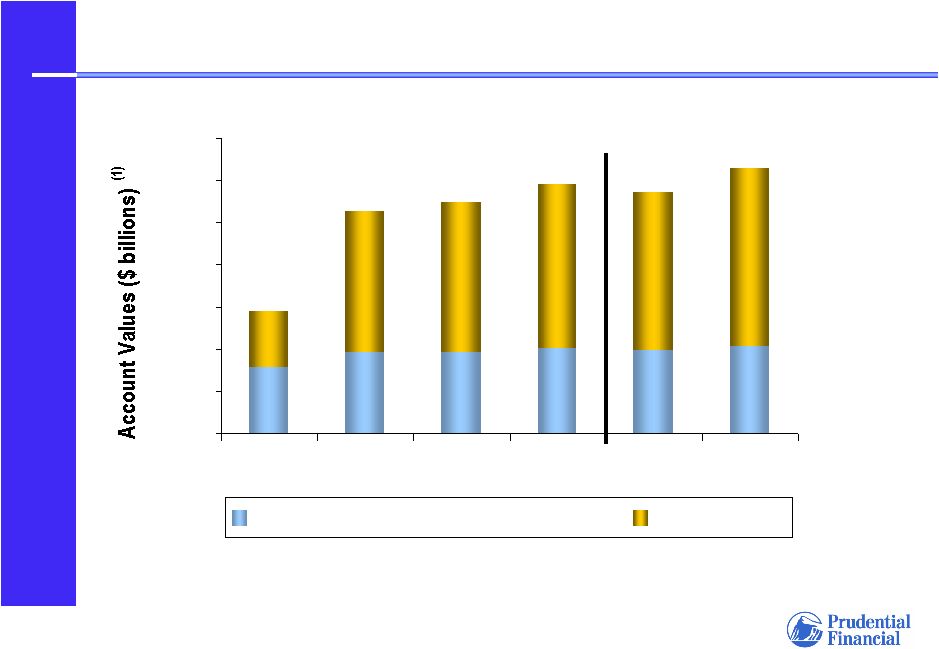 50 Investor Day 12.04.07 Prudential Retirement Emphasis on Full Service Retirement 1) Includes business acquired from CIGNA from April 1, 2004 acquisition date $157 $143 $148 $136 $132 $72 $0 $25 $50 $75 $100 $125 $150 $175 12/31/03 12/31/04 12/31/05 12/31/06 09/30/06 09/30/07 Institutional Investment Products Full Service |
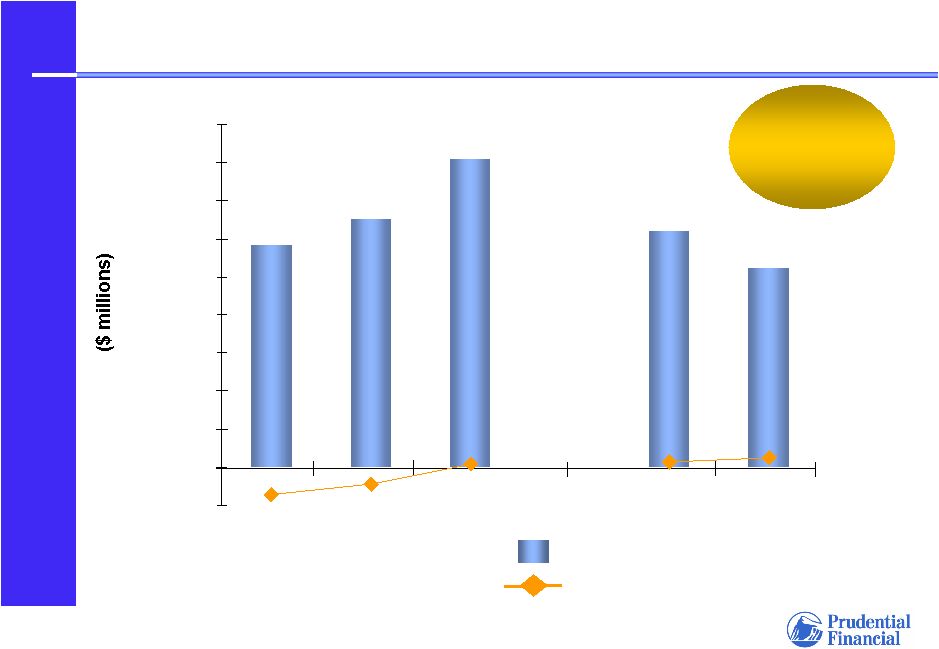 51 Investor Day 12.04.07 Full Service Retirement Asset Flows -$2,000 $0 $2,000 $4,000 $6,000 $8,000 $10,000 $12,000 $14,000 $16,000 $18,000 Deposits and Sales Net Flows 1) For the nine months ended September 30, 2007 97% plan persistency (1) 2004 2005 2006 Nine months ended 9/30/06 Nine months ended 9/30/07 |
 52 Investor Day 12.04.07 Emphasis on Mid/Large Case and Tax Exempt Markets 938,000 1,589,000 Participants (2) $ 35,300 $ 67,100 Account Values (1) (2) Specialized consultants - Fee based consultants - Commission based advisors - Third party administrators - Direct Distribution Channels Primary Products Tax Exempt Market Corporate Markets - DC plans - DB plans - Total Retirement Services - Non-qualified plans - Investment only products 1) In millions 2) As of September 30, 2007; excludes $3.2 billion retail account values for approximately
54,400 participants Emphasis on mid/large case market |
 53 Investor Day 12.04.07 A Leader In Total Retirement Services • Recordkeeping • Participant communications • Actuarial services • Compliance • Investment products and services DC Plan DC Plan Non- qualified Plan Non- qualified Plan Integrated Solution for Plan Sponsors 1) As of September 30, 2007 TRS Account Values: $39 billion (1) DB Plan DB Plan |
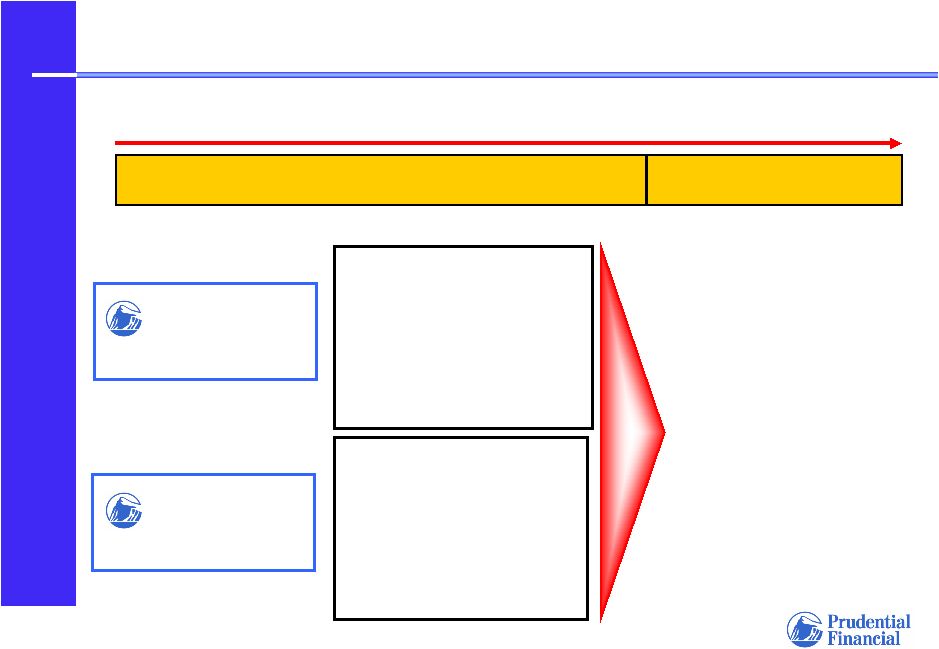 54 Investor Day 12.04.07 Retirement Solutions Lifetime Relationship Opportunities • Variable annuities feature professional asset allocation • Guaranteed minimum accumulation and death benefits • DC plan investment options; Lifecycle funds; “Goal Maker” asset allocation • Stable value products offer principal guarantee Age 20 yrs 30 yrs
40 yrs 50 yrs 60 yrs 65+ Accumulation Income Prudential Annuities Prudential Retirement • Lifetime Five • Spousal Lifetime Five • HD Lifetime Five • Income Flex • Rollover platform |
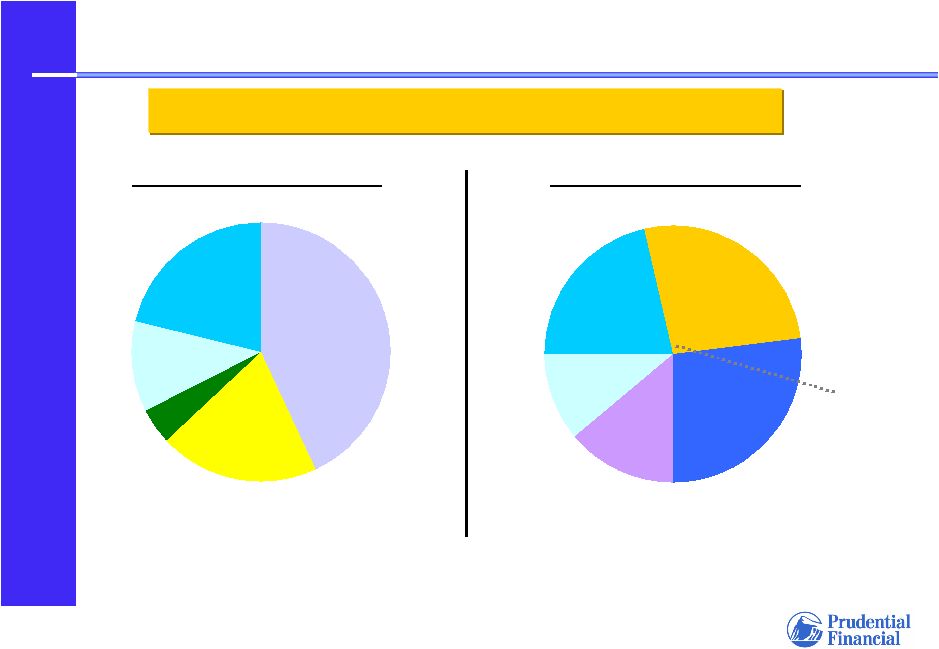 55 Investor Day 12.04.07 43% 21% 11% 5% 20% 27% 27% 21% 11% 14% AUM by Asset Type AUM by Client Type Equity Real Estate Institutional Customers General account Retail customers CB Total AUM $637 billion (1) (1) 1) As of September 30, 2007 International Fixed Income Non- proprietary insurance, annuity & other Non- proprietary insurance, annuity & other International Assets Under Management Significant Scale and Breadth |
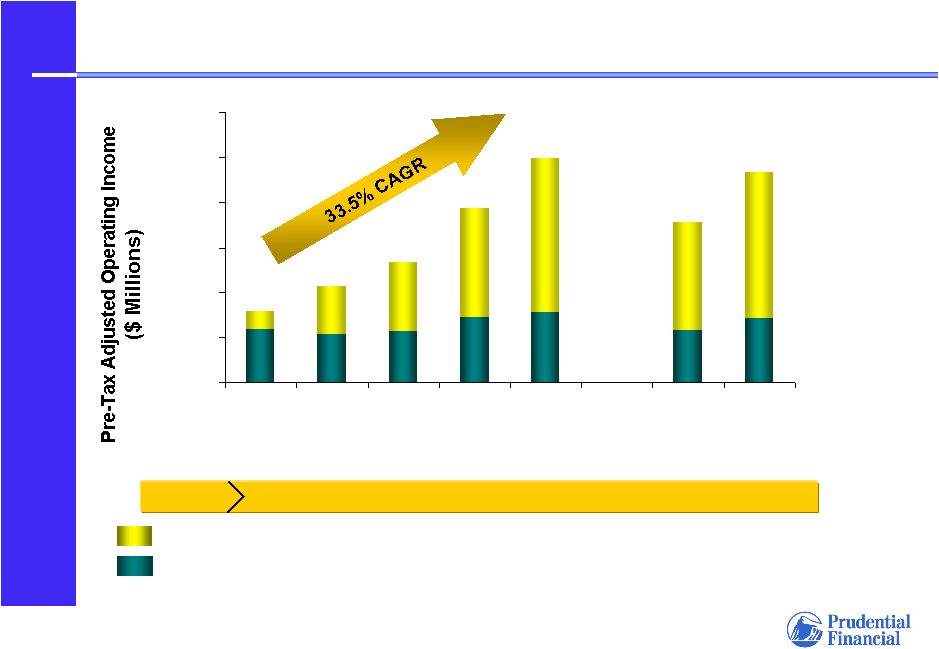 56 Investor Day 12.04.07 0 500 1,000 1,500 2,000 2,500 3,000 2002 2003 2004 2005 2006 Nine Months ended 9/30/06 Nine Months ended 9/30/07 Domestic Businesses: Financial Performance (1) 1) Insurance and Investment Divisions of Financial Services Businesses 2) Based on after-tax adjusted operating income giving effect to the direct equity adjustment; annualized for interim periods $1,075 $783 $1,342 $1,934 $2,488 $1,778 $2,341 Growing wealth: Individual Annuities, Retirement, Asset Management, Financial
Advisory Protecting wealth: Individual Life, Group Insurance ROE (2) 7.4% 8.6%
9.8% 12.5% 15.5% 15.0% 18.1% |
 57 Asset Management Asset Management Bernard Winograd President Prudential Investment Management Bernard Winograd President Prudential Investment Management |
 58 Investor Day 12.04.07 Asset Management Commercial Business and Competitive Advantage Robust institutional business enhances capabilities, attracts talented managers Market leading capabilities: private placement fixed income, commercial mortgages and real estate Prominent manager in pension market Low capital requirements: high ROE opportunity; strong available cash flows A Business, Not a “Department” A Source of Competitive Advantage Throughout The Firm Seasoned skills in multiple asset classes: risk diversification, enhanced returns Differentiated capabilities drive superior value proposition for stable value retirement products |
 59 Investor Day 12.04.07 Prudential Investment Management Competitive Advantages Scale Brand and Reputation Experience and Track Record Breadth and Depth of Capabilities Access to Capital and Co-investing Institutional Clients • $135 billion third party institutional AUM (1) • 16% AUM CAGR (2002 – 2006) Manager Continuity • 163 portfolio managers (1) • Average tenure 14 years 1) As of September 30, 2007; AUM excludes affiliated institutional assets under
management |
 60 Investor Day 12.04.07 Prudential Investment Management Business Overview $ 59 Quantitative Equity Quantitative Management Associates $ 85 Fundamental Equity Jennison Associates (2) $ 29 Real Estate Equity Prudential Real Estate Investors $ 29 $ 42 $ 186 AUM (1) Real Estate Debt Prudential Mortgage Capital Company Private Fixed Income Prudential Capital Group Public Fixed Income Prudential Fixed Income Investment Discipline Investment Manager 1) As of September 30, 2007; in billions 2) AUM includes $18.5 billion public fixed income securities managed by Jennison
Associates |
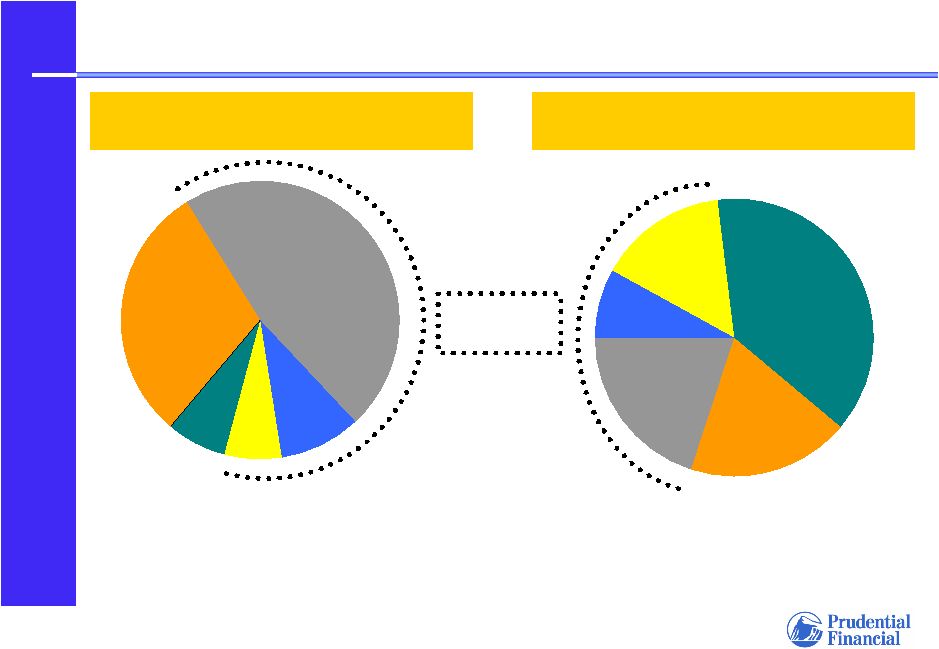 61 Investor Day 12.04.07 Public Equity 30% Public Fixed Income 47% 9% Private Fixed Income 7% Commercial Mortgages 7% Real Estate Assets Under Management $430 Billion (1) Public Equity (3) 19% Public Fixed Income 20% Private Fixed Income 8% Commercial Mortgages 15% Asset Management Revenue $1.6 Billion (2) Real Estate 38% 1) As of September 30, 2007 2) For the year ended December 31, 2006; excludes mutual fund distribution revenues
3) Includes revenue from management of public fixed income securities by Jennison
Associates Fixed Income Broad Asset Class Capabilities |
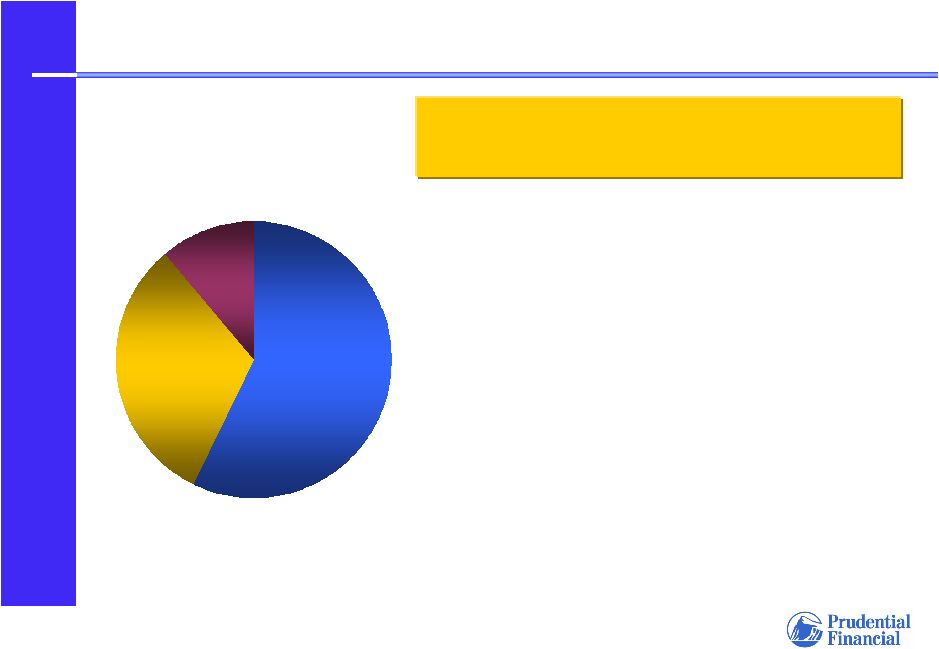 62 Investor Day 12.04.07 Public Fixed Income $186 Billion AUM (1) 1) As of September 30, 2007; excludes public fixed income securities managed by Jennison
Associates Retail 11% General Account 57% • Comprehensive product line offers traditional and alternative strategies • Corporates, Governments, Structured Products, Mortgages, Emerging Markets, Money Markets • Proprietary models for risk analysis and management • Managing Asset-Backed Securities since 1991 • Internal collateral evaluation and rating assignments Breadth of Capabilities Serves General Account and Third Parties Institutional 32% |
 63 Investor Day 12.04.07 Private Fixed Income $42 Billion AUM (1) 1) As of September 30, 2007 Private Placement Debt Market • Often well-suited to fund insurance liability cash flows • Terms and covenants offer investors protection from “event risks” • Attractive long-term capital source for middle market companies • Higher credit spreads or coupons relative to like-quality public securities Prudential Positioning • Prudential general account is preferred customer • Not a “price taker” – direct access to issuers allows negotiation of terms and covenants • “Reliable partner”: proprietary direct origination network built on relationships • Over 60 years experience; over 1,000 issuers (1) |
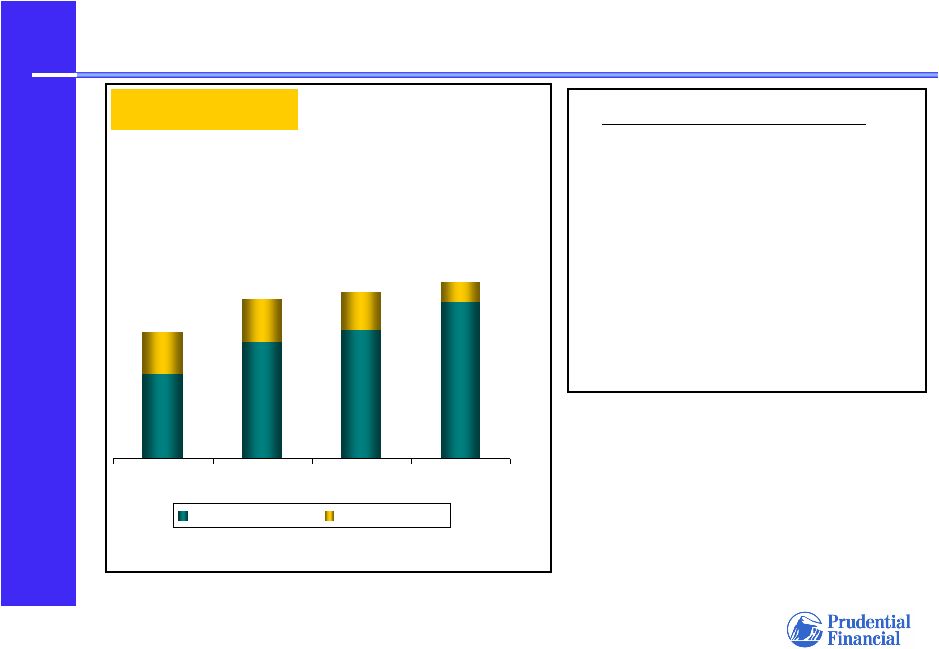 64 Investor Day 12.04.07 1) In billions 2) Source: SourceMedia – Private Placement Letter (September 24, 2007) Market Leader in Private Placement Debt Originations (1) Portfolio – 12/31/06 (1) (2) 1. Prudential $ 38.9 2. MetLife 30.8 3. NY Life 23.1 4. Principal Global 17.6 5. Sun Life 17.1 $5.3 $6.6 $6.9 $7.3 2004 2005 2006 YTD 3Q2007 General Account Non-Affiliates |
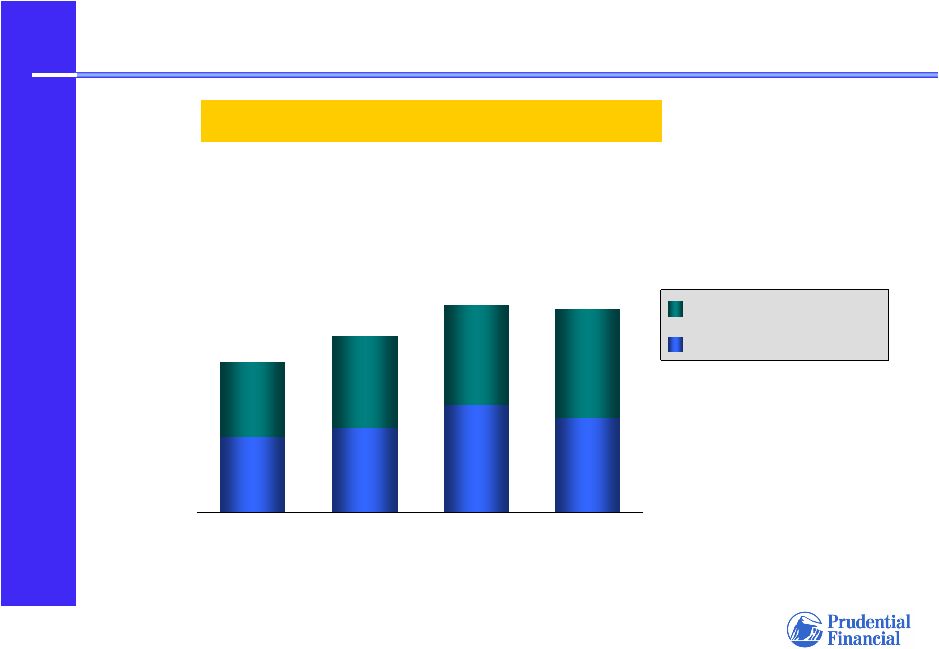 65 Investor Day 12.04.07 Non-Affiliates General Account $8.0 $9.4 $11.0 2004 2005 Originations (2) 2006 Commercial Mortgages $29 Billion AUM (1) 1) As of September 30, 2007 2) In billions $10.8 YTD 3Q2007 |
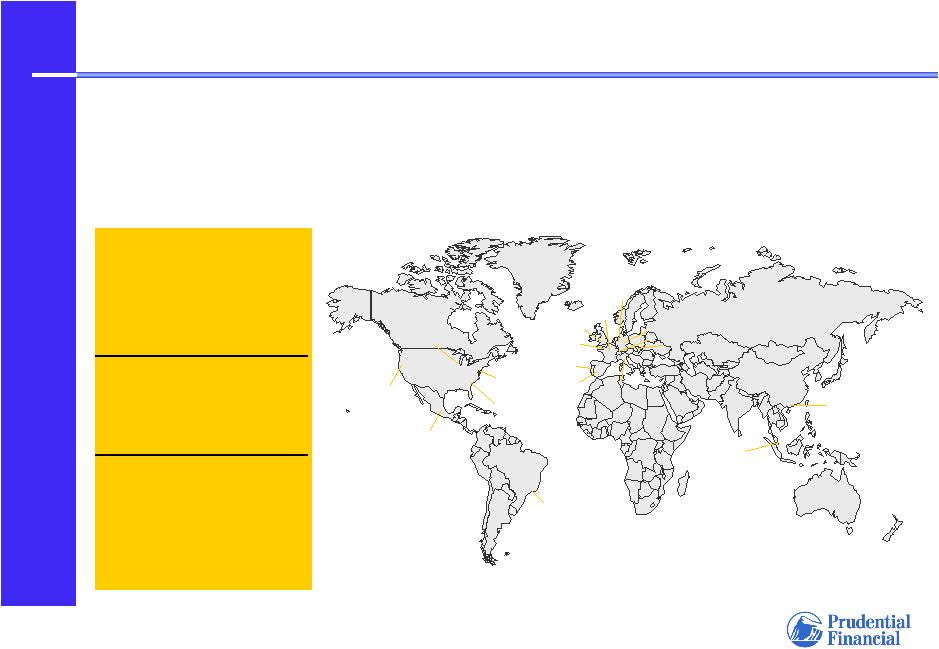 66 Investor Day 12.04.07 Global real estate investment manager, 18 offices worldwide (1) ; serving institutional investors since 1970 Approximately 190 investment professionals and 430 institutional clients (1) Prudential Real Estate Investors $29 Billion AUM (1) 1) As of September 30, 2007 Intermediary between pension funds and developers Opportunities for upside participation Benefits from strong recent market conditions Chicago Parsippany Atlanta San Francisco London Singapore Rio de Janeiro Amsterdam Munich Zurich Milan Madrid Lisbon Paris Mexico City Budapest Luxembourg Hong Kong |
 67 Investor Day 12.04.07 Public Equity Two Distinct Approaches • Approximately 150 Institutional clients (1) • Approximately 150 Institutional clients (1) • Decades of experience • Established 1969; acquired 1984 • Quantitative equity management • Fundamental equity management • $59 billion AUM (1) • $85 billion AUM (1) (2) 1) As of September 30, 2007 2) Includes $18.5 billion public fixed income securities |
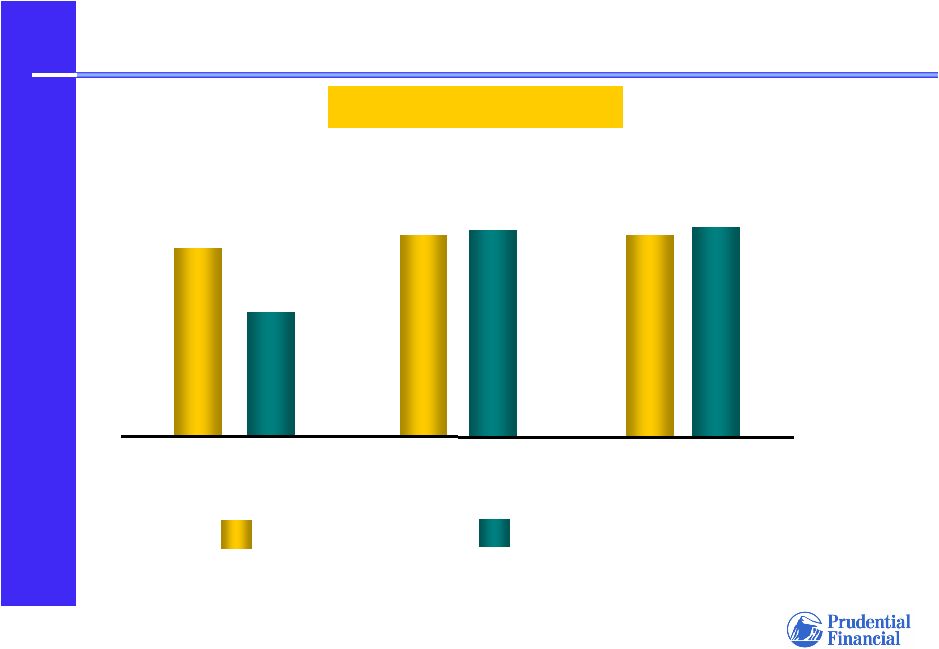 68 Investor Day 12.04.07 74% 54% 88% 93% 88% 95% 1 Year 3 Year 5 Year AUM = $170 Billion (1) September 2006 September 2007 1) As of September 30, 2007 Percentage of Third Party AUM At or Exceeding Benchmark |
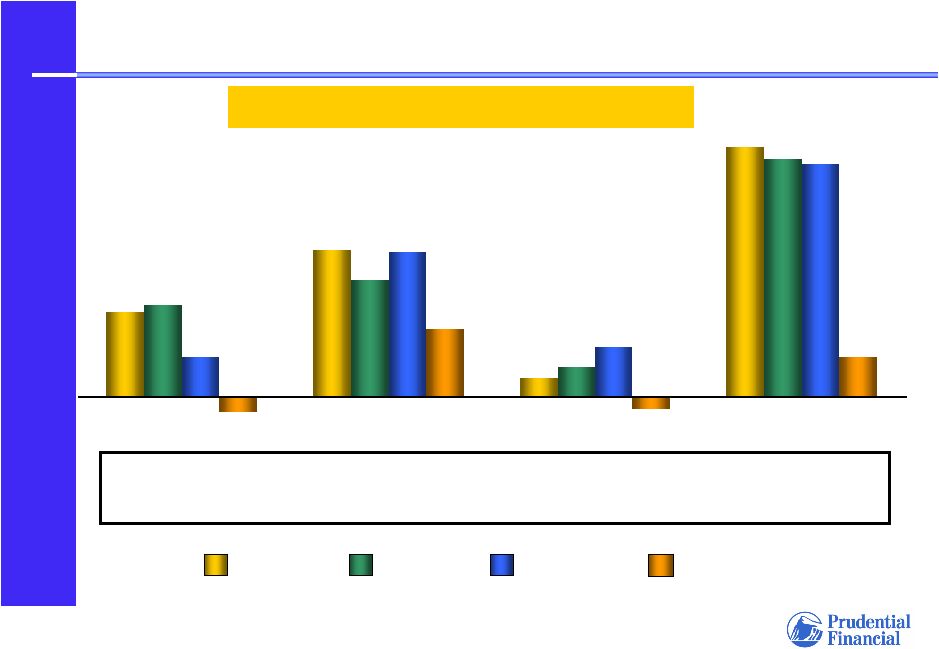 69 Investor Day 12.04.07 $6.8 $11.6 $0.9 $3.9 $5.4 $4.3 $1.4 $11.1 $2.3 $1.8 $6.7 $10.8 $1.8 ($0.6) $3.1 ($0.7) Equity Fixed Income Real Estate Total 2004 2005 2006 YTD3Q2007 Third Party Institutional Flows are the Best Indicator of Competitiveness Percent of Beginning of Period Assets (2) 13% 10% 4% 13% 9% 10% 7% 10% 13% 12% 9% 8% -1% 4% -3% 1% Institutional Net Flows ($Billions) (1) 1) Excludes money market funds and the effects of certain nonrecurring transfer and
disposition events. Includes assets transferred from the Retirement
segment. 2) Third party institutional net flows as a percentage of total institutional assets under
management. |
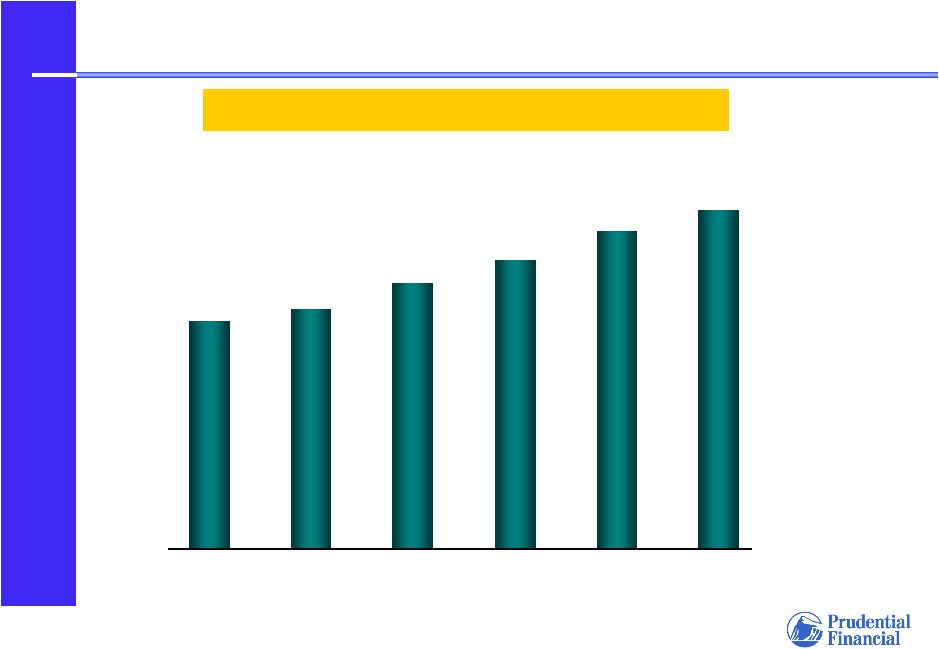 70 Investor Day 12.04.07 Prudential Investment Management $288 $304 $338 $367 $403 $430 Proprietary Assets Under Management 12/31/02 12/31/03 12/31/04 12/31/05 12/31/06 9/30/07 $ in Billions |
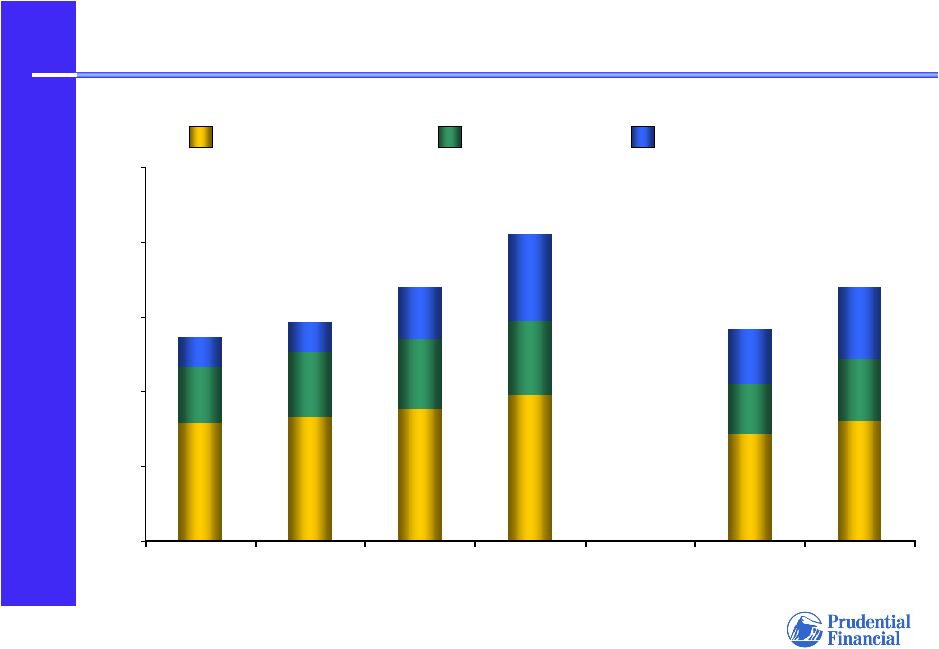 71 Investor Day 12.04.07 $0 $500 $1,000 $1,500 $2,000 $2,500 2003 2004 2005 2006 9 mos 2006 9 mos 2007 $ in Millions Asset Management Fees Asset Management Revenues Service, Distribution and Other Revenue Incentive, Transaction, Principal Investing and Capital Markets Revenue $1,360 $1,464 $1,696 $2,050 $1,692 $1,414 |
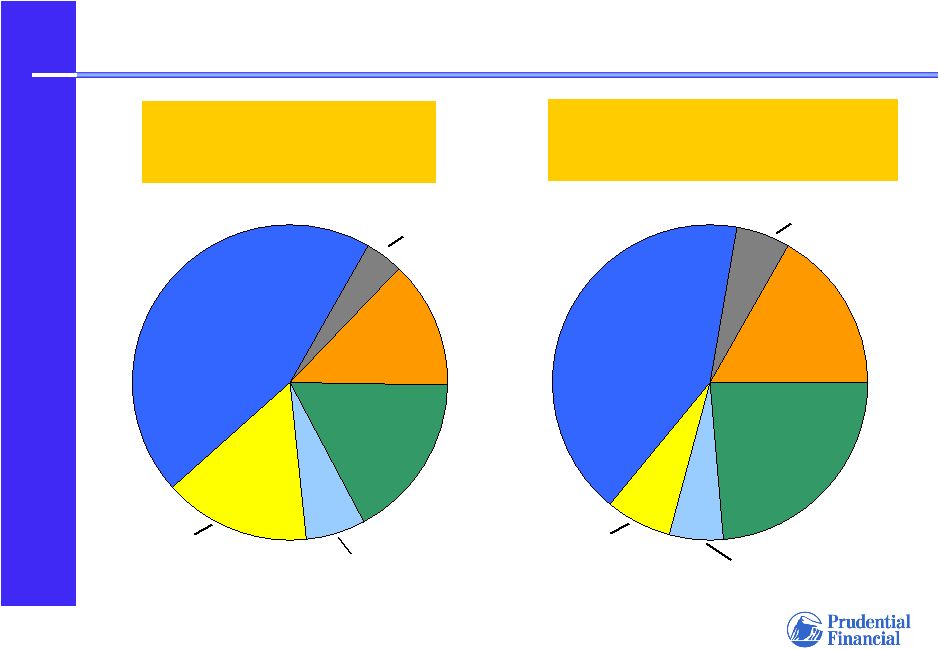 72 Investor Day 12.04.07 7% 17% 5% 42% 5% 24% Year Ended 12/31/06 $593 Million (1) Equity Public Fixed Income Prudential Capital Group Prudential Mortgage Capital Company Prudential Real Estate Investors Nine Months Ended 9/30/07 $493 Million (1) Prudential Investments (2) Asset Management Adjusted Operating Income by Business 1) Before income taxes 2) Mutual fund distribution 15% 13% 6% 45% 4% 17% Equity Prudential Capital Group Prudential Mortgage Capital Company Prudential Real Estate Investors Prudential Investments (2) Public Fixed Income |
 73 Investor Day 12.04.07 36% 33% 27% Return on equity (5) 1.3 1.3 1.2 Attributed equity (1) (4) 493 $ 430.2 Nine months ended September 30, 2007 593 $ 403.4 2006 2005 464 Pre-tax adjusted operating income (3) $ 367.4 Assets under management (1) (2) 1) In billions 2) At end of period 3) In millions 4) Average attributed equity for period 5) Based on after-tax adjusted operating income; annualized for interim period
Asset Management Financial Performance |
 74 Individual Annuities Individual Annuities David Odenath President Prudential Annuities David Odenath President Prudential Annuities |
 75 Investor Day 12.04.07 Variable Annuity Market Trends • Retirement income solutions drive sales • Continued customer interest in downside protection • Increased customer focus on locking in gains • Industry consolidation likely to increase as manufacturers require greater scale to compete |
 76 Investor Day 12.04.07 Prudential Annuities: Competitive Advantages in a Retirement-Focused Market • Proven product innovation capabilities • Sophisticated risk management and hedging • Scale • Strong branding • Broad, multi-channel distribution capabilities • Acquisition integration expertise |
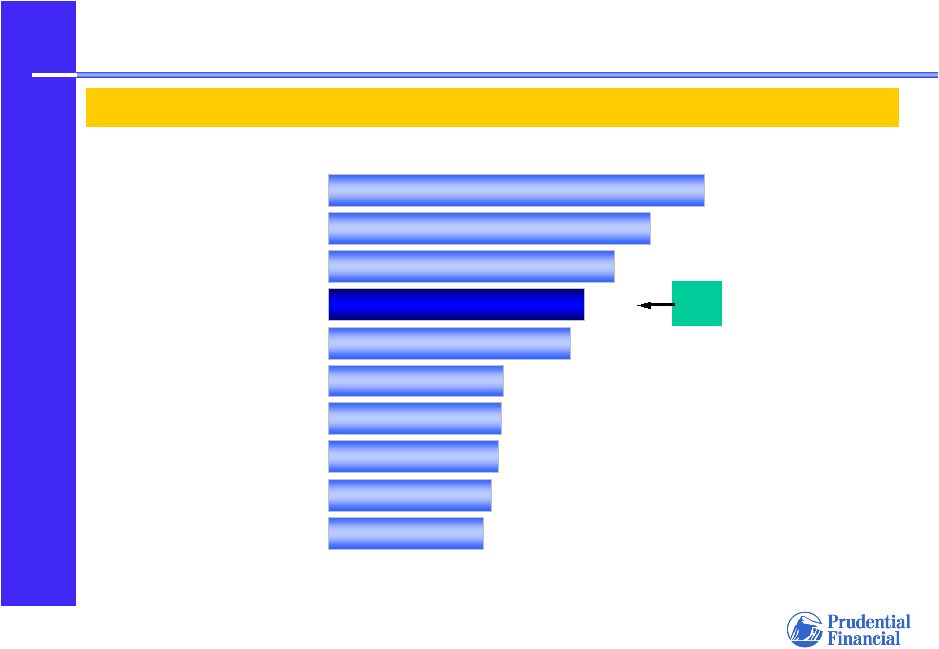 77 Investor Day 12.04.07 1) Source: VARDS 2Q07; Advisor-sold market excludes group/retirement plan
contracts Prudential Annuities is ranked #4 in advisor-sold VA account
values (1) ($ billions) #4 #4 111.9 95.9 85.1 76.2 72.0 52.0 51.5 50.8 48.5 46.0 Top 10 Variable Annuity Company Account Values Hartford Met Life AXA Equitable Prudential Lincoln National John Hancock Ameriprise Financial Pacific Life ING Nationwide |
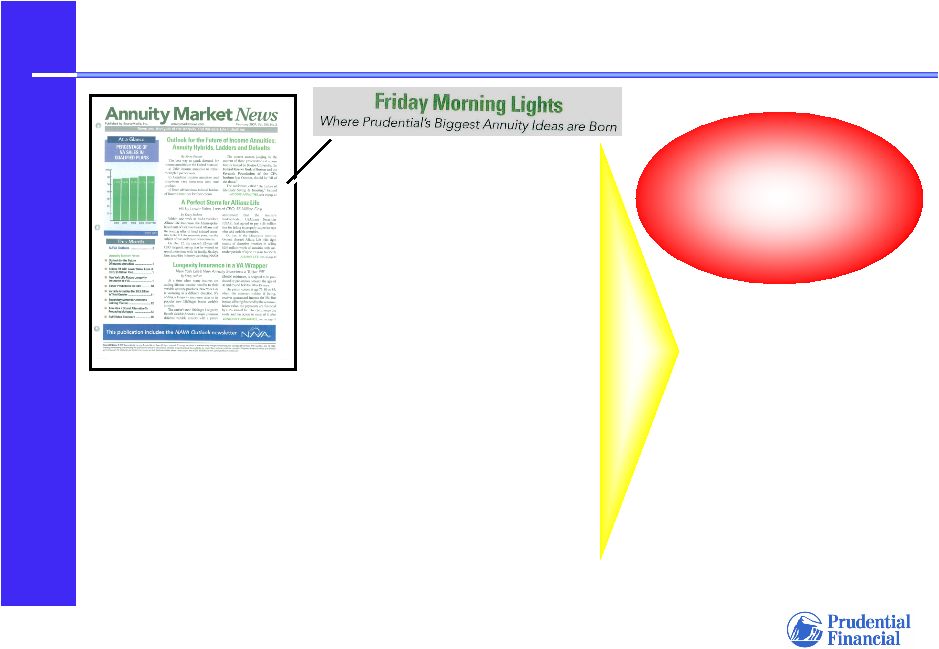 78 Investor Day 12.04.07 Prudential Annuities Innovation Team • Innovation: a proven strength • Informal weekly meetings, an 11-year tradition • Spirited discussion: leave your title at the door; have an open mind; be a subject matter expert • Listen to the marketplace • Lifetime Five • Spousal Lifetime Five • HD Lifetime Five • More to come… Attractive value propositions for retirement-focused customers © 2007 Annuity Market News and SourceMedia, Inc. All rights reserved.
|
 79 Investor Day 12.04.07 Awarded “Best Living Benefits” by Boomer Market Advisor Magazine for Third Consecutive Year • “HD Lifetime Five…the living benefit that best addresses the income and longevity issues clients face.” 2006 2006 2007 2007 2005 2005 Market-Leading Retirement Solutions |
 80 Investor Day 12.04.07 Active Management of Product Risks • • Innovative product design minimizes product/benefit risk while meeting customers’ needs • Strategic risk retention – Retain risks we are best suited to carry – Actively hedge risks where appropriate • Strong governance structure provides constant monitoring and oversight |
 81 Investor Day 12.04.07 Lower Risk Profile in Newest Benefits Reduces equity risk in severe market conditions Effectively self hedges much of the equity risk Systematically takes money “off the table” as market declines, preserving account value Daily Rebalancing by Individual Contract (“GRO”; HD-Lifetime Five) Reduces concentration risk Access to professionally managed, diversified investment options Required Asset Allocation Portfolios Reduces longevity risk Reduces cost of benefit Minimum Age Requirement Benefit to Benefit to Prudential Prudential Benefit to Benefit to Policyholder Policyholder Feature Feature • Attractive Value Proposition Attractive Value Proposition • • Minimizes Risk to Prudential Minimizes Risk to Prudential Living Benefit Living Benefit Product Design Product Design |
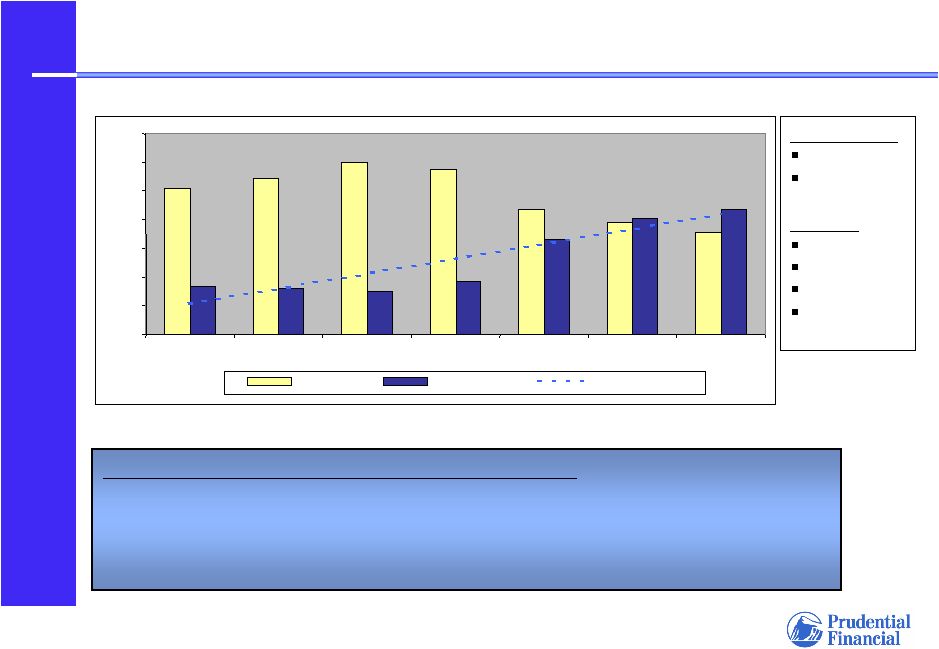 82 Investor Day 12.04.07 Excludes GMIB as election rate is de-minimus Risk Profile of HD-5 Compared to Lifetime Five • HD-5 has lower overall risk profile due to reduced tail exposure • Less hedge rebalancing required during volatile markets • Interest rate exposure more efficient to hedge – lower basis risk, better liquidity Self Hedged GRO HD-5 Hedged LT5 SLT5 GMWB Allstate GMAB Living Benefit Election Rates New Living Benefits Feature Self-Hedging 0% 10% 20% 30% 40% 50% 60% 70% 1Q06 2Q06 3Q06 4Q06 1Q07 2Q07 3Q07 Hedged Self Hedge Self Hedge Trend |
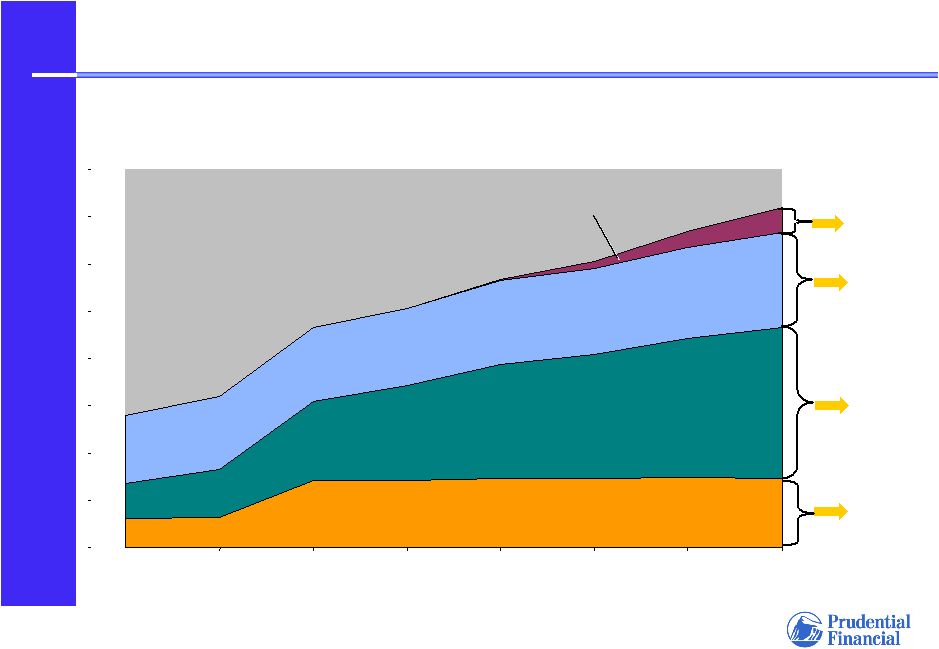 83 Investor Day 12.04.07 $5 $10 $15 $20 $25 $30 $35 $40 4Q05 1Q06 2Q06 3Q06 4Q06 1Q07 2Q07 3Q07 HD5 - 26% election rate (1) $2.6 Equity Risk Self Hedged $16.0 Fully Hedged LT5, GMWB, and GMAB - 40% election rate (1) $10.1 Equity and Int Rate Risk Self Hedged “GRO” - 15% election rate (1) $7.3 Retain Risk GMIB (2) Account Values ($ billions) Living Benefit Risk Management 1) For the nine months ended September 30, 2007 2) Includes Prudential and Allstate business; no significant recent sales $0 |
 84 Investor Day 12.04.07 Broad Multi-Channel Distribution Capabilities 203 358 607 $1,673 3Q:07 Sales (1) 226 257 466 $1,407 3Q:06 Sales (1) • Increase distribution through Allstate and Prudential bank relationships • Pursue new relationships on opportunistic basis 7% Banks • Expand distribution through Allstate and current relationships 13% Wirehouses • Continued focus on captive sales to maintain momentum • Ongoing focus on expanding distribution in Allstate channel 21% Insurance Agents • Maintain leadership position • Enhance distribution through existing relationships 59% Independent Financial Planners Strategy Percentage of 3Q:07 Sales Channel 1) In millions; all annuity products (variable and fixed) |
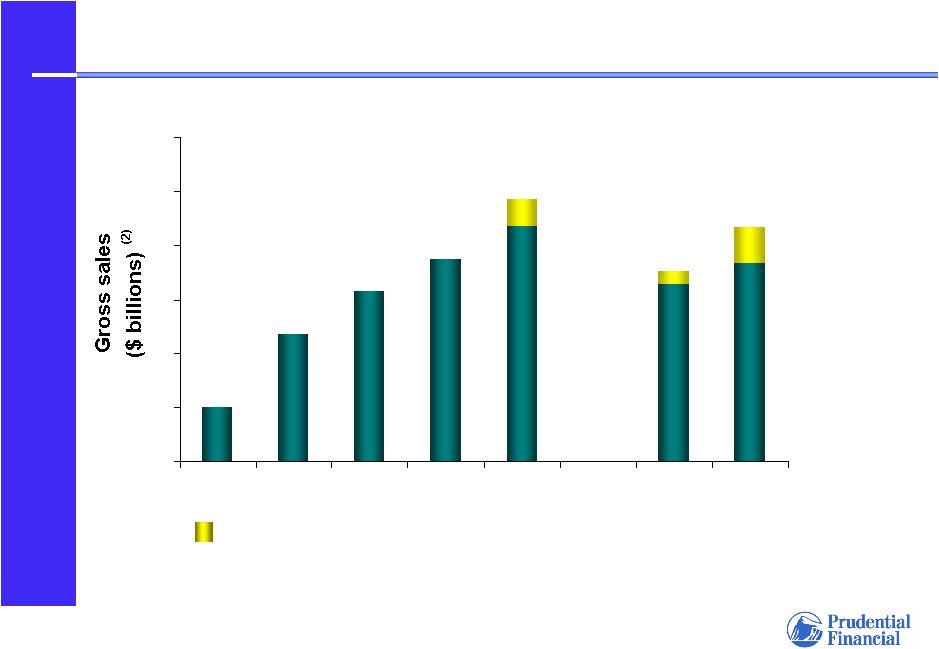 85 Investor Day 12.04.07 Products and Distribution Drive Sales Growth 0 2 4 6 8 10 12 2002 2003 2004 2005 2006 2006 2007 Year ended December 31 (1) Nine months ended September 30 (1) 1) Includes American Skandia from May 1, 2003 acquisition date and Allstate variable annuity
business from June 1, 2006 acquisition date 2) All annuity products (variable and fixed) Allstate Distribution $4.7 $2.0 $6.3 $7.5 $9.7 $7.0 $8.7 |
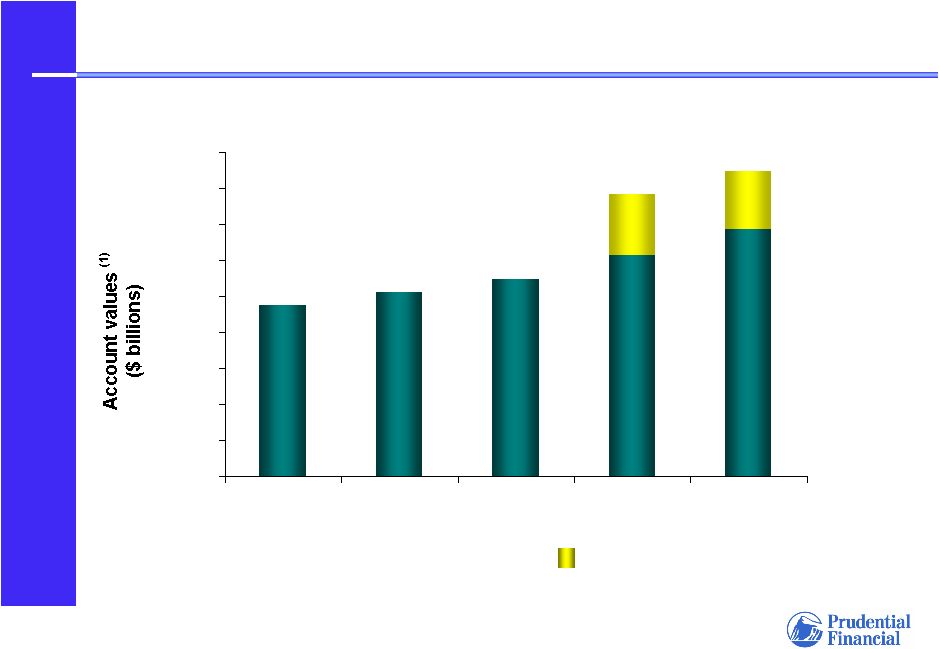 86 Investor Day 12.04.07 Sustained Account Value Growth 1) As of end of period; all annuity products (variable and fixed) $- $10 $20 $30 $40 $50 $60 $70 $80 $90 2003 2004 2005 2006 Sep-07 Allstate $47.5 $51.3 $54.8 $78.3 $84.7 |
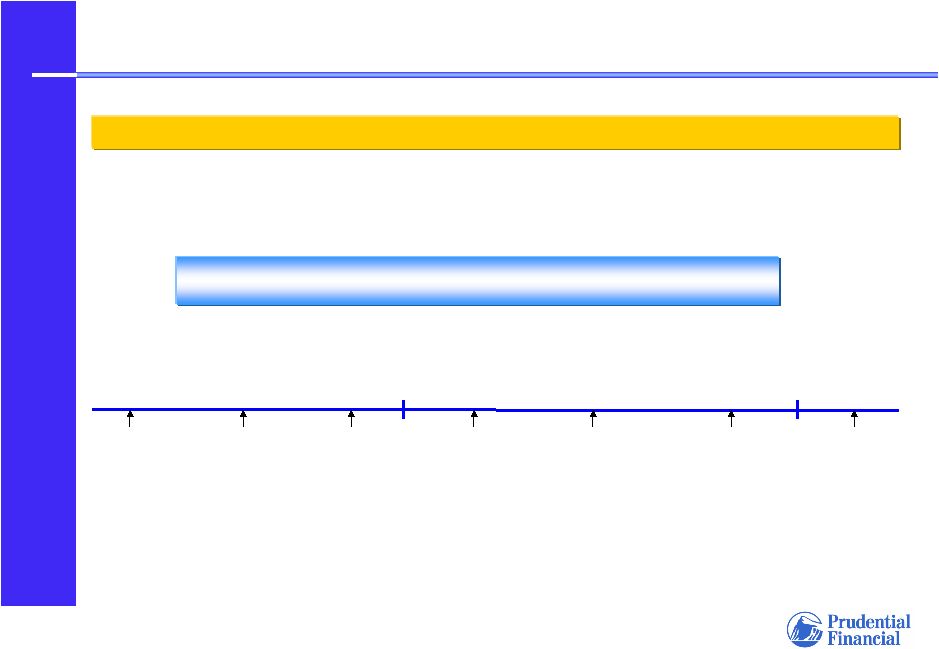 87 Investor Day 12.04.07 Allstate Variable Annuity Business Integration on Track Major Project Milestones 2006 2007 September February Closed Allstate transaction June 1 August Transition Service Agreement Period with Allstate Transition Service Agreement Period with Allstate July Launched Prudential products in Allstate proprietary channel Launched Prudential products in Morgan Stanley Launched Allstate-branded, Prudential- designed product in Bank Channel 2008 May Launched Prudential products in A.G. Edwards Se2 selected to integrate Allstate book and provide processing support Prudential to assume responsibility for administration of Allstate’s book of business January |
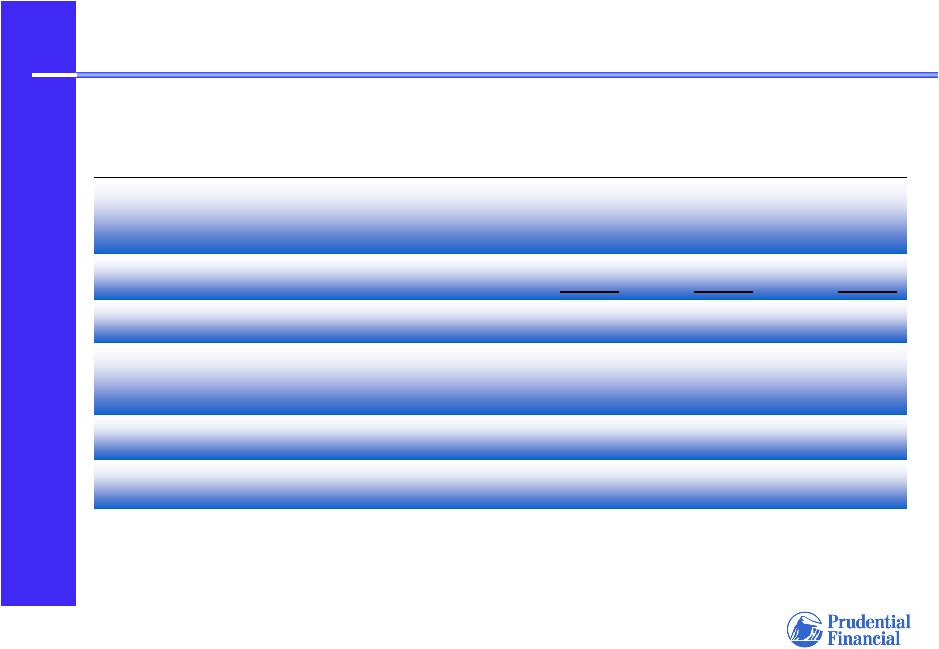 88 Investor Day 12.04.07 3,546 3,748 3,991 Fixed annuities 18.2% 18.2% 17.9% Return on equity (5) $ 2.8 $2.3 $1.9 Attributed equity (4) 549 84,719 $ 81,173 Nine months ended September 30, 2007 586 78,303 $ 74,555 2006 2005 505 Pre-tax adjusted operating income (3) 54,769 Total $ 50,778 Account Values (2) Variable annuities 1) Includes results of Allstate variable annuity business from June 1, 2006 acquisition date 2) In millions; at end of period 3) In millions 4) In billions; average attributed equity for period 5) Based on after-tax adjusted operating income; annualized for interim period
Individual Annuities Financial Performance (1) |
 89 Financial Position and Outlook Financial Position and Outlook Rich Carbone Chief Financial Officer Rich Carbone Chief Financial Officer |
 90 Investor Day 12.04.07 Financial Review and Outlook • Strong capital position; significant financial flexibility • Disciplined investment portfolio risk selection and management • Financial outlook for 2008 |
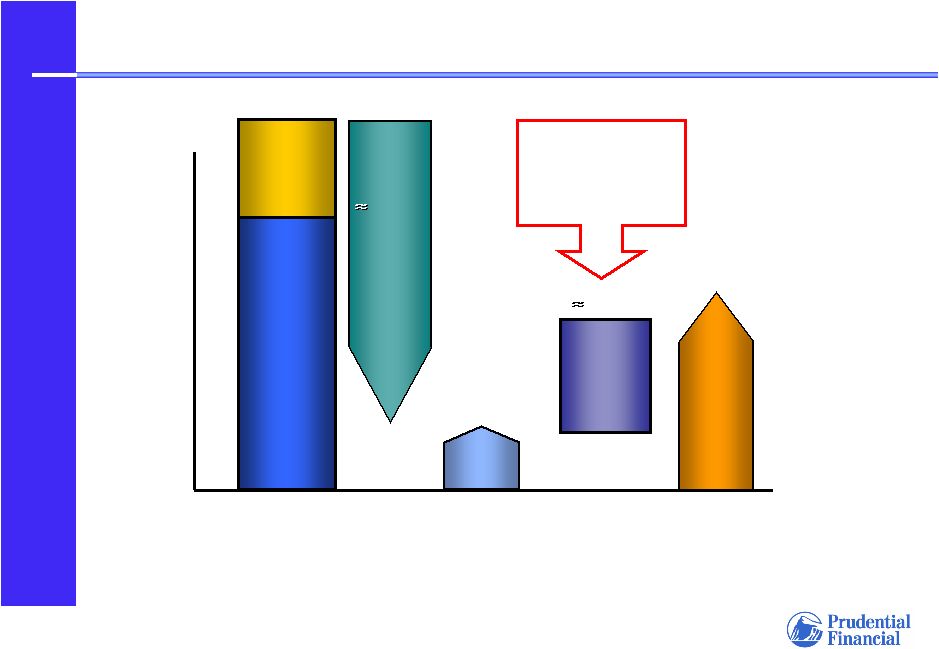 91 Investor Day 12.04.07 “Available Capital” Capacity $7 - $8 Billion (1) Over $2.5 bn $7 – $8 bn 1) As of September 30, 2007 2) Attributed equity of Financial Services Businesses, excluding accumulated other
comprehensive income related to unrealized gains and losses on investments
and pension/postretirement benefits Outstanding Capital Required Capital “On Balance Sheet” Excess Capital Unused Capacity: Capital Debt, Hybrid Equity Securities Available Capital Capacity $26 bn $4 bn Capital Debt $22 bn Equity (2) $22 bn Equity (2) $23 bn $23 bn $5 bn Targeted Structure: 70% Equity, 30% Capital Debt and Hybrid Securities |
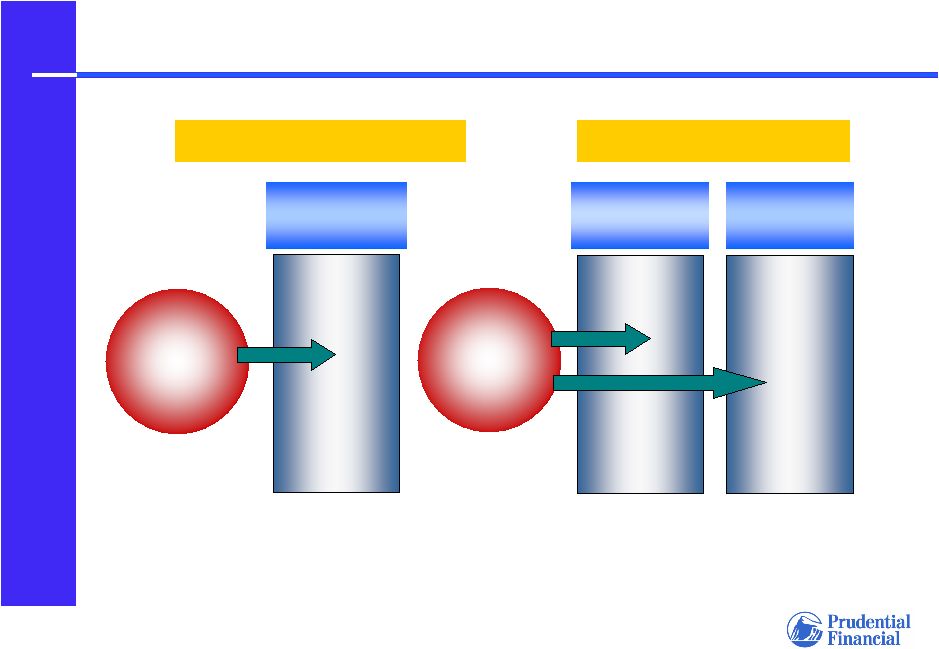 92 Investor Day 12.04.07 Insurance Operations are Overcapitalized “AA” Ratings Target 350 “AA” Ratings Target 700 - 800 Risk-Based Capital (1) Solvency Margins (2) Prudential Insurance Gibraltar Life Prudential of Japan 1) Based on U.S. statutory accounting 2) Based on Japanese statutory accounting |
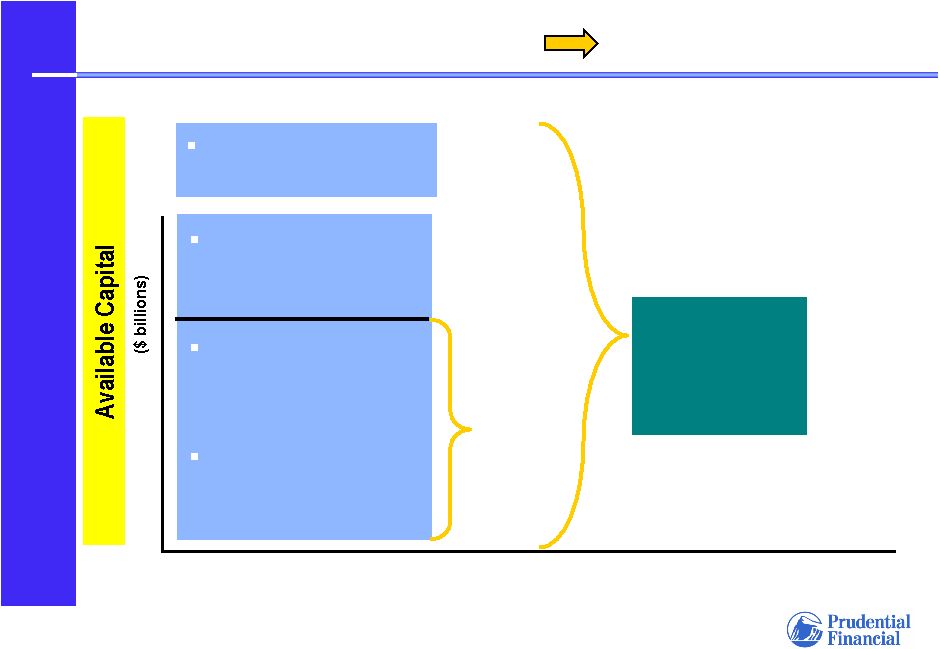 93 Investor Day 12.04.07 “Available Capital” Capacity Financial Flexibility 1) Assuming a capital structure of 70% common equity, 30% capital debt and hybrids
International Insurance excess capital Hybrid security and debt issuance capacity (1) Corporate & other excess capital Available for share repurchases Potentially available for attractive transactions September 30, 2007 Potential value of Wachovia JV “put” $7+ |
 94 Investor Day 12.04.07 Strong and Sustainable Ongoing Capital Generation • Focus on high ROE businesses with favorable growth prospects • Mature businesses: favorable returns, modest capital needs, strong cash flows |
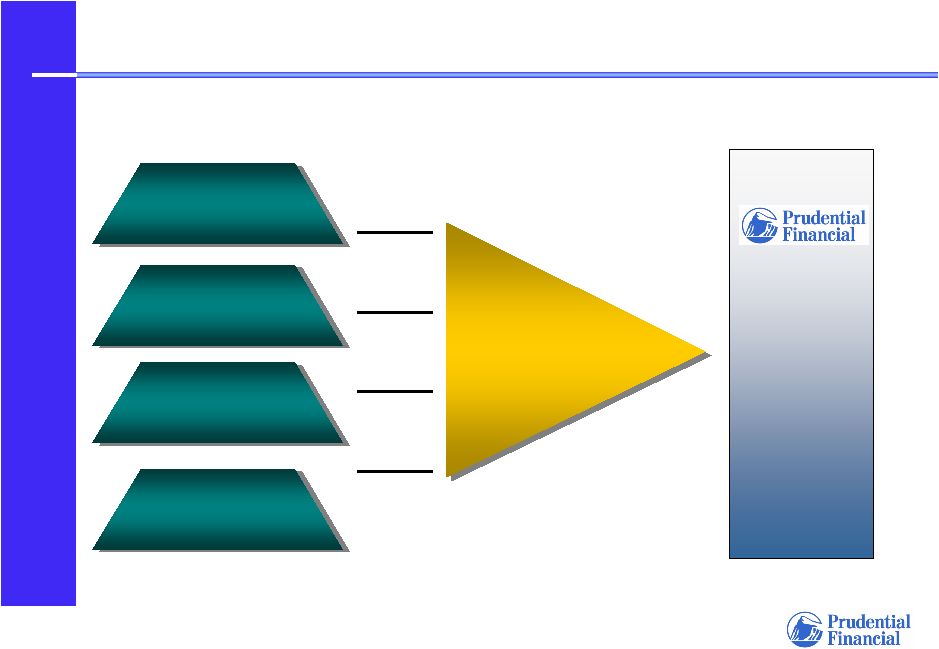 95 Investor Day 12.04.07 Diverse Sources of Cash Flow Domestic Insurance Companies Domestic Insurance Companies Asset Management Operations Asset Management Operations Wachovia Joint Venture Wachovia Joint Venture 2006 Dividends & Returns of Capital $3.2 billion International Operations International Operations |
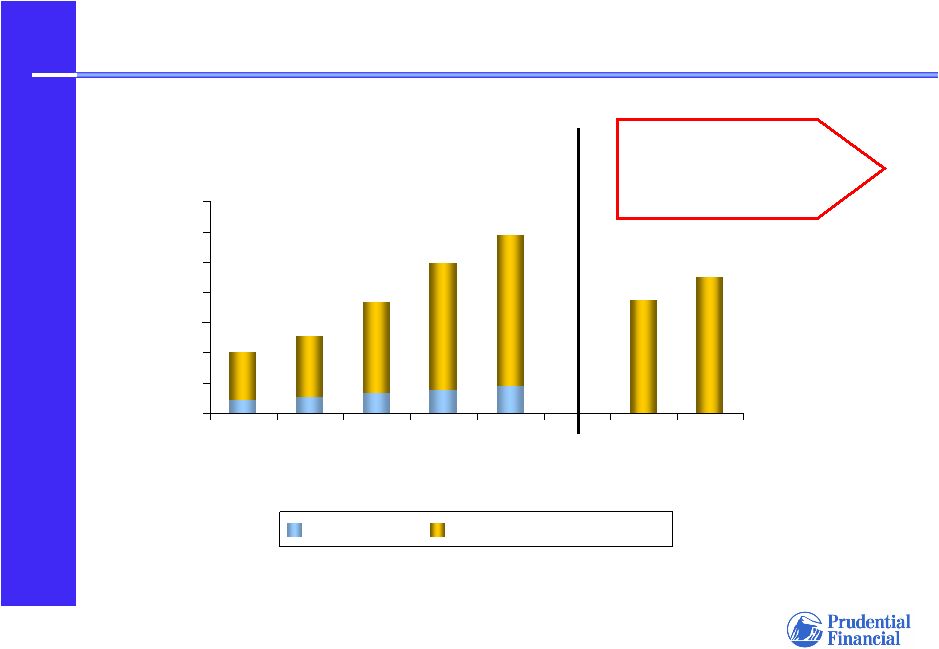 96 Investor Day 12.04.07 Capital Returned to Shareholders $0 $500 $1,000 $1,500 $2,000 $2,500 $3,000 $3,500 2002 2003 2004 2005 2006 9 Mos ended 9/30/06 9 Mos ended 9/30/07 Dividends Share Repurchases $1,026 $1,270 $1,831 $2,483 $2,953 $ millions $1,873 $2,250 $3.5 billion annual share repurchase authorization, effective 2008 |
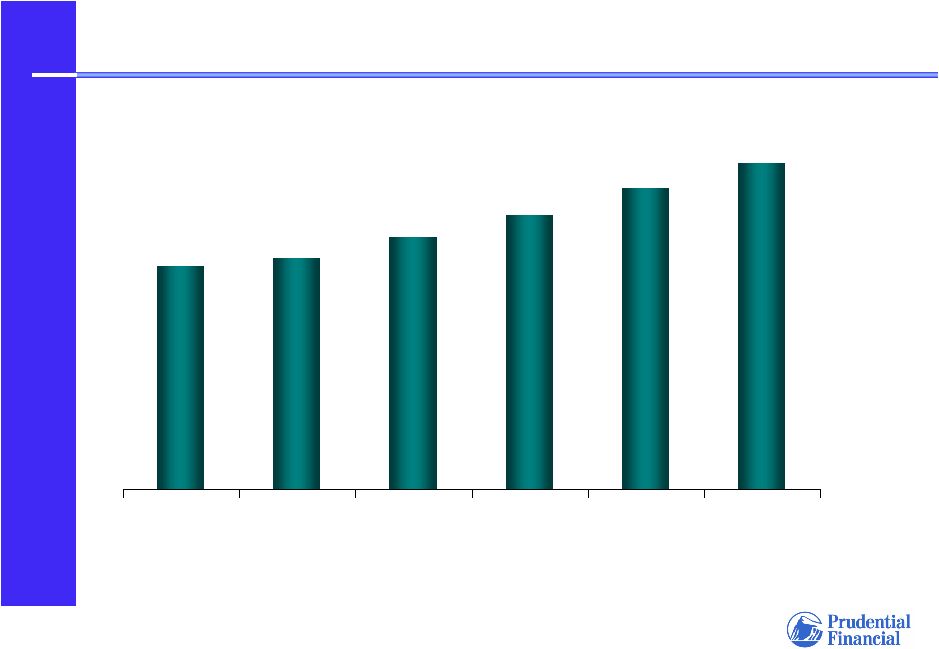 97 Investor Day 12.04.07 Book Value per Share of Common Stock (1) 01/01/02 01/01/03 01/01/04 01/01/05 01/01/06 01/01/07 12/31/02 12/31/03 12/31/04 12/31/05 12/31/06 9/30/07 $32.80 $34.10 $37.10 $40.37 $44.38 1) Excluding accumulated other comprehensive income related to unrealized gains and losses on
investments for all periods and accumulated other comprehensive income
related to pension and postretirement benefits for periods including and
after 2004 $48.15 |
 98 Investor Day 12.04.07 Disciplined Investment Portfolio Management Leverages Proven Investment Expertise • Asset Management is a key Prudential business • Asset selection reflects liability characteristics • Broad capabilities support risk diversification: – Asset class – Sector – Issuer • Well-managed exposure to “risk” assets |
 99 Investor Day 12.04.07 Asset Selection Focus on Liability Characteristics Public fixed maturities Long-term Japanese government bonds; equities support “tail” Private placement bonds, commercial mortgages Representative Asset Types Long duration, variable crediting rates; floor guarantees Domestic Universal Life Extremely long duration (30 years +); fixed rate guarantees Japanese Life Planner Protection Products Predictable withdrawals, crediting rates experience- based Retirement – Full Service Stable Value Liability Characteristics Products |
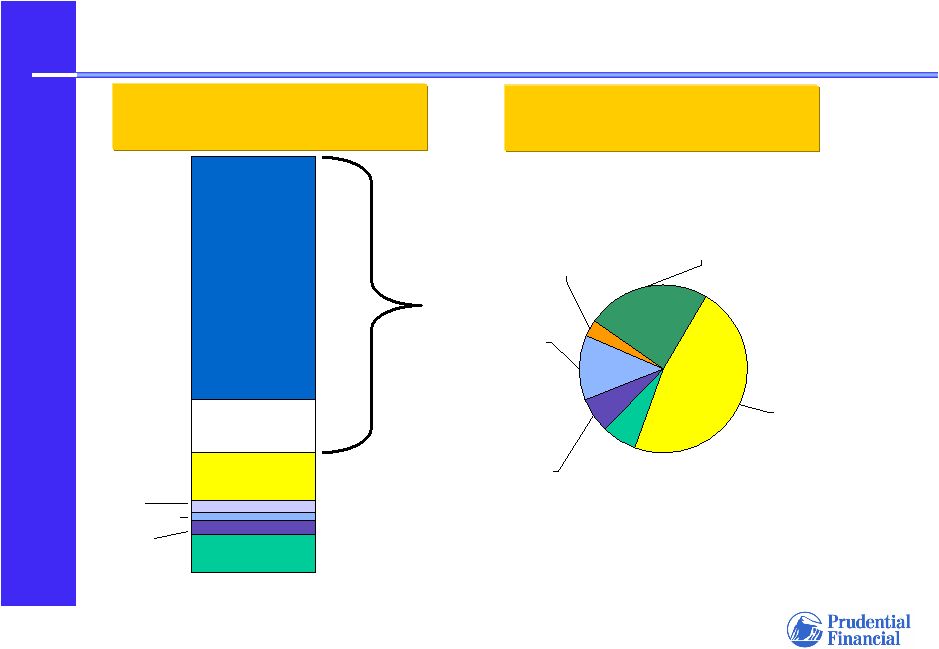 100 Investor Day 12.04.07 9% 12% 13% 58% Asset Selection Skill Sets Support Risk Diversification 1) As of September 30, 2007 at balance sheet carrying amount; excludes invested assets of
securities brokerage, securities trading, banking and asset management operations, and real estate and relocation services 2) Trading account assets supporting insurance liabilities (investment results ultimately
accrue to contract-holders) FSB Fixed Maturities $114.8 billion (1) US Government 3% Foreign Government 24% Other Asset- Backed 12% Commercial Mortgage- Backed 7% Residential MBS Agency passthroughs 7% Corporate 47% FSB General Account $161.1 billion (1) Public Private Commercial Loans “TAASIL” (2) Fixed Maturities Equities 3% Other long-term 2% Policy loans, Short-term, other 3% |
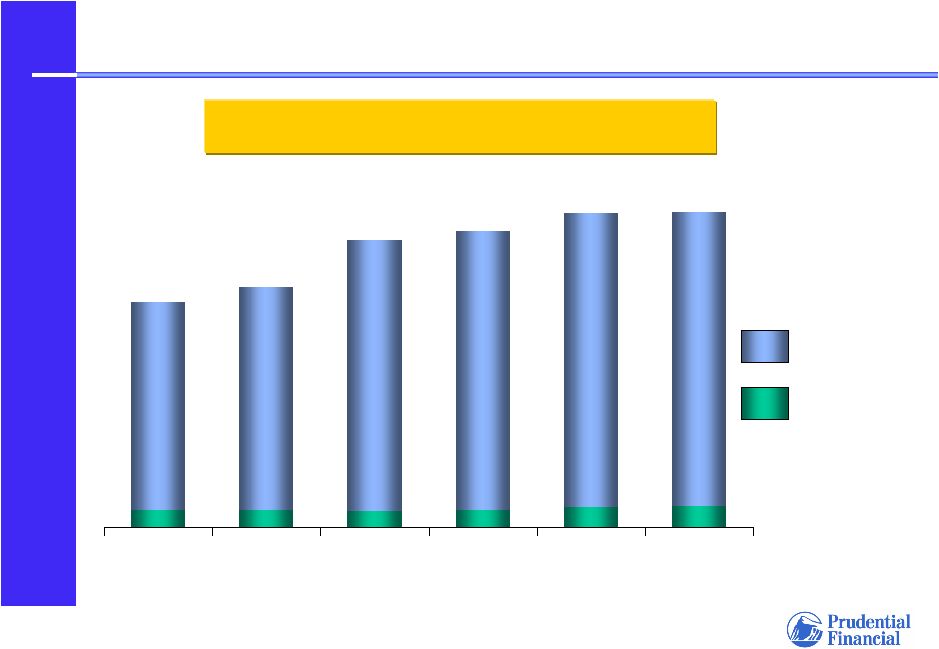 101 Investor Day 12.04.07 Asset Selection Focus on Quality 1) In billions; at fair value. Excludes invested assets of securities brokerage, securities
trading, banking and asset management operations, and real estate and
relocation services FSB Fixed Maturity Portfolio (1) $81.9 $87.4 $104.7 $107.9 $114.6 $114.7 6.2 6.2 6.2 6.2 5.9 5.9 6.2 6.2 7.4 7.4 7.5 7.5 Investment grade Non-investment grade 12/31/02 12/31/03 12/31/04 12/31/05 12/31/06 9/30/07 |
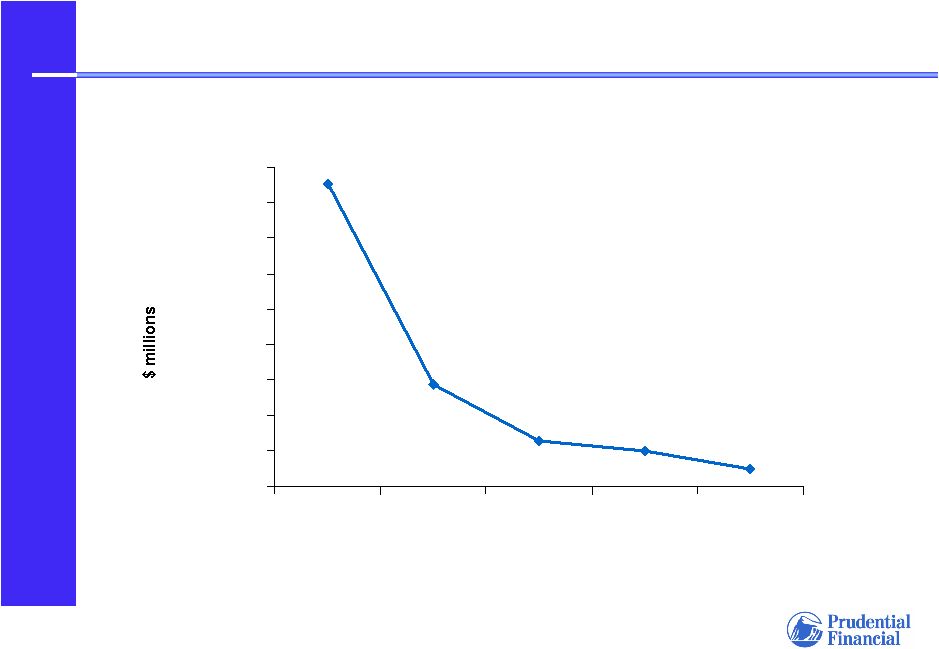 102 Investor Day 12.04.07 $855 $48 $288 $129 $100 $0 $100 $200 $300 $400 $500 $600 $700 $800 $900 2002 2003 2004 2005 2006 1) Other than temporary impairments and credit-related losses on sales of securities
included in realized investment gains and losses of the Financial
Services Businesses Fixed Maturities Impairments and Credit-Related Losses (1) |
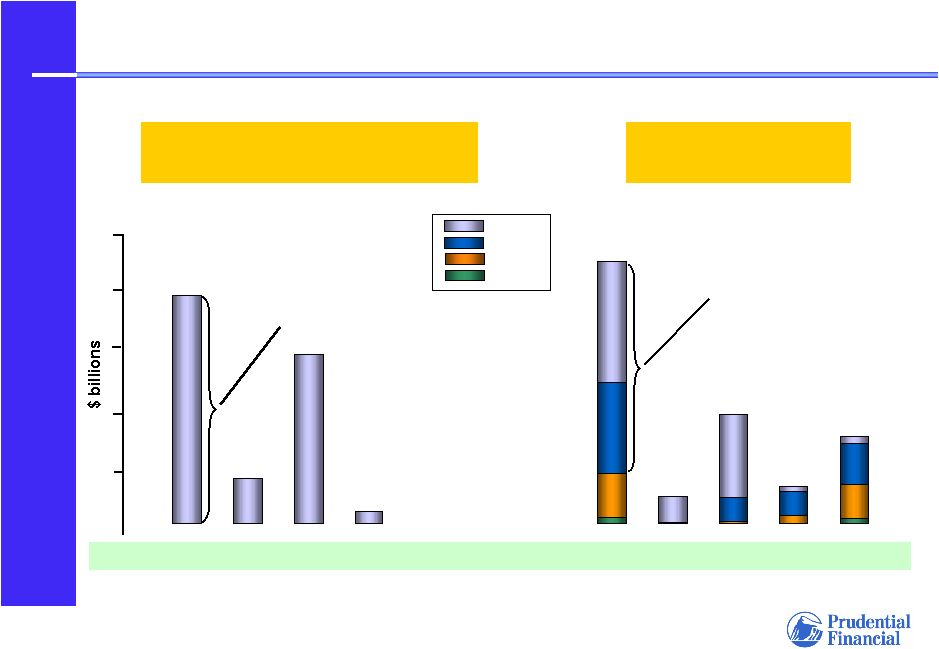 103 Investor Day 12.04.07 AAA AA A BBB Sub-Prime Mortgage Exposure Risk-Based Selection 1) Financial Services Businesses, as of September 30, 2007. At amortized cost.
2) The short-term portfolio is used primarily to invest proceeds of securities lending
and repurchase activities, and cash generated from certain trading and
operating activities; securities have remaining expected average life of 2
years or less when purchased. 81% AAA/AA Short Term Portfolio $3.8 billion (1) (2) All Other Portfolios $4.4 billion (1) Total
’07 ’06 ’05 Pre ’05 <Vintages> Total
’07 ’06 ’05 Pre ‘05 100% AAA $3.8 $0.8 $2.8 $0.2 $4.4 $0.5 $1.8 $0.6 $1.5 $5.0 |
 104 Investor Day 12.04.07 Financial Strength and Flexibility • Strong “available capital” position provides significant financial flexibility; migrating to optimal capital structure • Insurance operations capitalized in excess of “AA” ratings objectives • Diverse cash flow sources contribute to flexibility • Sustained growth in book value per share while returning capital through share repurchases • Investment portfolio: disciplined management; leverages proven investment expertise |
 105 Investor Day 12.04.07 Considerations for 2008 • 2007 baseline earnings • Business growth • Capital management: share repurchases, increased leverage • 8% equity market appreciation from year end • Less favorable commercial real estate environment • US dollar @ 106 yen • 28.4% effective tax rate • Wachovia Securities one-time costs |
 106 Investor Day 12.04.07 FSB Full Year 2008 Earnings Guidance 2007 Guidance (1) $7.45 - $7.60 Non-Recurring/ Unsustainable 2007 Items Baseline Baseline Earnings Level Earnings Level $7.15 $7.15 - - $7.30 $7.30 7.30 Capital management: share repurchases, increased leverage 1) Based on after-tax adjusted operating income for the Financial Services
Businesses Growth/ Expense Management 2008 Guidance (1) Baseline Baseline Earnings Earnings Growth Growth Non-Recurring 2008 Items Wachovia Securities one-time costs |