SLIDE PRESENTATION OF PRUDENTIAL FINANCIAL, INC. AT ITS INVESTOR DAY CONFERENCE
Published on
 1 Investor Day 12.04.08 Prudential Financial, Inc. Investor Day December 4, 2008 Prudential Financial, Inc. Investor Day December 4, 2008 Exhibit 99.1 |
 Investor Day December 4, 2008 Investor Day December 4, 2008 Eric Durant Senior Vice President Investor Relations Eric Durant Senior Vice President Investor Relations |
 3 Investor Day 12.04.08 Certain of the statements included in this presentation constitute forward-looking statements within the meaning of the U.S. Private Securities Litigation Reform Act of 1995. It is possible that actual results may differ materially from any expectations or predictions expressed in this presentation. Words such as “expects,” “believes,” “anticipates,” “includes,” “plans,” “assumes,” “estimates,” “projects,” “intends,” “should,” “will,” “shall,” or variations of such words are generally part of forward-looking statements. Forward-looking statements are made based on management’s current expectations and beliefs concerning future developments and their potential effects upon Prudential Financial, Inc. and its subsidiaries. There can be no assurance that future developments affecting Prudential Financial, Inc. and its subsidiaries will be those anticipated by management. These forward-looking statements are not a guarantee of future performance and involve risks and uncertainties, and there are certain important factors that could cause actual results to differ, possibly materially, from expectations or estimates reflected in such forward-looking statements, including, among others: (1) general economic, market and political conditions, including the performance and fluctuations of fixed income, equity, real estate, and other financial markets, particularly in light of the stress experienced by the global financial markets that began in the second half of 2007 and substantially increased in the third quarter of 2008; (2) the availability and cost of external financing for our operations, which has been affected by the stress experienced by the global financial markets ; (3) interest rate fluctuations; (4) reestimates of our reserves for future policy benefits and claims; (5) differences between actual experience regarding mortality, morbidity, persistency, surrender experience, interest rates or market returns and the assumptions we use in pricing our products, establishing liabilities and reserves or for other purposes; (6) changes in our assumptions related to deferred policy acquisition costs, valuation of business acquired or goodwill; (7) changes in our claims-paying or credit ratings; (8) investment losses and defaults; (9) competition in our product lines and for personnel; (10) changes in tax law; (11) economic, political, currency and other risks relating to our international operations; (12) fluctuations in foreign currency exchange rates and foreign securities markets; (13) regulatory or legislative changes, including government actions in response to the stress experienced by the global financial markets; (14) changes in our claims paying or financial strength ratings; (15) adverse determinations in litigation or regulatory matters and our exposure to contingent liabilities, including in connection with our divestiture or winding down of businesses; (16) domestic or international military actions, natural or man-made disasters including terrorist activities or pandemic disease, or other events resulting in catastrophic loss of life; (17) ineffectiveness of risk management policies and procedures in identifying, monitoring and managing risks; (18) effects of acquisitions, divestitures and restructurings, including possible difficulties in integrating and realizing the projected results of acquisitions; (19) changes in statutory or U.S. GAAP accounting principles, practices or policies; (20) changes in assumptions for retirement expense; (21) Prudential Financial, Inc.’s primary reliance, as a holding company, on dividends or distributions from its subsidiaries to meet debt payment obligations and the ability of the subsidiaries to pay such dividends or distributions in light of our ratings objectives and/or applicable regulatory restrictions; and (22) risks due to the lack of legal separation between our Financial Services Businesses and our Closed Block Business. Prudential Financial, Inc. does not intend, and is under no obligation, to update any particular forward-looking statement included in this presentation. Prudential Financial, Inc. of the United States is not affiliated with Prudential PLC which is headquartered in the United Kingdom. Forward-Looking Statements |
 4 Investor Day 12.04.08 This presentation includes references to “adjusted operating income.” Adjusted operating income is a non-GAAP measure of performance of our Financial Services Businesses. Adjusted operating income excludes “Realized investment gains (losses), net,” as adjusted, and related charges and adjustments. A significant element of realized investment gains and losses are impairments and credit-related and interest rate-related gains and losses. Impairments and losses from sales of credit-impaired securities, the timing of which depends largely on market credit cycles, can vary considerably across periods. The timing of other sales that would result in gains or losses, such as interest rate-related gains or losses, is largely subject to our discretion and influenced by market opportunities as well as our tax profile. Realized investment gains (losses) representing profit or loss of certain of our businesses which primarily originate investments for sale or syndication to unrelated investors, and those associated with terminating hedges of foreign currency earnings and current period yield adjustments are included in adjusted operating income. Realized investment gains and losses from products that are free standing derivatives or contain embedded derivatives, and from associated derivative portfolios that are part of an economic hedging program related to the risk of those products, are included in adjusted operating income. Adjusted operating income excludes gains and losses from changes in value of certain assets and liabilities related to foreign currency exchange movements that have been economically hedged, as well as counterparty credit losses on derivative positions experienced during the third quarter of 2008. Adjusted operating income also excludes investment gains and losses on trading account assets supporting insurance liabilities and changes in experience-rated contractholder liabilities due to asset value changes, because these recorded changes in asset and liability values will ultimately accrue to contractholders. Trends in the underlying profitability of our businesses can be more clearly identified without the fluctuating effects of these transactions. In addition, adjusted operating income excludes the results of divested businesses, which are not relevant to our ongoing operations. Discontinued operations, which is presented as a separate component of net income under GAAP, is also excluded from adjusted operating income. We believe that the presentation of adjusted operating income as we measure it for management purposes enhances understanding of the results of operations of the Financial Services Businesses by highlighting the results from ongoing operations and the underlying profitability of our businesses. However, adjusted operating income is not a substitute for income determined in accordance with GAAP, and the excluded items are important to an understanding of our overall results of operations. The schedules on the following pages provide a reconciliation of adjusted operating income to income from continuing operations in accordance with GAAP. Return on equity (“ROE”) based on adjusted operating income is determined by dividing adjusted operating income after-tax (giving effect to the direct equity adjustment for earnings per share calculation), annualized for interim periods, by average attributed equity for the Financial Services Businesses excluding accumulated other comprehensive income related to unrealized gains and losses on investments and accumulated other comprehensive income related to pension and postretirement benefits. Our expectations of Common Stock earnings per share and ROE are based on after-tax adjusted operating income. Because we do not predict future realized investment gains / losses or recorded changes in asset and liability values that will ultimately accrue to contractholders, we cannot provide a measure of our Common Stock earnings per share or ROE expectations based on income from continuing operations of the Financial Services Businesses, which is the GAAP measure most comparable to adjusted operating income. For additional information about adjusted operating income and the comparable GAAP measure please refer to our Annual Report on Form 10-K for the year ended December 31, 2007, our Current Report on Form 8-K dated May 16, 2008 to retrospectively adjust portions of the Company’s Annual Report on Form 10-K for the year ended December 31, 2007, and our Quarterly Report on Form 10-Q and 10-Q/A for the quarter ended September 30, 2008 located on the Investor Relations Web site at www.investor.prudential.com. Additional historical information relating to the Company’s financial performance, including its third quarter 2008 Quarterly Financial Supplement, is also located on the Investor Relations website. The information referred to above and on the prior page, as well as the risks of our businesses described in our Annual Report on Form 10-K for the year ended December 31, 2007, and our Quarterly Report on Form 10-Q and 10-Q/A for the quarter ended September 30, 2008, should be considered by readers when reviewing forward-looking statements contained in this presentation. Non–GAAP Measure |
 5 Investor Day 12.04.08 Nine months ended (in millions, except per share data) September 30, 2008 Financial Services Businesses: Pre-tax adjusted operating income (loss) by division: Insurance Division Investment Division International Insurance and Investments Division Corporate and other operations Total pre-tax adjusted operating income Income taxes, applicable to adjusted operating income Financial Services Businesses after-tax adjusted operating income Reconciling items: Realized investment losses, net, and related charges and adjustments Investment gains (losses) on trading account assets supporting insurance liabilities,
net Change in experience-rated contractholder liabilities due to asset value changes Divested businesses Equity in earnings of operating joint ventures Total reconciling items, before income taxes Income taxes, not applicable to adjusted operating income Total reconciling items, after income taxes Income from continuing operations (after-tax) of Financial Services Businesses
before equity in earnings of operating joint ventures Equity in earnings of operating joint ventures, net of taxes Income (loss) from continuing operations (after-tax) of Financial Services Businesses
Income (loss) from discontinued operations, net of taxes Net income (loss) of Financial Services Businesses Earnings per share of Common Stock (diluted): Financial Services Businesses after-tax adjusted operating income Reconciling items: Realized investment losses, net, and related charges and adjustments Investment gains (losses) on trading account assets supporting insurance liabilities,
net Change in experience-rated contractholder liabilities due to asset value changes Divested businesses Equity in earnings of operating joint ventures Total reconciling items, before income taxes Income taxes, not applicable to adjusted operating income Total reconciling items, after income taxes Income from continuing operations (after-tax) of Financial Services Businesses
before equity in earnings of operating joint ventures Equity in earnings of operating joint ventures, net of taxes Income (loss) from continuing operations (after-tax) of Financial Services
Businesses Income (loss) from discontinued operations, net of taxes Net income (loss) of Financial Services Businesses Weighted average number of outstanding Common shares (diluted) Reconciliation to Consolidated Net Income of Prudential Financial, Inc: Net income (loss) of Financial Services Businesses (above) Net income (loss) of Closed Block Business Consolidated net income (loss) Direct equity adjustments for earnings per share calculations Reconciliation between adjusted operating income and the comparable GAAP measure 670 $
697 1,415 (61) 2,721 717 2,004 (1,711) (919) 682 (276) 108 (2,116) (715) (1,401) 603 (62) 541 3 544 $
4.65 $
(3.90) (2.10) 1.55 (0.62) 0.25 (4.82) (1.63) (3.19) 1.46 (0.14) 1.32 0.00 1.32 $
438.6 544 $
(51) 493 $
36 $
|
 6 Investor Day 12.04.08 Nine months ended (in millions) September 30, 2008 Revenues (1): Premiums 8,861 $
Policy charges and fee
income 2,342 Net investment
income 6,332 Asset
management fees, commissions and other income 2,608 Total revenues 20,143 Benefits and Expenses (1):
Insurance and annuity benefits 9,066 Interest
credited to policyholders' account balances 2,462 Interest
expense 787 Deferral of acquisition costs (1,735) Amortization of
acquisition costs 891 General and administrative expenses 5,951
Total benefits and expenses 17,422 Adjusted operating income before
income taxes 2,721 Reconciling
items: Realized investment gains (losses), net, and
related adjustments (1,756) Related
charges 45 Total realized investment gains (losses), net, and
related charges and adjustments (1,711) Investment
gains (losses) on trading account assets supporting insurance liabilities, net (919) Change in experience-rated contractholder liabilities due to asset
value changes 682 Divested businesses (276) Equity in earnings of operating joint ventures 108 Total reconciling items, before income taxes (2,116) Income from continuing
operations before income taxes and equity in earnings of
operating joint ventures 605 Income tax expense 2 Income from continuing operations before equity in earnings of operating joint
ventures 603 $
(1) Revenues
exclude realized investment gains, net of losses and related charges and adjustments; investment gains, net of losses, on trading account assets supporting insurance liabilities, and revenues of divested businesses, and include revenues representing
equity in earnings of operating joint ventures. Benefits and expenses exclude charges related to realized investment gains, net of losses; change in experience-rated contractholder
liabilities due to asset value changes and benefits and expenses of divested businesses. Reconciliation between adjusted operating income and the comparable GAAP measure (continued) |
 Prudential Financial, Inc. Prudential Financial, Inc. John Strangfeld CEO and Chairman John Strangfeld CEO and Chairman |
 8 Investor Day 12.04.08 Where We Are Today • Balanced portfolio of businesses and risks • High quality businesses – Attractive value propositions – Strong underlying fundamentals – Diversified distribution channels – Strong growth prospects in International, U.S. Retirement and Annuities • Strong balance sheet – Capital to meet “AA” standards for insurance subsidiaries – Diversified high quality investment portfolio • Robust sources of liquidity provide financial flexibility • Acquisition and integration track record |
 9 Investor Day 12.04.08 Wachovia Joint Venture • Formed in 2003; created third largest retail securities firm • Viewed as a financial investment versus strategic investment • Wachovia management has operating control; Prudential has put rights • “Lookback” option selected as consequence of A.G. Edwards transaction • We intend to exercise our lookback put – Current counterparty is Wachovia; will be Wells Fargo by year-end – Valuation established based on value of the pre-A.G. Edwards business at January 1, 2008; approximate value is $5 billion pre-tax; in excess of $3.7 billion after-tax – Timing of proceeds – January 2010 • We will record Financial Advisory as a divested business beginning in the fourth quarter of 2008 |
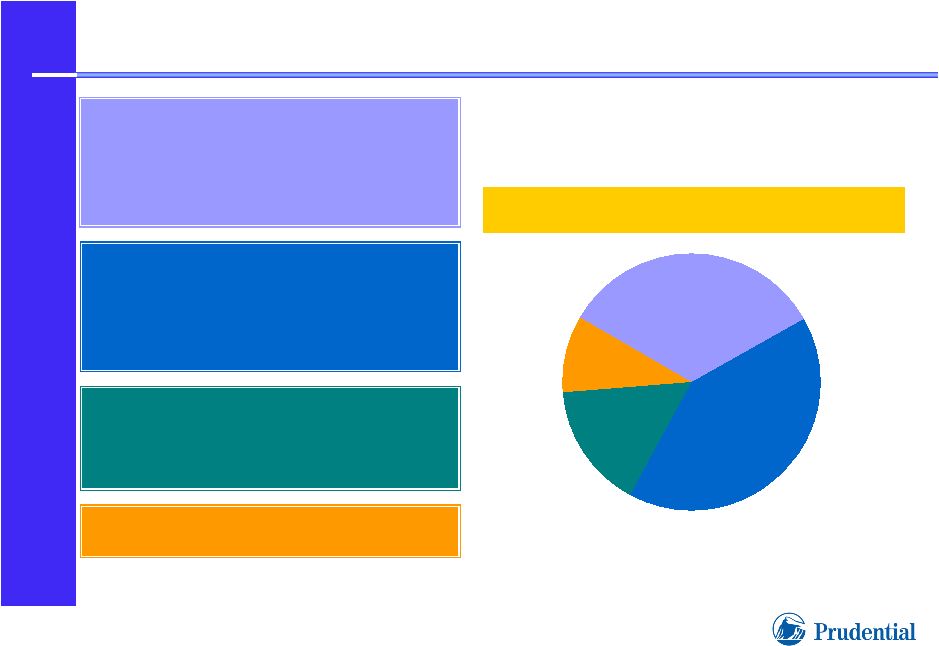 10 Investor Day 12.04.08 Attributed Equity of Operating Businesses Attributed Attributed equity equity $21.5 $21.5 billion billion (1) (1) INTERNATIONAL BUSINESSES INTERNATIONAL BUSINESSES • • Life Planner model Life Planner model • • Gibraltar Life Gibraltar Life • • International Investments International Investments RETIREMENT & ACCUMULATION RETIREMENT & ACCUMULATION • • Retirement Retirement • • Individual Annuities Individual Annuities • • Asset Management Asset Management DOMESTIC INSURANCE DOMESTIC INSURANCE • • Individual Life Individual Life • • Group Insurance Group Insurance CORPORATE AND OTHER CORPORATE AND OTHER (2) (2) 1) As of September 30, 2008 for the FSB; excludes accumulated other comprehensive income
related to unrealized gains and losses on investments and
pension/postretirement benefits 2) Includes investment in Wachovia retail securities brokerage joint venture $3.4 $8.8 $7.2 $2.1 |
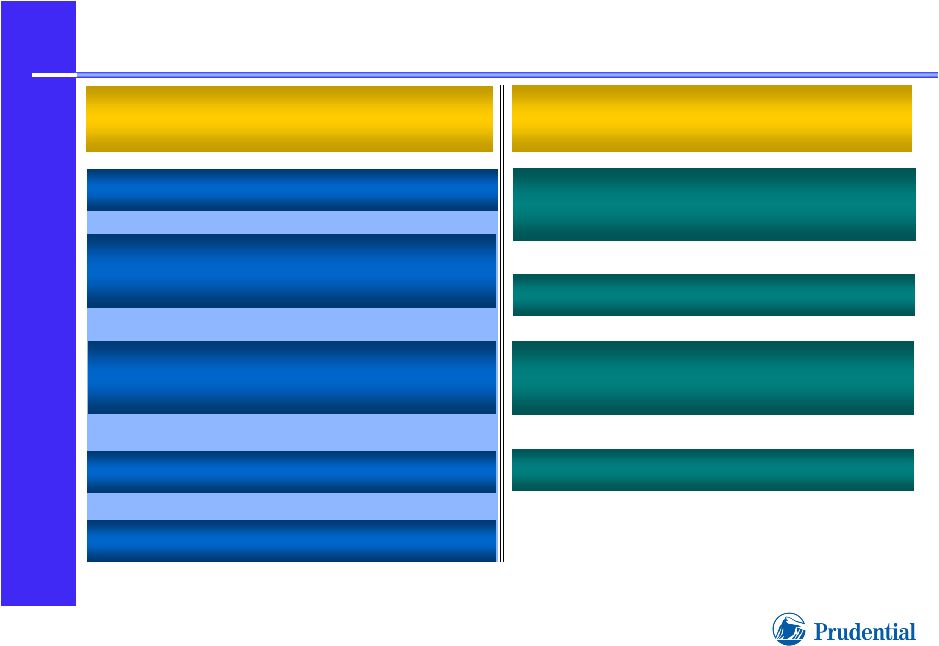 11 Investor Day 12.04.08 Capital To Meet “AA” Standards For Insurance Subsidiaries Prudential Insurance Prudential Insurance Other Businesses: Other Businesses: Attributed equity $5.8 billion Attributed equity $5.8 billion (1) (3) Regulated Businesses: Regulated Businesses: Attributed equity $15.7 billion Attributed equity $15.7 billion (1) (2) Prudential Retirement Insurance Prudential Retirement Insurance & Annuity Co. & Annuity Co. Prudential Annuities Prudential Annuities Life Assurance Co. Life Assurance Co. Prudential of Japan Prudential of Japan Gibraltar Life Gibraltar Life Wachovia Retail Securities Wachovia Retail Securities Brokerage Joint Venture Brokerage Joint Venture Asset Management Businesses Asset Management Businesses International Investment International Investment Businesses Businesses Real Estate and Relocation Real Estate and Relocation 1) For the Financial Services Businesses; as of September 30, 2008 2) Represents attributed equity for businesses primarily conducted through regulated
insurance entities 3) Represents attributed equity for businesses primarily conducted through unregulated
entities |
 12 Investor Day 12.04.08 Robust Sources of Liquidity Provide Flexibility in Challenging Financial Markets Prudential Prudential Insurance Insurance (1) (1) • Commercial Paper Program Commercial Paper Program qualifies for Federal facility up qualifies for Federal facility up to $9.8 billion to $9.8 billion • Federal Home Loan Bank of Federal Home Loan Bank of New York borrowing facility New York borrowing facility • $10 billion readily $10 billion readily “lendable” “lendable” securities securities (2)(3) (2)(3) • Strong cash flows from Strong cash flows from insurance operations insurance operations Parent Company Parent Company • • $3.8 billion cash and short-term $3.8 billion cash and short-term investments on balance sheet investments on balance sheet (2) (2) • • Commercial Paper Program Commercial Paper Program qualifies for Federal facility up qualifies for Federal facility up to $1.3 billion to $1.3 billion • • Inter-company liquidity facility Inter-company liquidity facility • • Inter-company debt Inter-company debt $4.4 $4.4 billion billion committed committed lines lines of of credit credit (2)(4) (2)(4) 1) Including wholly-owned subsidiary, Prudential Funding, LLC 2) As of September 30, 2008 3) For the Financial Services Businesses 4) Excluding $500 million facility expiring December 2008 |
 13 Investor Day 12.04.08 Diversified High Quality Investment Portfolio • Prudential is a credit shop • Seasoned skills in multiple asset classes enhance risk diversification • Market leading capabilities: private fixed income, commercial mortgages and real estate • Defensively positioned portfolio • Third-party Institutional flows: the best indicator of competitiveness |
 14 Investor Day 12.04.08 Attractive Value Proposition in Markets Focused on Retirement Security • Insurance-based retirement income products attractive to Life Planner and Gibraltar clients • U.S. dollar denominated fixed annuities offer alternative to volatile financial markets International International Businesses Businesses • “Highest Daily” Annuity Products: self-hedging feature protects customer account value, reduces company’s risk profile • Retirement stable value products highly attractive in volatile financial markets United States United States Businesses Businesses Insurance Protection Products Offer Fundamental Financial Security Reputation: “Over 130 Years of Making and Keeping Promises” Reputation: “Over 130 Years of Making and Keeping Promises”
|
 15 Investor Day 12.04.08 Prudential’s Management Team John Strangfeld CEO and Chairman Mark Grier Vice Chairman Rich Carbone Chief Financial Officer Bernard Winograd U.S. Businesses Ed Baird International Businesses • Jim Avery Individual Life • Steve Pelletier Individual Annuities • Lori High Group Insurance • Christine Marcks Retirement • Charles Lowrey Asset Management • Kazuo Maeda Insurance – Japan • Tim Feige Insurance – Other Countries • Chris Cooper International Investments Office of the Chairman |
 Prudential Financial, Inc. Prudential Financial, Inc. Mark Grier Vice Chairman Mark Grier Vice Chairman |
 17 Investor Day 12.04.08 Financial Strength and Flexibility in Challenging Markets • Internal resources available to support “AA” ratings objectives for insurance entities • Robust liquidity sources for parent company and operating units • Asset management is a key Prudential capability • Asset selection reflects liability characteristics • Highly diversified and defensively positioned investment portfolio • Concentration limits around investment portfolio – Asset class – Single issuer – Credit quality and industry – Geographic |
 18 Investor Day 12.04.08 Insurance Entities Managing to “AA” Standards • Credit migration • Business growth Required Capital: $2 Billion Targeted to meet “AA” standards • Statutory operating results • Annuity reserves • Credit impairments • Unrealized gains and losses • Dividends to parent Total Adjusted Capital: $11 Billion RBC at RBC at December 31, December 31, 2008 2008 2008 Developments 2008 Developments Risk Based Capital Risk Based Capital at December 31, at December 31, 2007 2007 (1) (1) • Possible contribution of financial assets • Possible adjustment of policyholder dividend scale to reflect results 1) As reported by Prudential Insurance to Insurance regulators. “Required Capital” represents authorized control level risk-based capital multiplied by 2; in Billions.
|
 19 Investor Day 12.04.08 Statutory Accounting: Responsible Approach Supports Quality of Recorded Capital • Asset Valuation Reserve: $2.1 billion (1) – historically maintained at or near maximum levels • Asset Adequacy Testing: reserves based on projected cash flows under adverse scenarios, not heroic assumptions • Structured securities: GAAP market values applied in impairments, ahead of new standards 1) For Prudential Insurance, as of September 30, 2008 |
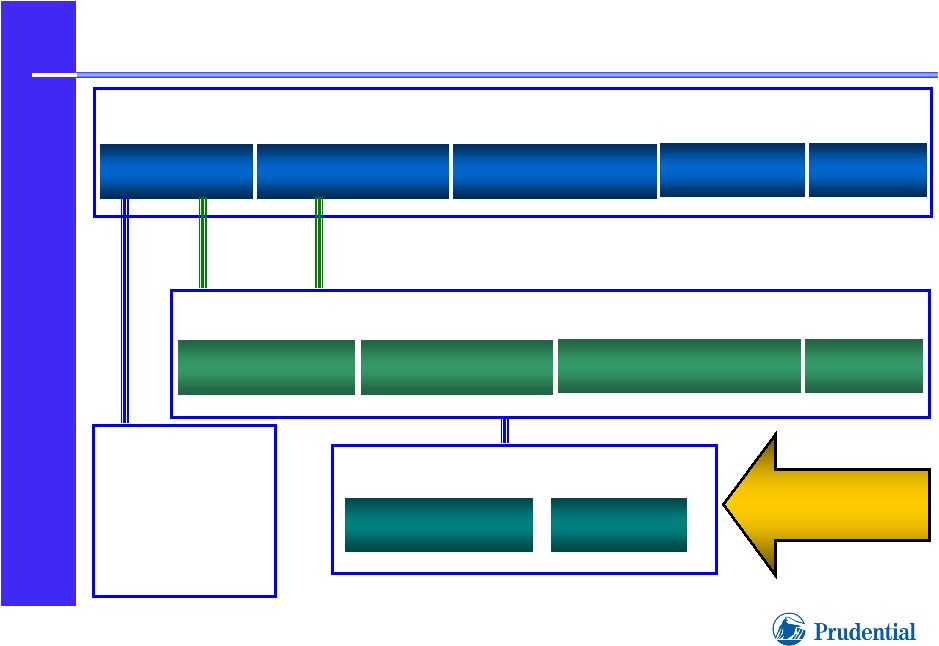 20 Investor Day 12.04.08 Prudential Financial, Inc. (Parent) Robust Sources of Liquidity Inter-company Debt Enterprise Liquidity Facility Lines of Credit Commercial Paper Prudential Insurance “Lendable” Securities Cash Flows from Operations Lines of Credit Federal Home Loan Bank of New York Prudential Funding, LLC Lines of Credit Commercial Paper • Asset Management Businesses • International Businesses Funding Arm of Prudential Insurance Cash and Short Term Investments |
 21 Investor Day 12.04.08 Asset Selection Focus on Liability Characteristics Public fixed maturities Long-term Japanese government bonds; equities support “tail” Private placement bonds, commercial mortgages Representative Representative Asset Types Asset Types Long duration, variable crediting rates; floor guarantees Domestic Universal Life Extremely long duration (30 years +); fixed rate guarantees Japanese Life Planner Protection Products Predictable withdrawals, crediting rates experience-based Retirement – Full Service Stable Value Liability Liability Characteristics Characteristics Products Products |
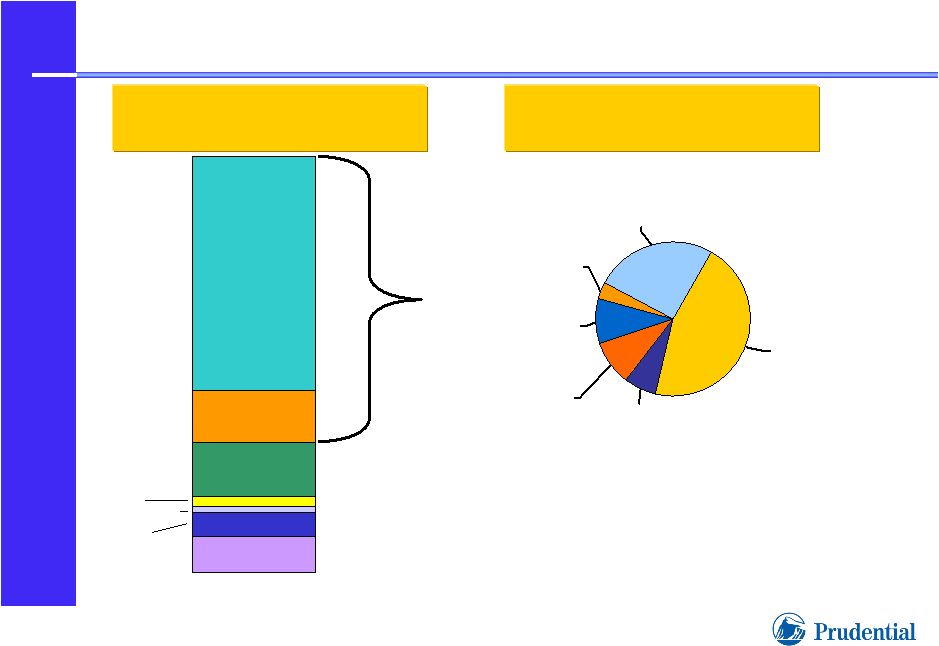 22 Investor Day 12.04.08 US Government (3) 4% Foreign Government 26% Other Asset- Backed 9% Commercial Mortgage-Backed 7% Residential MBS- Agency passthroughs 9% Corporate 45% 9% 13% 12% 56% Broad Investment Expertise Supports Risk Diversification 1) As of September 30, 2008 at balance sheet carrying amount; excludes invested assets of
securities brokerage, securities trading, banking and asset management operations, and real estate and relocation services 2) Trading account assets supporting insurance liabilities (investment results ultimately
accrue to contract-holders) 3) Includes state and municipal securities FSB Fixed Maturities FSB Fixed Maturities $116 billion $116 billion (1) (1) FSB General Account FSB General Account $169 billion $169 billion (1) (1) Public Private Commercial Loans “TAASIL” (2) Fixed Maturities Equities 3% Other long-term 1% Policy loans, Short-term, other 6% |
 23 Investor Day 12.04.08 Asset Selection Focus on Quality 1) In billions; at fair value. Excludes invested assets of securities brokerage,
securities trading, banking and asset management operations, and real
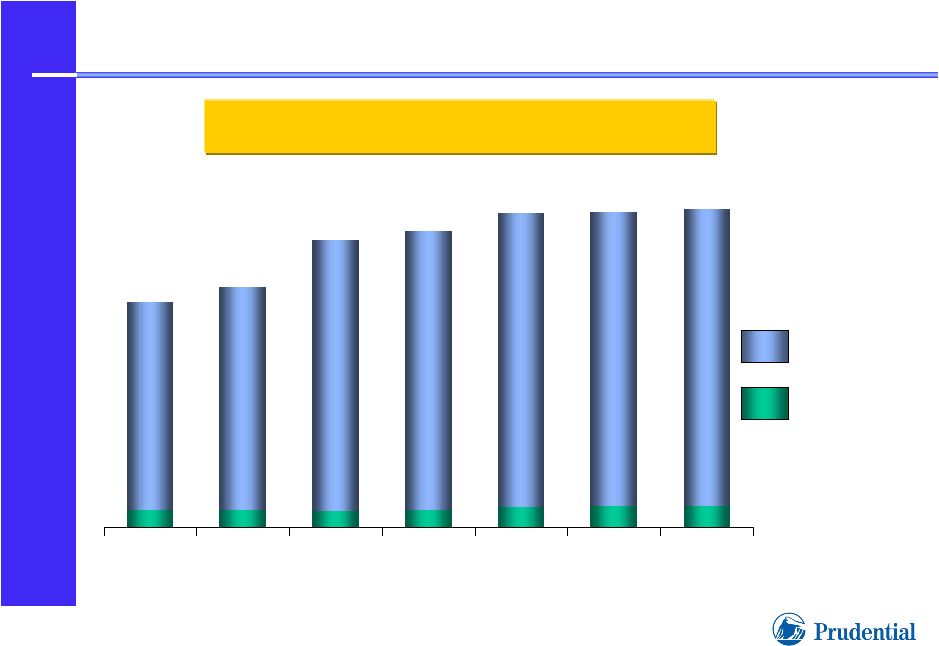
estate and relocation services FSB Fixed Maturity Portfolio FSB Fixed Maturity Portfolio (1) (1) $81.9 $87.4 $104.7 $107.9 $114.6 $114.8 6.2 6.2 6.2 6.2 5.9 5.9 6.2 6.2 7.4 7.4 7.5 7.5 Investment grade Non-investment grade 12/31/02 12/31/03 12/31/04 12/31/05 12/31/06 12/31/07 $116.1 9/30/08 7.6 7.6 |
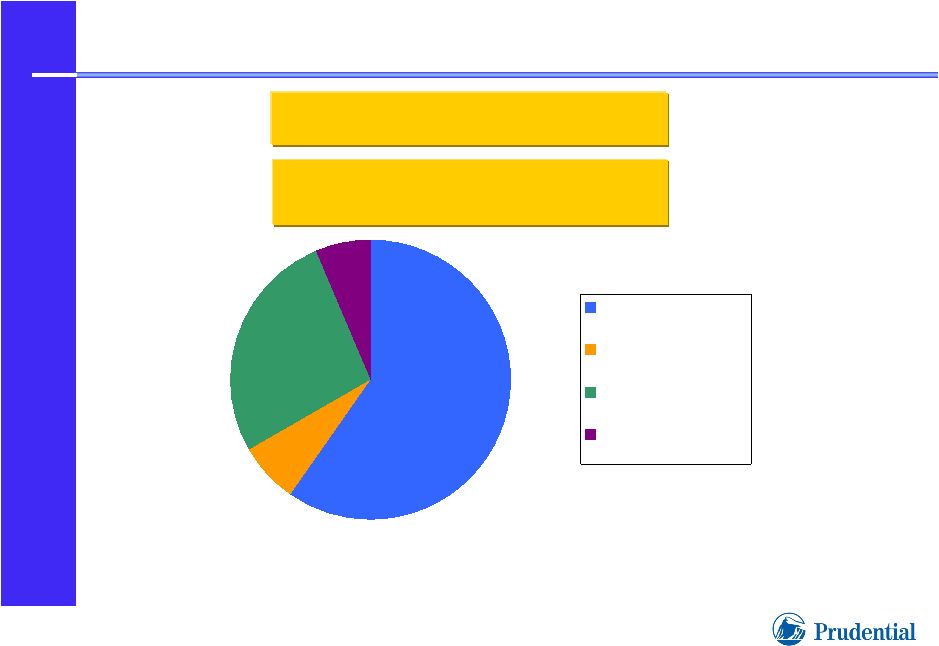 24 Investor Day 12.04.08 Prudential’s Credit Exposure Corporate Credits Corporate Credits Total FSB - Total FSB - General Account General Account $55.4 billion $55.4 billion (1) (1) 60% 7% 27% 6% Public Corporates Investment Grade Public Corporates High Yield Private Corporates Investment Grade Private Corporates High Yield 1) Financial Services Businesses General Account; as of September 30, 2008; amortized cost
|
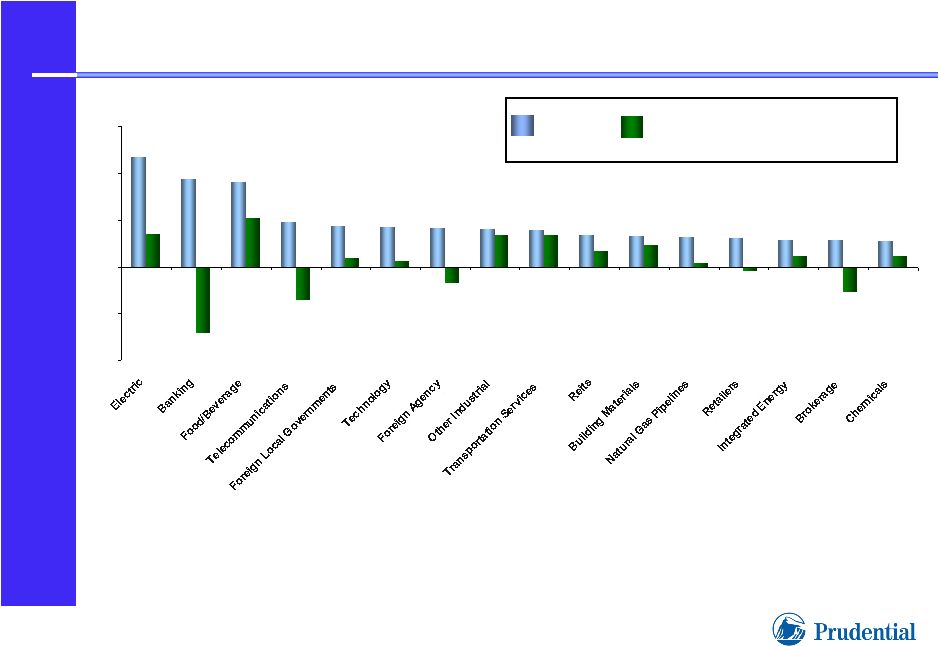 25 Investor Day 12.04.08 Prudential’s Credit Exposure (1) Note: Universe derived from Lehman Corporate Credit and High Yield Indices in
proportions consistent with our actual Investment Grade/Non Investment
Grade mix. 1) For the Financial Services Businesses General Account as of September 30, 2008 based on
market value -8% -4% 0% 4% 8% 12% Prudential Over/Under Weight vs.
Lehman |
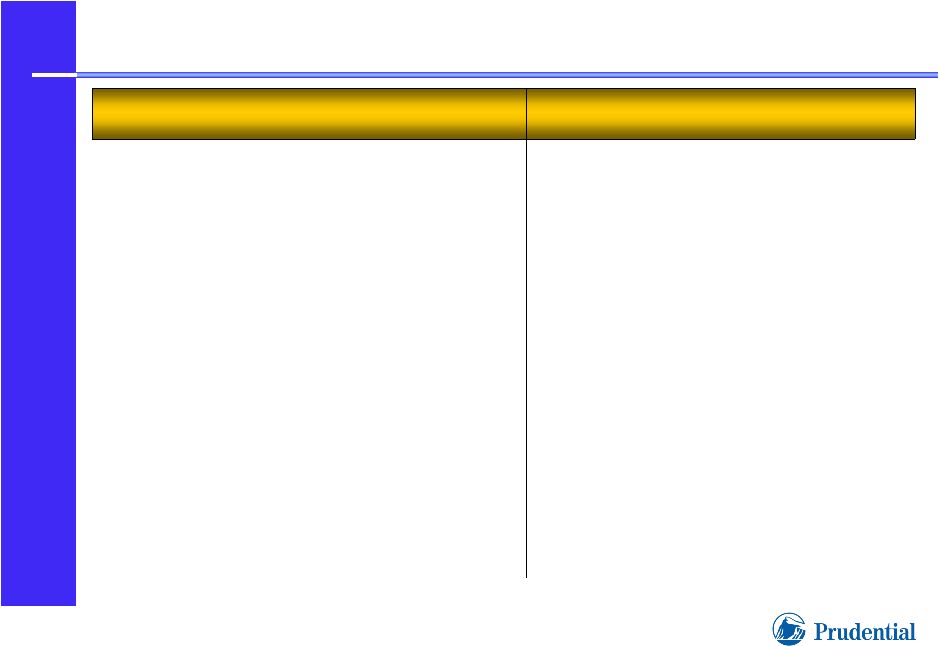 26 Investor Day 12.04.08 Private Fixed Income $21.7 Billion (1) 1) Financial Services Businesses General Account; as of September 30, 2008; amortized cost
Private Placement Debt Market Private Placement Debt Market • Often well-suited to fund insurance liability cash flows • Terms and covenants offer investors protection from “event risks” • Attractive long-term capital source for middle market companies • Higher credit spreads or coupons relative to like-quality public securities Prudential Positioning Prudential Positioning • Prudential general account is preferred customer • Not a “price taker” – direct access to issuers allows negotiation of terms and covenants • Relatively favorable credit experience • “Reliable partner”: proprietary direct origination network built on relationships • Over 60 years experience |
 27 Investor Day 12.04.08 Sub-Prime Asset-Backed Securities (1) 50% 91% 41% $4,696 $5,872 $409 $590 $887 $2,086 $1,900 Fair Value TOTAL BB & below BBB A AA AAA Amortized Cost at Lowest Rating Agency Rating Amortized Cost at Lowest Rating Agency Rating 68% Enhanced Short-Term Portfolio (2) Credit Subordination: 20% or more 30% or more 1) For the Financial Services Businesses General Account; in millions; as of September 30,
2008 2) Remaining average expected life of two years or less when acquired
|
 28 Investor Day 12.04.08 1.55x 69% 75% 91% $7,844 $8,420 $153 $183 $56 $107 $7,921 Fair Value TOTAL BB & below BBB A AA AAA Amortized Cost at Lowest Rating Agency Rating Amortized Cost at Lowest Rating Agency Rating 94% 1) For the Financial Services Businesses General Account; in millions; as of September 30,
2008 Commercial Mortgage-Backed Securities (1) Credit Subordination: 20% or more 30% or more Weighted Average: Loan-to-Value Ratio Debt Service Coverage Ratio |
 29 Investor Day 12.04.08 Commercial Mortgages (1) (2) 0.3% Percentage Delinquent or in foreclosure 1.91x • Debt Service Coverage Ratio 57% Weighted Average • Loan-to-Value Ratio $22 billion Carrying Value 1) For the Financial Services Businesses General Account; in millions; as of September 30,
2008 2) Includes $1.2 billion uncollateralized loans, primarily corporate loans not meeting definition of “security” under GAAP. |
 30 Investor Day 12.04.08 Financial Strength and Flexibility • Insurance entities managed to “AA” standards; supported by internal capital resources • Broad investment expertise and asset-liability management skills drive portfolio selection • Asset selection reflects liability characteristics; focus on cash flows, not fluctuating market values • Concentration limits mitigate risk |
 Prudential Financial, Inc. Prudential Financial, Inc. Rich Carbone Chief Financial Officer Rich Carbone Chief Financial Officer |
 32 Investor Day 12.04.08 Prudential’s View on Capital • Required Equity – The amount of equity capital necessary to support business risk at an A rating at PFI and AA rating at Prudential’s insurance subsidiaries (e.g. Prudential Insurance). – Equity attribution methodology that is unbiased, based on risk, regulatory capital requirements, and common sense. • Capital Capacity – Net Balance Sheet Excess Capital • Off Balance Sheet Capacity – Wachovia Joint Venture – Hybrids – Surplus Notes |
 33 Investor Day 12.04.08 2008 Capital Capacity (1) $ 1,700 Unrecognized Wachovia Gain (after-tax) $ 28,000 $ 24,400 Required Equity 23% 18% Debt to Capital Ratio 450% 551% Prudential Insurance RBC (3) $ 1,550 $ 7,041 Capital Capacity (A) + (B) 1,100 4,651 Total Unused Leverage Capacity (B) 1,100 4,192 Unused Hybrid Capacity - 459 Unused Debt Capacity 450 2,390 Net on Balance Sheet Excess Capital (A) 28,450 26,790 Total Capital Outstanding 1,500 - Hybrids Outstanding 6,250 4,781 Capital Debt Outstanding 20,700 22,009 Attributed Equity (2) S&P 900 S&P 900 Actual Actual Capital Capacity Capital Capacity ($ in millions) 12/31/2007 12/31/2008 Projected 1) For the Financial Services Businesses 2) Excludes accumulated other comprehensive income related to unrealized gains and losses
on investments and pension/postretirement benefits. 3) The inclusion of RBC measures is intended solely for the information of investors and
is not intended for the purpose of ranking any insurance company or for use
in connection with any marketing, advertising or promotional activities. |
 34 Investor Day 12.04.08 2008 Capital Capacity (1) $ 1,700 $ 1,700 $ 1,700 Unrecognized Wachovia Gain (after-tax) $ 29,600 $ 28,800 $ 28,000 $ 24,400 Required Equity 25% 370% $ (1,050) 350 350 - (1,400) 28,200 1,500 6,700 20,000 S&P 700 S&P 700 24% 420% $ 350 800 800 - (450) 28,350 1,500 6,450 20,400 S&P 800 S&P 800 23% 18% Debt to Capital Ratio 450% 551% Prudential Insurance RBC (3) $ 1,550 $ 7,041 Capital Capacity (A) + (B) 1,100 4,651 Total Unused Leverage Capacity (B) 1,100 4,192 Unused Hybrid Capacity - 459 Unused Debt Capacity 450 2,390 Net on Balance Sheet Excess Capital (A) 28,450 26,790 Total Capital Outstanding 1,500 - Hybrids Outstanding 6,250 4,781 Capital Debt Outstanding 20,700 22,009 Attributed Equity (2) S&P 900 S&P 900 Actual Actual Capital Capacity Capital Capacity ($ in millions) 12/31/2007 12/31/2008 Projected 1) For the Financial Services Businesses 2) Excludes accumulated other comprehensive income related to unrealized gains and losses
on investments and pension/postretirement benefits. 3) The inclusion of RBC measures is intended solely for the information of investors and
is not intended for the purpose of ranking any insurance company or for use
in connection with any marketing, advertising or promotional activities. |
 35 Investor Day 12.04.08 PFI Projected Sources & Uses of Cash (S&P 700) $ 301 $ 2,598 $ 2,535 Net Balance, excluding CP / other financing $ (3,264) $ (1,181) $ (3,320) Total Uses of Cash (239) (281) (1,197) Other Cash Outflows - - (240) Shareholder Dividends $ (3,025) $ (900) $ ( 1,883) Maturing Debt Uses of Cash $ 3,565 $ 3,779 $ 5,855 Total On Balance Sheet Sources of Cash 967 1,244 3,466 Cash inflows $ 2,598 $ 2,535 $ 2,389 Cash on hand 2Q09 2Q09 1Q09 1Q09 4Q08 4Q08 On Balance Sheet Sources of Cash On Balance Sheet Sources of Cash $ 250 $ 800 $ 800 Affiliate Borrowing Capacity 4,440 Credit Lines TBD TBD N/A Debt Markets TBD TBD TBD Wachovia JV Put – Early Exit or Potential Financing - 1,300 1,300 Federal Commercial Paper Funding Facility Additional Sources of Liquidity Additional Sources of Liquidity Note: $ in millions |
 36 Investor Day 12.04.08 Sources of Prudential Insurance Liquidity (1) • Unused Securities Lending Capacity $10.0 billion (2) • Federal Home Loan Bank of NY Total Capacity $ 6.7 billion • Federal Commercial Paper Funding Facility $ 9.8 billion • Credit Lines (shared with holding company) $ 4.4 billion (3) 1) As of September 30, 2008; includes Prudential Funding 2) For the Financial Services Businesses 3) Excludes $0.5 billion, maturing in December 2008 |
 U.S.
Businesses Growing and Protecting Wealth in the Domestic Market U.S. Businesses Growing and Protecting Wealth in the Domestic Market Bernard Winograd Chief Operating Officer United States Businesses Bernard Winograd Chief Operating Officer United States Businesses |
 38 Investor Day 12.04.08 15% 30% 27% 10% 18% 1) As of September 30, 2008; Insurance and Investment Divisions of Financial Services
Businesses; excludes Financial Advisory segment. Attributed Equity of U.S. Businesses (1) Growing Wealth Individual Annuities $3.3 billion Protecting Wealth Retirement $3.7 billion Asset Management $1.8 billion Individual Life $2.2 billion
Group Insurance $1.2 billion Attributed Equity Attributed Equity $12.2 billion $12.2 billion |
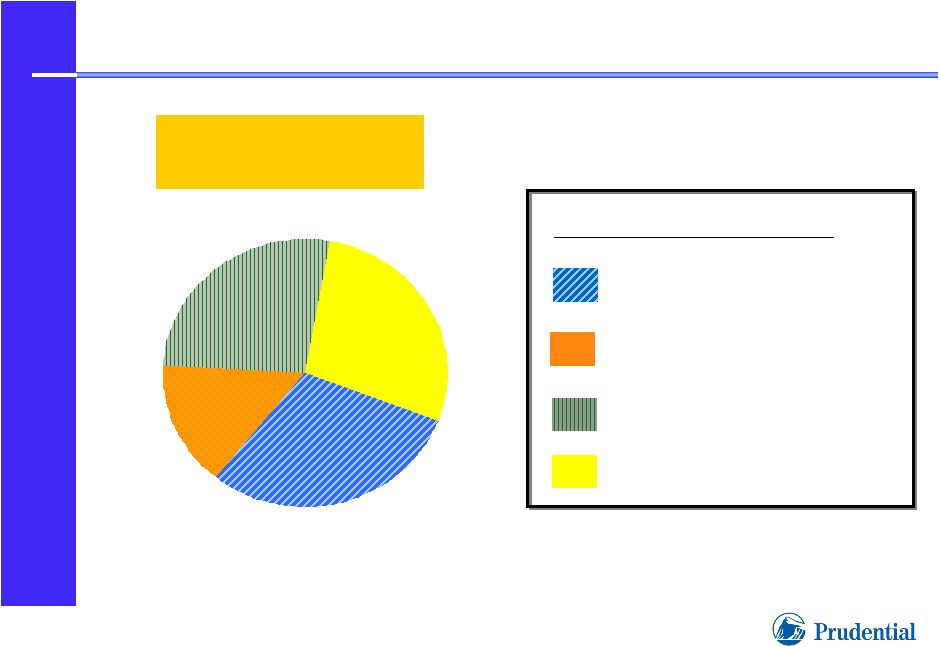 39 Investor Day 12.04.08 Balanced Mix of Business Risks Attributed Equity Attributed Equity $12.2 billion $12.2 billion (1) (1) Primary Business Risks 27% 28% 30% 15% Fixed income and equity markets Equity markets, interest rates, longevity Mortality, morbidity Commercial real estate, debt, equity markets Annuities Retirement Individual Life, Group Insurance Asset Management 1) As of September 30, 2008; Insurance and Investment Divisions of Financial Services
Businesses; excludes Financial Advisory segment.
|
 40 Investor Day 12.04.08 Retirement and Annuities Competitive Advantages • Unique positioning: – Market leading annuity provider – Full Service retirement provider – DB asset manager • Awarded “Best Living Benefits” by Boomer Market Advisor Magazine for fourth consecutive year • Access to Prudential’s risk management and asset management expertise • Proven product innovation capabilities • Distribution breadth, supported by strong branding • Scale allows competitive pricing and broad service capabilities |
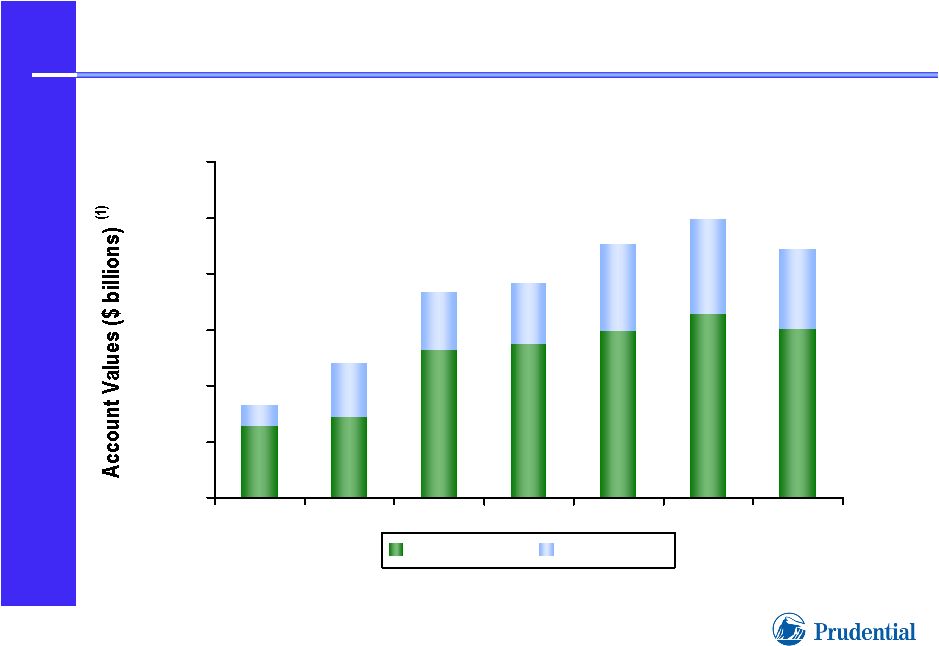 41 Investor Day 12.04.08 A Leading Provider in the U.S. Retirement and Savings Market $0 $50 $100 $150 $200 $250 $300 Retirement Annuities 12/31/02 12/31/03 12/31/04 12/31/05 12/31/06 1) Includes acquired businesses from dates of acquisitions $226 $191 $183 $120 $82 12/31/07 $248 9/30/08 $222 |
 42 Investor Day 12.04.08 1) Source: VARDS 3Q08 and Company data; Advisor-sold market excludes group contracts
and contracts that are primarily sold in employer-sponsored
markets Prudential Annuities is ranked #3 in advisor-sold VA account
values Prudential Annuities is ranked #3 in advisor-sold VA account
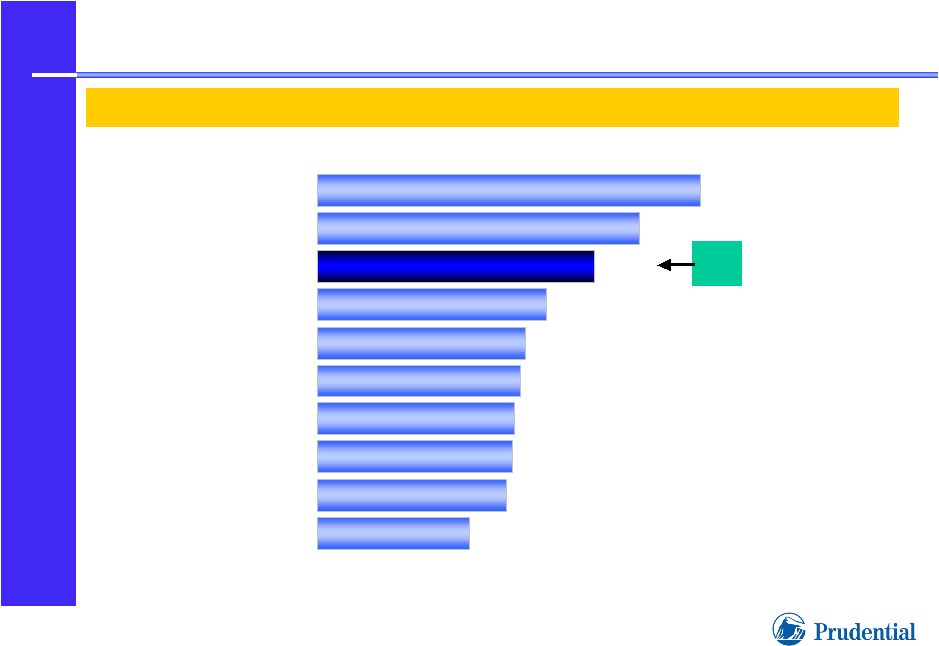
values (1) (1) ($ billions) #3 #3 92.3 77.6 66.7 55.2 50.2 49.0 47.5 46.9 45.7 36.8 Prudential Annuities Top 10 Variable Annuity Company Hartford Met Life Prudential Financial AXA Lincoln Ameriprise John Hancock Pacific Life ING Nationwide |
 43 Investor Day 12.04.08 Variable Annuity Market Trends • Current market conditions: lower sales, account values, and earnings across the industry • Heightened customer interest in downside protection and retirement income security • Risk management strategies tested in current market environment • Increased costs for hedging instruments • Higher DAC amortization and GMDB reserves |
 44 Investor Day 12.04.08 Managing Through Challenging Financial Markets • 47% of account values with living benefits essentially “self hedging” for equity market risk (2) • Long-dated hedging instruments limit exposure to hedge cost volatility Increased cost of hedging instruments • Attractive product features drive strong persistency; positive net sales $2.4 billion for 12 months ended 3Q08 • Asset allocation requirements and auto-rebalancing limit equity market exposure on popular current products Equity market declines lowering variable annuity account values • Opportunity to demonstrate value of unique “Highest Daily” Guarantees; Take Rate 61% (1) Heightened customer interest in downside protection and retirement income security Prudential Positioning Impact of Financial Market Conditions 1) Based on initial premiums; for the nine months ended September 30, 2008 2) As of September 30, 2008 |
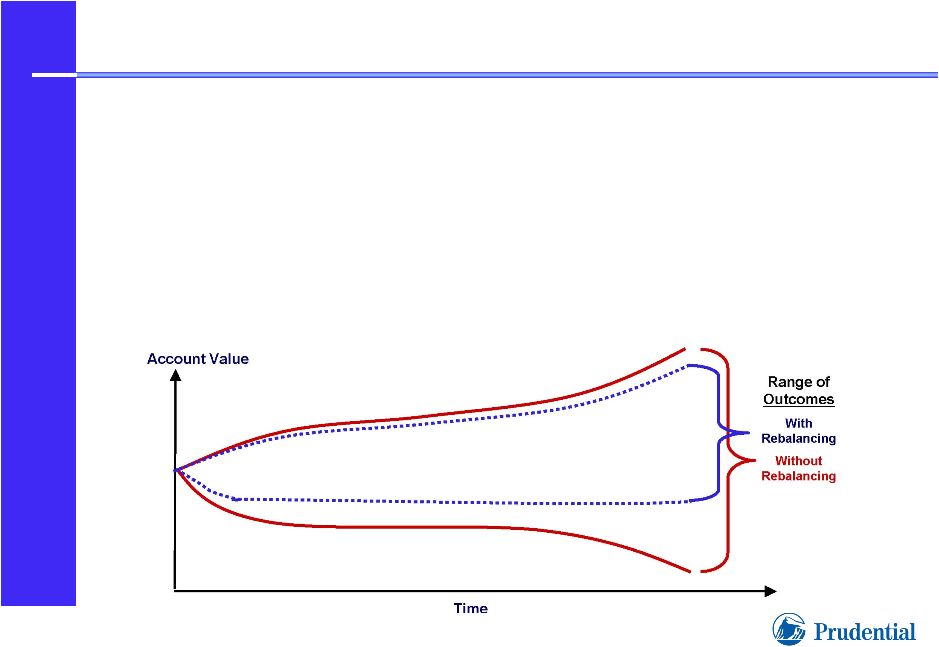 45 Investor Day 12.04.08 Prudential Annuities Active Management of Product Risks • • Current Current Living Benefit (HD) product design minimizes Prudential’s risk while meeting customers’ needs – Highest Daily +7% annual return – Automatic rebalancing narrows the range of possible investment outcomes – As of September 30, 2008, 52% of variable annuity account values had living benefits and 47% of living benefits had the automatic rebalancing feature |
 46 Investor Day 12.04.08 Highest Daily Lifetime Seven • Introduced January 2008 • Withdrawal benefit: 5% - 8% of Protected Value for Life (based on age at first withdrawal) • Initial Protected Value: – Greatest 7% roll-up based on each daily account value (10 years or until first withdrawal); or – Account value at first withdrawal, if greater • Equity Risk Management: “Self-Hedging” feature automatically rebalances customer funds to investment grade bond fund • Cost: 60 basis points x protected withdrawal value (individual); 75 basis points x protected withdrawal value (spousal) |
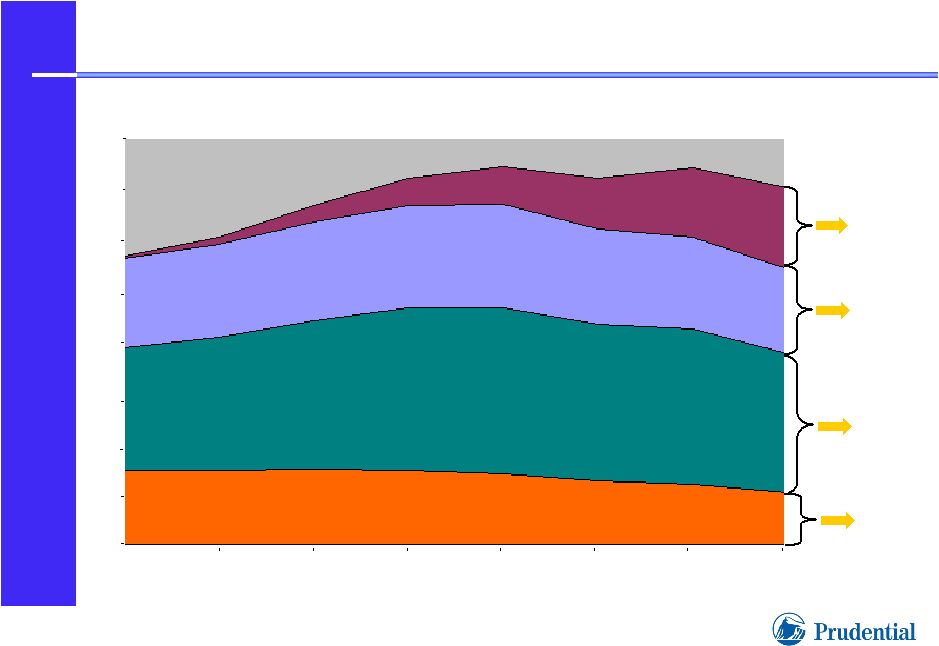 47 Investor Day 12.04.08 $5 $10 $15 $20 $25 $30 $35 $40 4Q06 1Q07 2Q07 3Q07 4Q07 1Q08 2Q08 3Q08 $7.8 Equity Risk Self Hedged; Int. Rate Risk Hedged $13.6 Hedged $8.7 Equity & Int. Rate Risk Self Hedged $5.1 Retain Risk Account Values ($ billions) Living Benefit Product Profile 1) For the nine months ended September 30, 2008 2) Includes Prudential and Allstate business; no significant recent sales 3) Includes LT5, SLT5, GMWB, and Allstate GMAB 4) Includes “GRO” products other than HD GRO 5) Includes HD5, HD7, SHD7, and HD GRO $0 HD Products - 61% election rate (1)(5) “GRO” - 7% election rate (1)(4) Legacy GMWB and GMAB’s - 16% election rate (1) (3) Run-off GMIB (2) |
 48 Investor Day 12.04.08 Impact of Variable Annuity Risk Management on Statutory Capital and Reserves Lower tail risk since modeling accounts for rebalancing under adverse scenarios C3 Phase II: Capital based on tail risk derived from stochastic modeling Statutory Capital Requirements More favorable reserve credit at given level of equity market decline due to operation of rebalancing Account values less sensitive to equity market declines as rebalancing occurs; virtually all in fixed income at 35% - 40% equity market decline “CARVM” reserve credit based on highest potential cash flows to policyholder GMDB reserve based on “shock” of account values for specified asset value declines, followed by recovery at specified rate Statutory Reserve Requirements $16.5 billion (47%) of $35 billion total account values with living benefit features Account values subject to requirements at September 30, 2008 Impact of Automatic Rebalancing Measure |
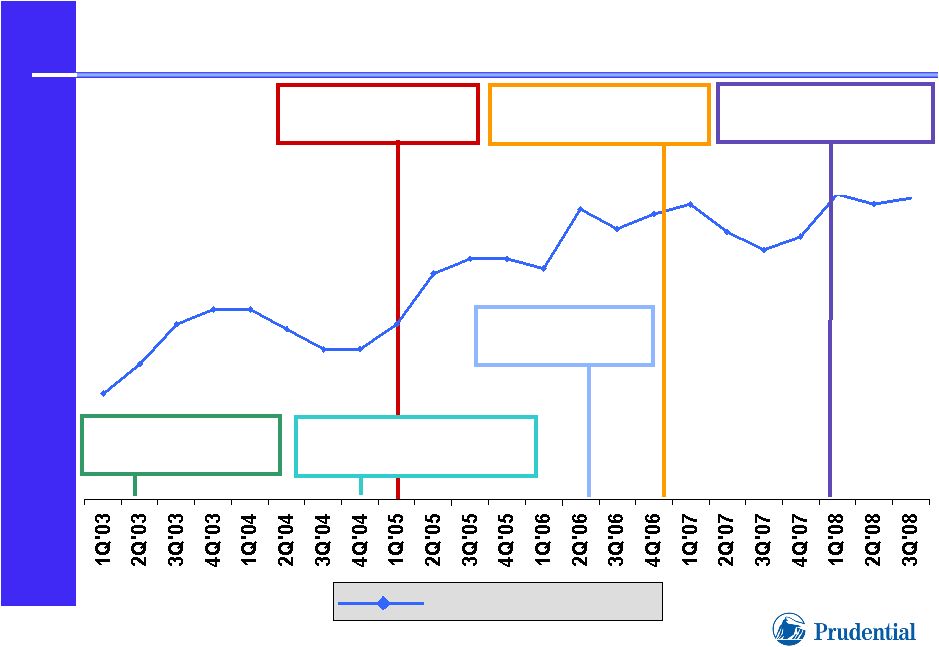 49 Investor Day 12.04.08 4.1% 5.4% 5.5% 6.6% 7.9% 7.3% 7.0% 7.2% 4.7% 5.5% 5.8% 5.8% 5.0% 5.0% 6.5% 6.8% 6.8% 7.8% 7.4% 7.7% 7.9% 8.1% 8.0% Sales Market Share Source: VARDS. Excludes Group/Retirement Plan Contracts June 2006: Allstate Transaction Closes March 2005: Lifetime Five Launch May 2003: American Skandia Acquisition Nov. 2006 : Highest Daily Lifetime Five Launch Jan. 2008: Highest Daily Lifetime Seven Launch Innovative Features Drive Market Share Growth Oct. 2004: American Skandia Systems Conversion |
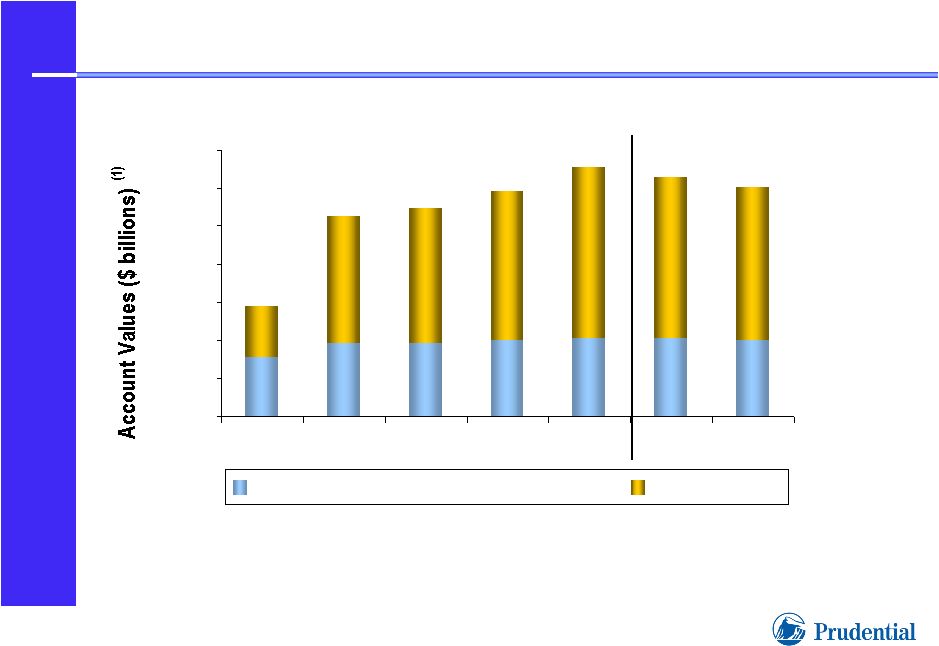 50 Investor Day 12.04.08 Prudential Retirement Emphasis on Full Service Retirement 1) Includes business acquired from CIGNA from April 1, 2004 acquisition date $0 $25 $50 $75 $100 $125 $150 $175 12/31/03 12/31/04 12/31/05 12/31/06 12/31/07 09/30/07 09/30/08 Institutional Investment Products Full Service $151 $157 $148 $136 $132 $72 $164 |
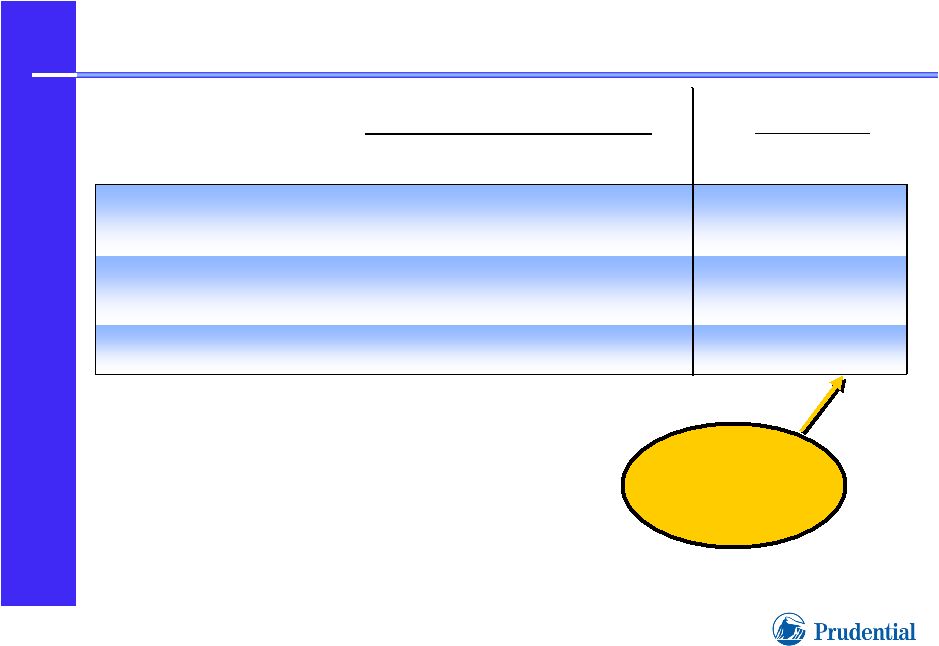 51 Investor Day 12.04.08 Full Service Retirement 112,192 943 $ 14,692 2007 100,463 1,210 $12,392 2008 105,601 97,430 88,385 Account Values (1) 489 $ 10,434 2007 167 $ 16,156 2006 2005 (912) Net Additions (withdrawals) $ 13,006 Gross Deposits and Sales 1) As of end of period 2) For the nine months ended September 30, 2008 95% Persistency 95% Persistency (2) (2) Nine months ended September 30 Year Ended December 31 ($ millions) |
 52 Investor Day 12.04.08 Emphasis on Mid/Large Case and Tax Exempt Markets 1,000,000 1,839,000 Participants (2) $ 33,000 $ 64,100 Account Values (1) (2) Specialized consultants - Fee based consultants - Commission based advisors - Third party administrators - Direct Distribution Channels Primary Products Tax Exempt Market Corporate Markets - DC plans - DB plans - Total Retirement Services - Non-qualified plans - Investment only products 1) In millions 2) As of September 30, 2008; excludes $3.3 billion retail account values for approximately
64,500 participants Emphasis on Emphasis on mid/large mid/large case market case market |
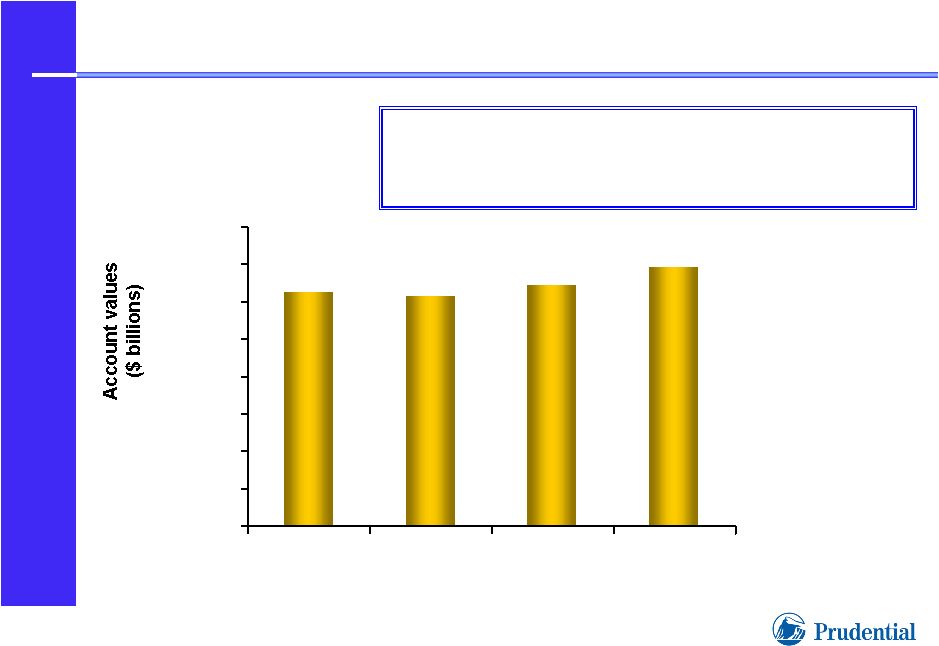 53 Investor Day 12.04.08 0 5 10 15 20 25 30 35 40 12/31/05 12/31/06 12/31/07 09/30/08 Full Service Stable Value $31.3 $30.8 $32.3 • Plan sponsor terminations generally require 3-6 months notice for market value, or 3-6 years for book value cash-out $34.6 |
 54 Investor Day 12.04.08 Full Service Stable Value Products Attractive Value Proposition in Volatile Financial Markets • • Principal guarantee feature attractive to security-minded pre-retirees • Low risk profile – substantially all balances experience-rated, with clients sharing investment risk • Rate resets annually on most products • Future crediting rates typically reflect prior experience • Low interest rate floors; competitive conditions main factor in rate setting |
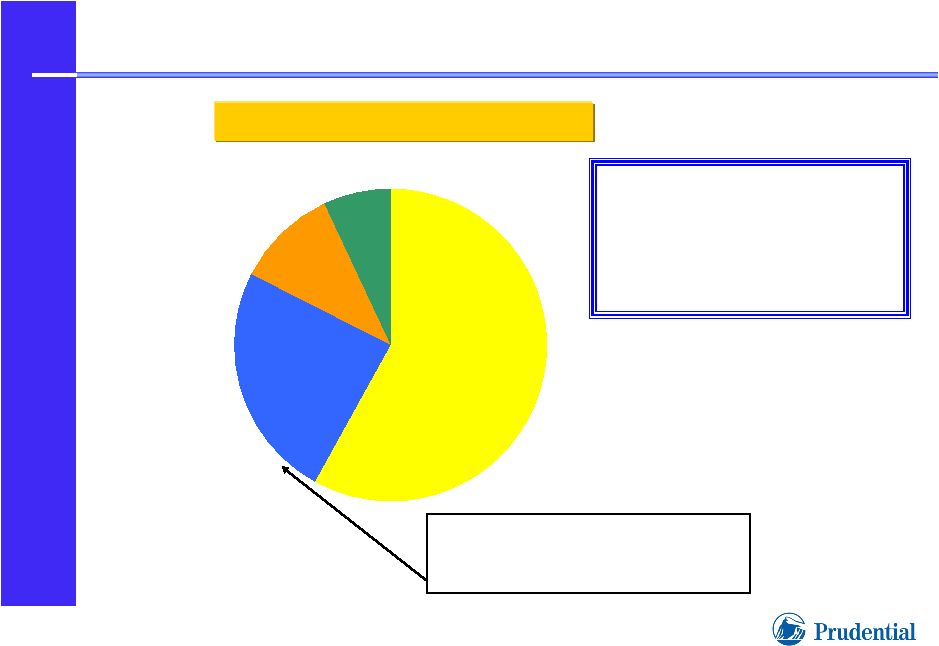 55 Investor Day 12.04.08 $29.0 $12.3 $5.2 $3.5 Institutional Investment Products Account values $50 billion Account values $50 billion (1) (1) 1) As of September 30, 2008 Structured Settlements Group Annuities, Close-out Pensions Funding Agreements, GIC’s, other products Retail Notes • Supported by cash-flow matched investments • Unscheduled withdrawals generally not permitted Virtually no exposure to “putable” GIC’s; $240 million redeemable with one year notice |
 56 Investor Day 12.04.08 Prudential Investment Management Competitive Advantages Scale Scale Scale Brand and Reputation Brand and Brand and Reputation Reputation Experience and Track Record Experience and Experience and Track Record Track Record Breadth and Depth of Capabilities Breadth and Breadth and Depth of Depth of Capabilities Capabilities Access to Capital and Co-investing Access to Capital Access to Capital and Co-investing and Co-investing Institutional Institutional Clients Clients • • $139 billion third $139 billion third party institutional party institutional AUM AUM (1) (1) • • 18% AUM CAGR 18% AUM CAGR (2002 – (2002 – 2007) 2007) Manager Continuity Manager Continuity • • 188 portfolio 188 portfolio managers managers (1) (1) • • Average tenure Average tenure 14 years 14 years 1) As of September 30, 2008; AUM excludes affiliated institutional assets under
management |
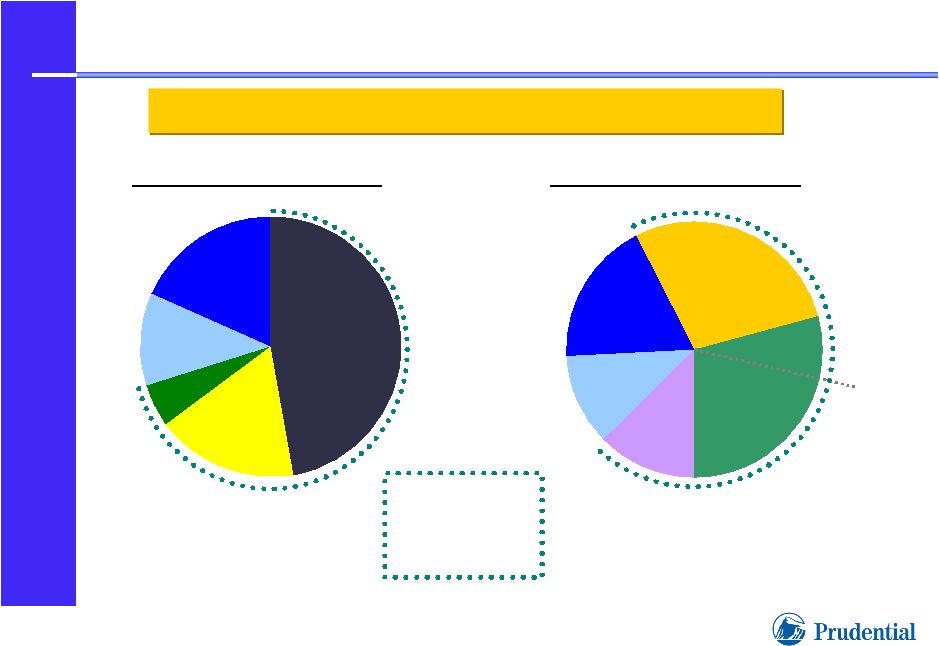 57 Investor Day 12.04.08 28% 29% 18% 12% 13% AUM by Asset Type AUM by Client Type Equity Institutional Customers General Account Retail Customers CB Total AUM $602 billion Total AUM $602 billion (1) (1) 1) As of September 30, 2008 Non- proprietary insurance, annuity & other International Prudential Financial’s AUM Significant Scale and Breadth Asset Management Business $422 billion 47% 18% 12% 5% 18% Non- proprietary insurance, annuity & other Real Estate International Fixed Income |
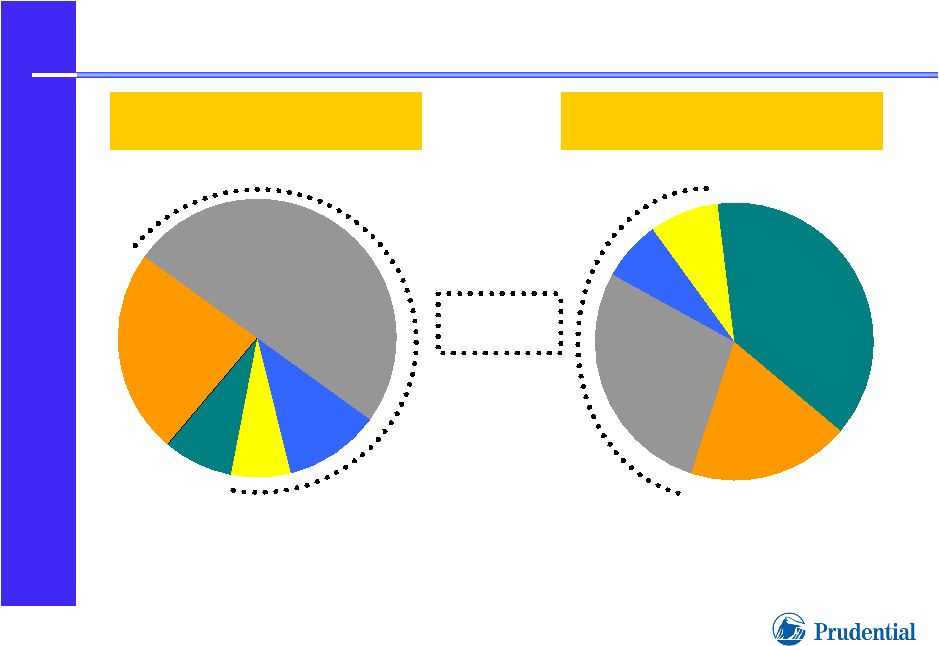 58 Investor Day 12.04.08 Public Equity 24% Public Fixed Income 50% 11% Private Fixed Income 7% Commercial Mortgages 8% Real Estate Assets Under Management Assets Under Management $422 Billion $422 Billion (1) (1) Public Equity (3) 19% Public Fixed Income 28% Private Fixed Income 7% Commercial Mortgages 8% Asset Management Revenue Asset Management Revenue $1.8 Billion $1.8 Billion (2) (2) Real Estate 38% 1) As of September 30, 2008 2) For the year ended December 31, 2007; excludes mutual fund distribution revenues
3) Includes revenue from management of public fixed income securities by Jennison
Associates Fixed Income Broad Asset Class Capabilities |
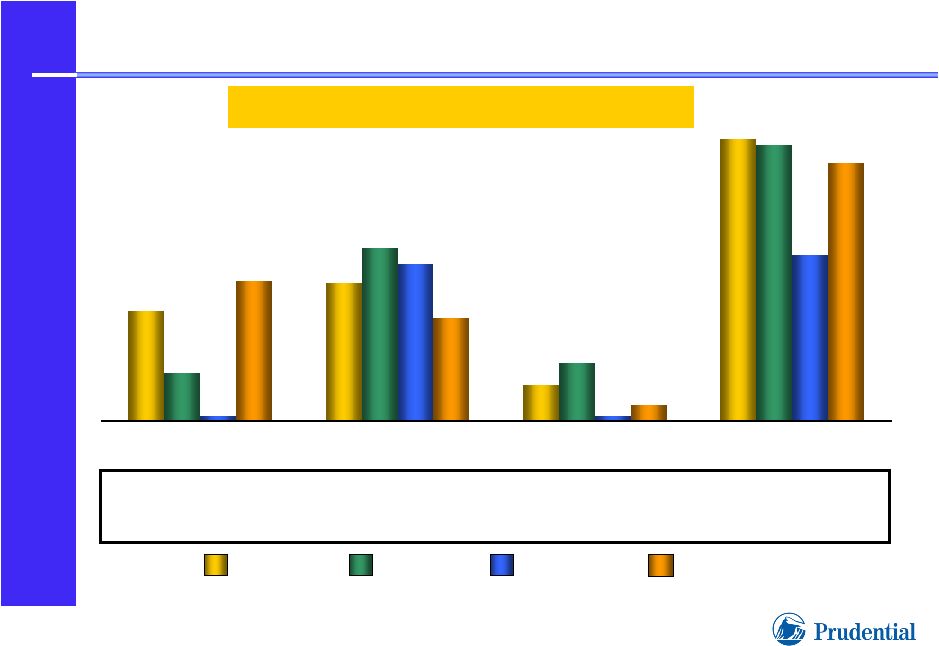 59 Investor Day 12.04.08 Equity Fixed Income Real Estate Total 2005 2006 2007 YTD3Q2008 Third Party Institutional Flows are the Best Indicator of Competitiveness Percent of Beginning of Period Assets (2) 10% 4% 8% 9% 10% 5% 10% 13% 1% 9% 8% 5% 4% 2% 6% Institutional Institutional Net Net Flows Flows ($ ($ billions) billions) (1) (1) 1) Excludes money market funds and the effects of certain nonrecurring transfer and
disposition events. Includes assets transferred from the Retirement
segment. 2) Third party institutional net flows as a percentage of total institutional assets under
management. 10% $5.4 $4.3 $1.4 $11.1 $2.3 $1.8 $6.7 $10.8 $6.5 $0.2 $6.1 $0.2 $10.0 $0.6 $5.4 $4.0 |
 60 Investor Day 12.04.08 $ 701 127 574 1,541 $ 2,115 2007 $ 301 $ 550 Adjusted Operating Income (62) 112 Proprietary Investment Results 363 438 1,081 1,398 Expenses $ 1,444 Nine months ended September 30, 2008 $ 1,836 2006 ($ in millions, pre-tax) Revenues Adjusted Operating Income Adjusted Operating Income Before Proprietary Investments: Before Proprietary Investments: Asset Management Financial Results |
 61 Investor Day 12.04.08 Asset Management Adjusted Operating Income by Business $301 $701 $550 TOTAL 34 71 35 177 112 $272 2007 10 21 Prudential Investments 29 48 Prudential Mortgage Capital Company 29 38 Prudential Capital Group 21 101 Public Fixed Income 47 $165 Nine months ended September 30, 2008 74 $268 2006 ($ in millions, pre-tax) Equity Prudential Real Estate Investors |
 62 Investor Day 12.04.08 Domestic Protection Businesses • Maintain market position: #2 in Group Life (1) • Focus on returns: case selection; appropriate pricing • Generate strong cash flows • Optional life purchases contribute to growth prospects Group Group Insurance Insurance • Focus on returns through capital management, cost- effective distribution • Expanded third party distribution is growth opportunity • Deliver stable earnings and strong cash flows • Mature, low-growth industry • Overcapacity • Commodity products Individual Individual Life Life Prudential Strategies Protection Marketplace 1) Based on A.M. Best ranking of statutory premiums for the year ended December 31,
2007 |
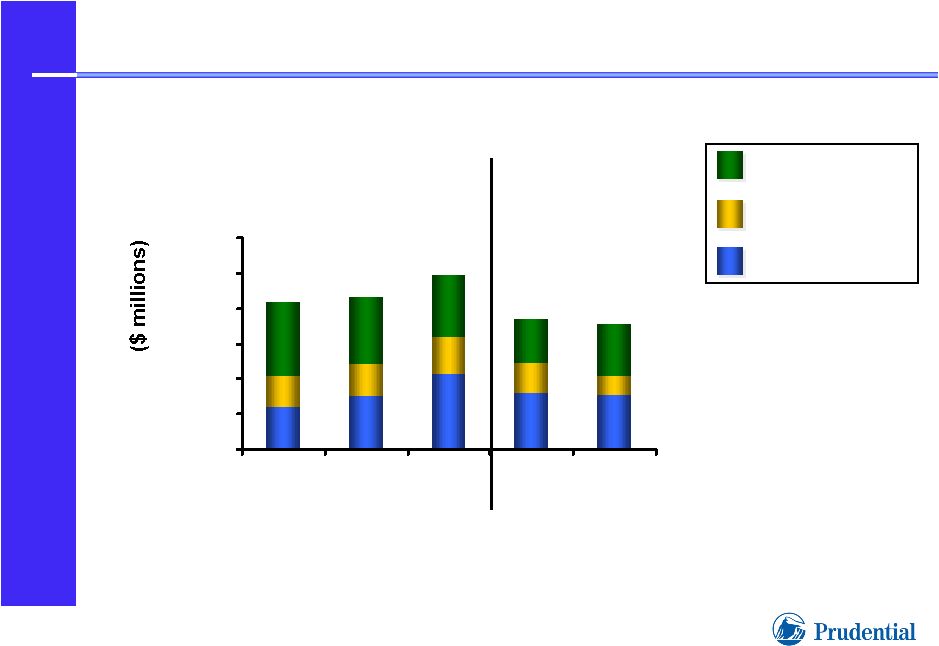 63 Investor Day 12.04.08 $0 $100 $200 $300 $400 $500 $600 2005 2006 2007 3mo 07 3mo 08 Individual Life Sales (1) 1) Scheduled premiums from new sales on an annualized basis and first year excess premiums
and deposits on a cash-received basis, excluding COLI $419 $430 $372 $355 Nine Months ended 9/30/07 Nine Months ended 9/30/08 2006 2005 $494 2007 Universal Life Variable Life Term Life |
 64 Investor Day 12.04.08 Group Insurance • Primarily Group Life business • Controlled growth, with focus on margins • High persistency of quality business • Voluntary life opportunity |
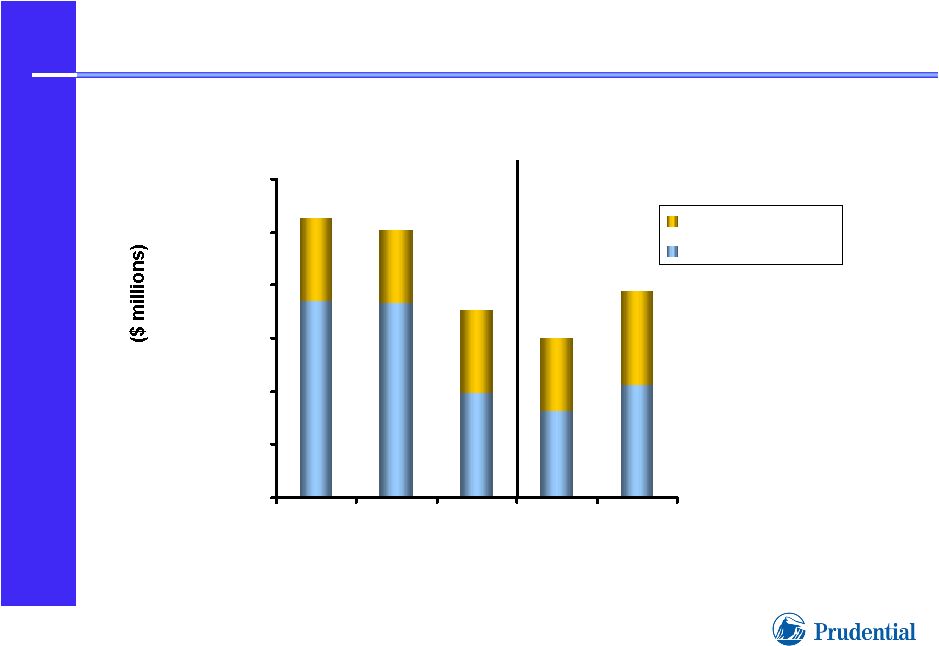 65 Investor Day 12.04.08 Group Insurance Sales (1) 1) New annualized premiums; group disability amounts include long-term care
products $0 $100 $200 $300 $400 $500 $600 2005 2006 2007 9 mos 07 9 mos 08 Group Disability Group Life Nine Months ended 9/30/07 Nine Months ended 9/30/08 2006 2005 2007 $524 $504 $352 $301 $390 |
 66 Investor Day 12.04.08 U.S. Businesses Financial Performance $1,369 $1,369 $2,813 $2,813 $2,420 $2,420 $2,153 $2,153 U.S. Businesses Total U.S. Businesses Total Adjusted operating income Adjusted operating income pre-tax: 271 271 286 286 229 229 224 224 Group Insurance Group Insurance 437 437 622 622 545 545 498 498 Individual Life Individual Life 398 398 482 482 510 510 498 498 Retirement Retirement 301 301 701 701 550 550 427 427 Asset Management Asset Management $ (38) $ (38) $ 722 $ 722 $ 586 $ 586 $ 506 $ 506 Individual Annuities Individual Annuities Nine months ended Sept 30, 2008 2007 2006 2005 ($ in millions) Year Ended December 31, |
 67 Investor Day 12.04.08 U.S. Businesses • Balanced mix of business risks • Leading provider in retirement and savings market • Competitive advantages: product innovation, risk management, asset management, distribution • Domestic protection businesses contribute to earnings and cash flows |
 International Businesses Protecting Wealth and Providing Retirement Security Over A Lifetime International Businesses Protecting Wealth and Providing Retirement Security Over A Lifetime Edward P. Baird Chief Operating Officer International Businesses Edward P. Baird Chief Operating Officer International Businesses |
 69 Investor Day 12.04.08 Where We Are Today • Leadership positions in life planning • Gibraltar generates high ROE’s and cash flows • Growing asset management platforms • Profitability dominated by Japan and Korea • Expanding retirement businesses • Developing multi-channel capabilities • Acquisitions potentially additive |
 70 Investor Day 12.04.08 • Grow organically and through complementary distribution channels and opportunistic acquisitions • Increasing emphasis on meeting retirement needs Key Elements of Our International Strategy • Needs-based selling • Continue building proprietary distribution: recruiting and selection • Historical focus on life insurance • Concentrate on a limited number of attractive countries • Target the affluent and mass affluent consumer • Expanding asset management business |
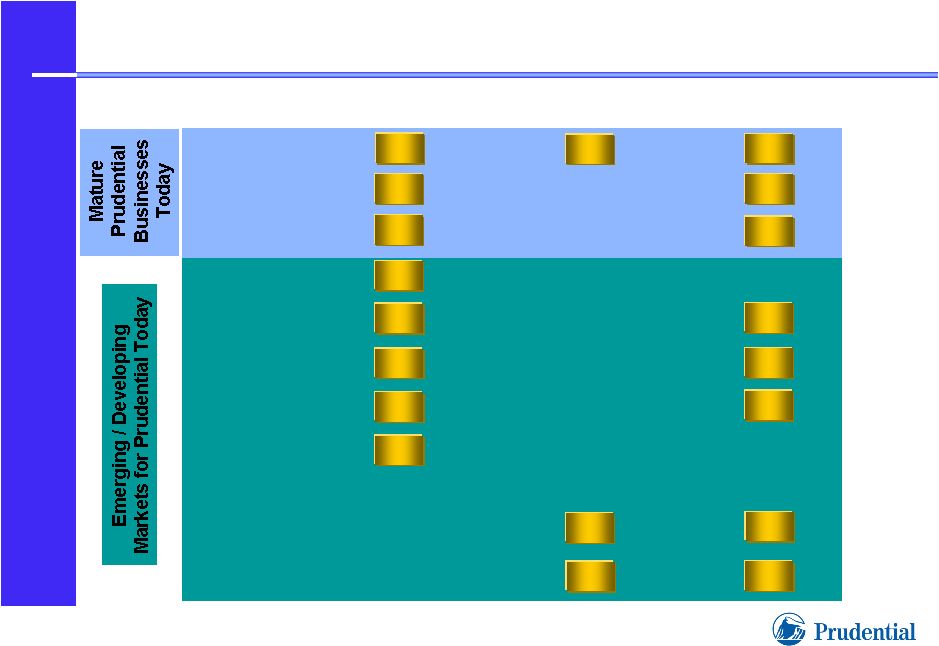 71 Investor Day 12.04.08 International Division Today Italy Poland Brazil Argentina China India Mexico Taiwan Korea Life Planning Insurance Japan International Investments Traditional Insurance |
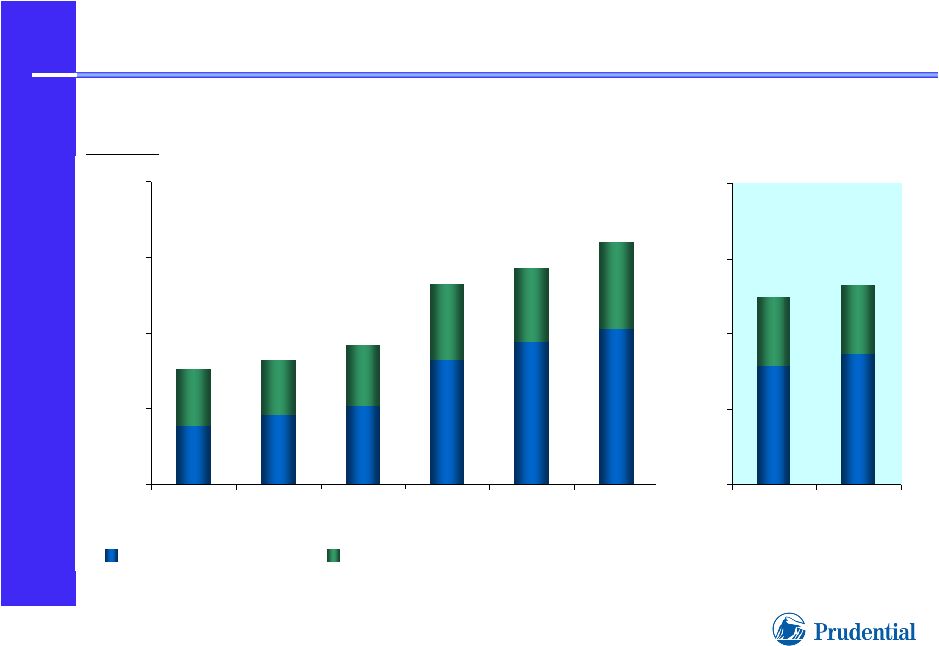 72 Investor Day 12.04.08 1,598 1,428 1,321 917 819 757 $0 $500 $1,000 $1,500 $2,000 2002 2003 2004 2005 2006 2007 Life Planner Ops Gibraltar Life 1,326 1,245 $0 $500 $1,000 $1,500 $2,000 3Q 07 3Q 08 $ millions YTD International Insurance Pre-Tax AOI |
 73 Investor Day 12.04.08 Drivers of Sustainable Financial Performance • • Favorable mortality margins drive Favorable mortality margins drive strong returns strong returns • • High ROE products generate substantial High ROE products generate substantial excess capital excess capital • • Capital management opportunities Capital management opportunities enhance overall returns enhance overall returns • • Duration lengthening supported by long-term Duration lengthening supported by long-term nature of liabilities contributes to returns nature of liabilities contributes to returns • • U.S. dollar investing: Natural hedge for U.S. dollar investing: Natural hedge for Prudential, enhancing portfolio returns Prudential, enhancing portfolio returns • • Strong persistency drives revenue growth Strong persistency drives revenue growth • • Margins earned throughout in-force period Margins earned throughout in-force period • • Business growth increases scale benefits Business growth increases scale benefits Needs-Based Selling Needs-Based Selling Capital Management Capital Management Emphasis on Protection Products Emphasis on Protection Products Investment Portfolio Strategies Investment Portfolio Strategies |
 74 Investor Day 12.04.08 Competitive Advantage Life Planning Insurance • • Life Planner profile similar to Life Planner profile similar to customer profile customer profile • • Life Planner maintains contact with Life Planner maintains contact with client, as trusted professional client, as trusted professional • • Identify protection needs before Identify protection needs before discussing products discussing products • • Protection life insurance purchased Protection life insurance purchased as a solution to identified need as a solution to identified need • • Variable compensation structure Variable compensation structure • • Rewards productivity Rewards productivity and persistency and persistency Life Planners • Very selective recruiting • Highly trained career professional Needs Based Selling • Financial planning approach • Emphasis on protection products Compensation structure • Aligns customer/agent/company interest |
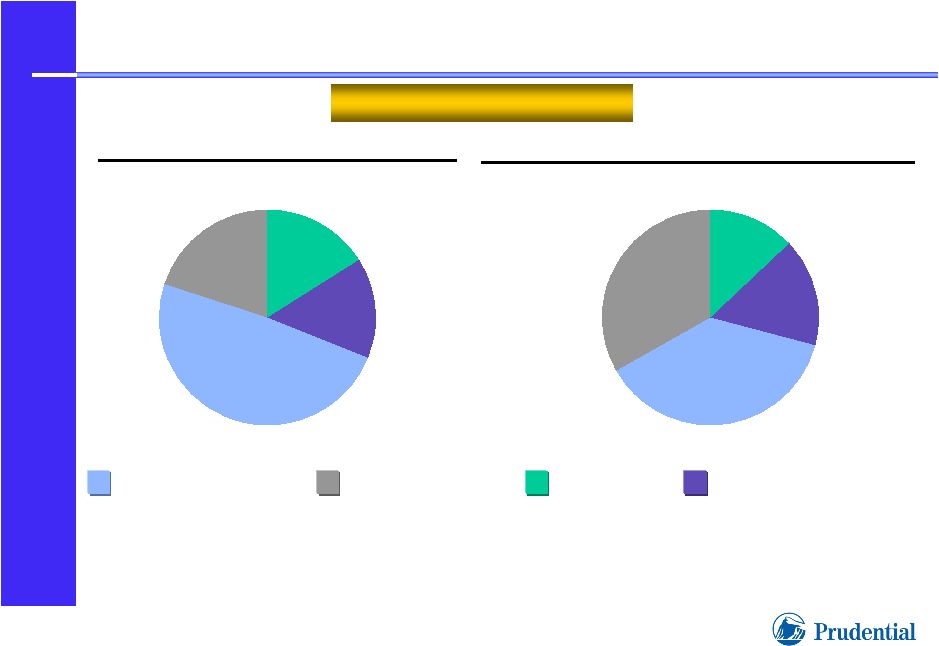 75 Investor Day 12.04.08 In-force Annualized Premium Mix as of September 30, 2008 (1) New Business Annualized Premium Mix 9 months ended September 30, 2008 (1) 20% 20% 49% 49% 16% 16% 15% 15% 33% 33% 38% 38% 13% 13% 16% 16% 1) Includes single premium business at 10% 2) Primarily whole life and term 3) Primarily whole life and retirement income 4) Cancer, medical, accident and sickness; primarily riders 5) Primarily endowment Life Planner Business Emphasis on Protection Products Prudential of Japan Yen-based protection products (2) Yen-based savings and retirement income products (5) Other than Yen- based insurance products (3) Third Sector (4) |
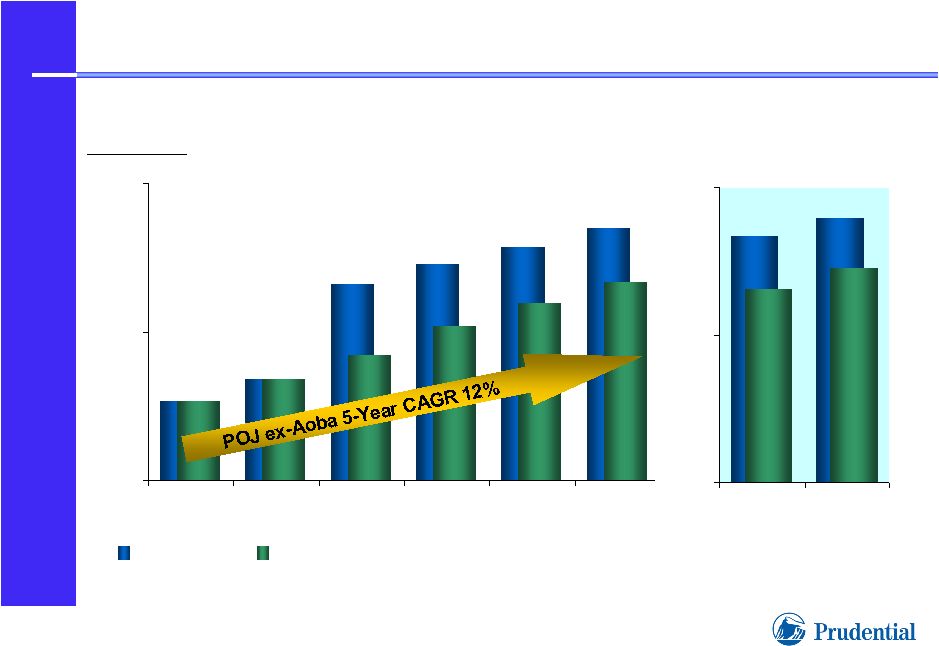 76 Investor Day 12.04.08 1,820 1,956 2,074 1,348 1,538 1,690 1,838 1,037 1,180 2,194 500 1,500 2,500 2002 2003 2004 2005 2006 2007 Total POJ POJ excluding Aoba business In thousands Prudential of Japan Number of Individual Policies In-force (1) YTD 1) Individual Life and Annuities 2,167 2,288 1,803 1,950 500 1,500 2,500 3Q 07 3Q 08 |
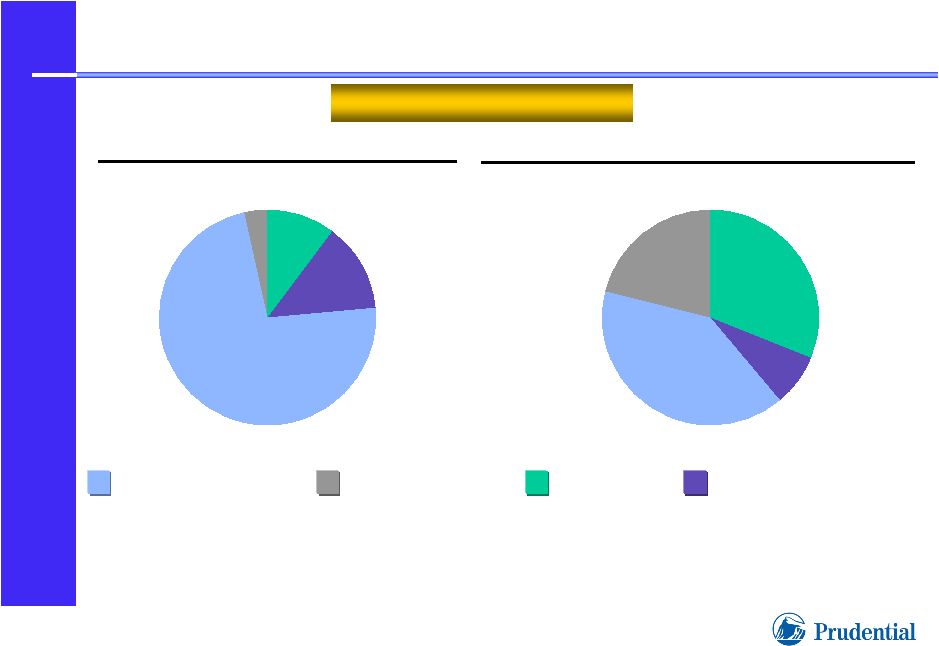 77 Investor Day 12.04.08 Yen-based protection products (2) Yen-based savings and retirement income products (2) Other than Yen- based insurance products In-force Annualized Premium Mix as of September 30, 2008 (1) New Business Annualized Premium Mix 9 months ended September 30, 2008 (1) U.S. Dollar fixed annuities 3% 3% 73% 73% 10% 10% 14% 14% 21% 21% 40% 40% 31% 31% 8% 8% 1) Includes single premium business at 10% 2) Includes third sector products Gibraltar Life Emphasis on Protection Products Gibraltar Life |
 78 Investor Day 12.04.08 Gibraltar
Life
Beyond the Life Advisor
Channel • Strengthening bank channel distribution by transferring Life Planners to bank branch based sales • Banks now commencing sales of life insurance in addition to annuity products • Well-established relationship with Teachers Association positions Gibraltar Life to meet the needs of teachers, including retirement planning • New product development opportunities |
 79 Investor Day 12.04.08 Positioned for International Market Developments Prudential Positioning Prudential Positioning Market Development Market Development Growing Demand for Retirement Accumulation Products Lifetime client relationships Well-established in Retirement Market through Associations Innovative, successful U.S. dollar retirement products |
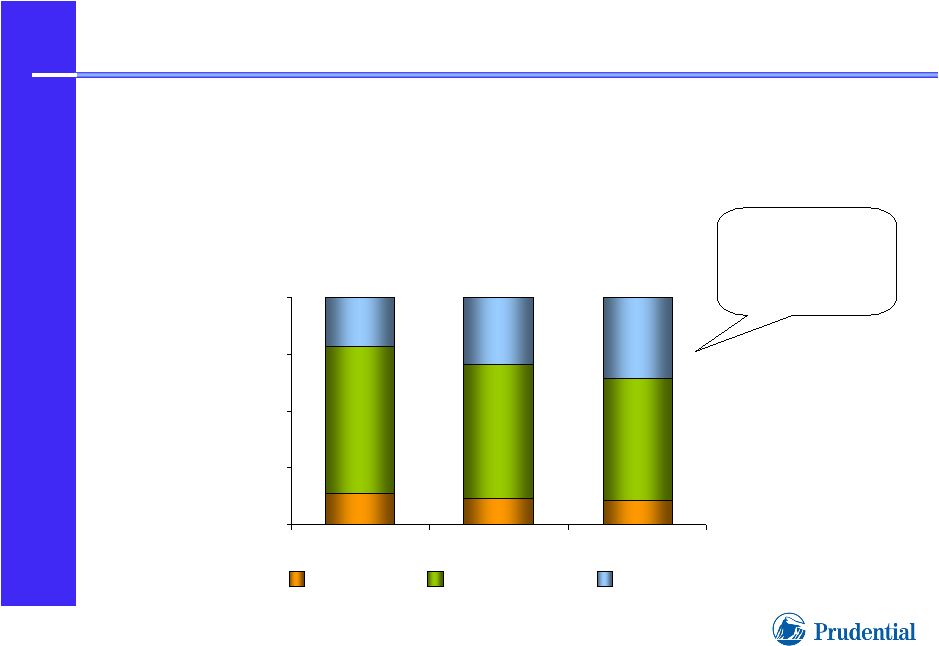 80 Investor Day 12.04.08 Current Population: 127 Million People % of 65+ Age Group: 22% in 2008 30% in 2030 (1) 36% in 2050 (1) Japan’s Demographic Change 14% 14% 11% 11% 11% 11% 64% 64% 59% 59% 53% 53% 22% 22% 30% 30% 36% 36% 0% 25% 50% 75% 100% 2008 2030 2050 Age 0-14 Age 15-64 Age 65+ 1) Source: Population Projections from Japan’s National Institute of Population and
Social Security Research Rapidly growing pre-Retirement/ Retirement Markets |
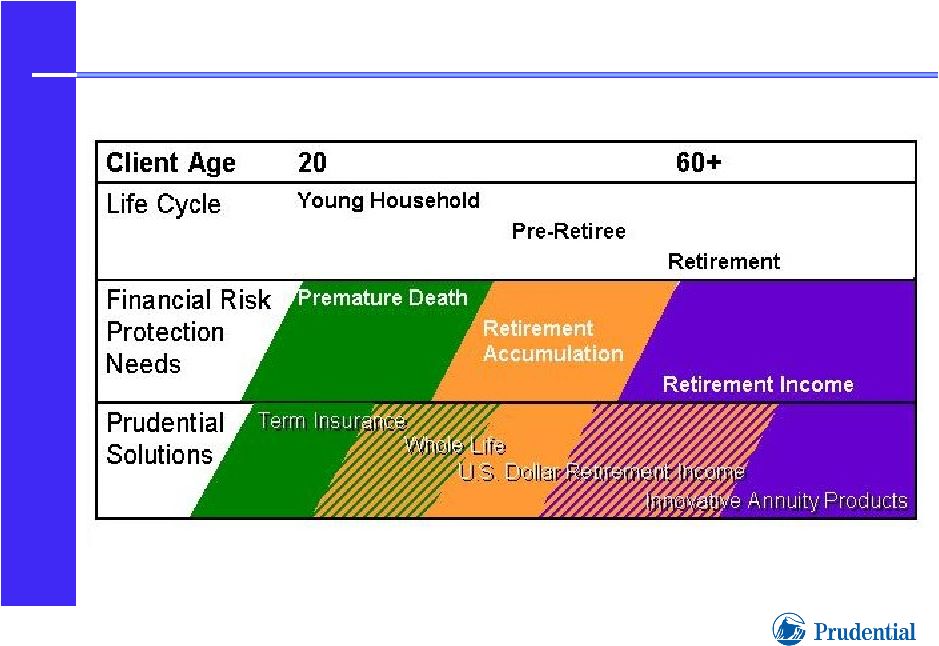 81 Investor Day 12.04.08 Needs-Based Selling Over a Lifetime |
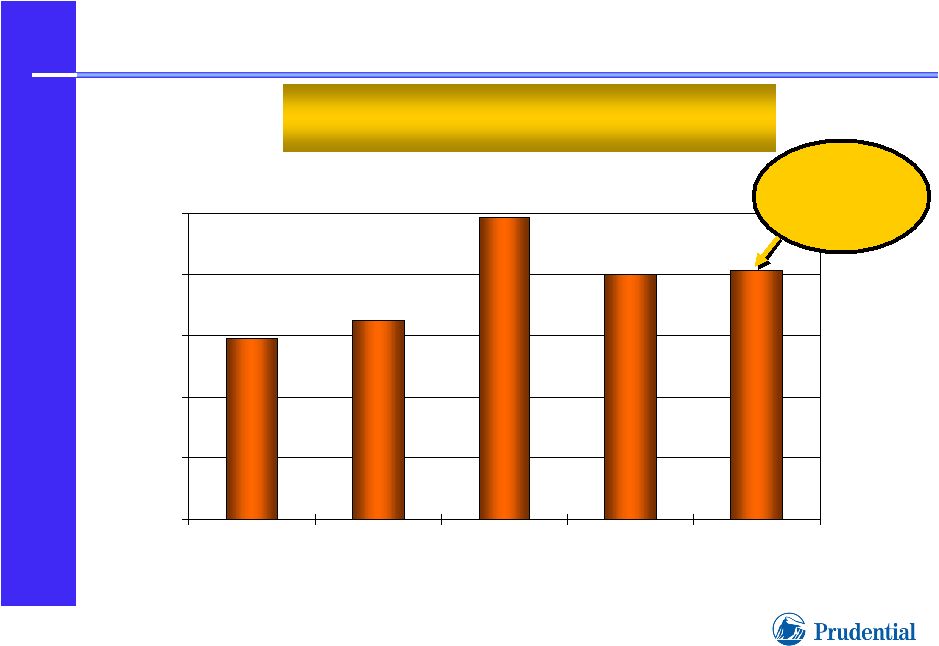 82 Investor Day 12.04.08 $0 $50 $100 $150 $200 $250 2003 2004 2005 2006 2007 Life Planners Serving Client Needs Through a Lifetime Prudential of Japan Second Sales to Existing Customers (1) 1) Translated based on constant exchange rate of 106 Japanese yen per U.S. dollar for all
periods presented Annualized New Business Premiums ($ millions) 39% of Annualized 39% of Annualized New Business New Business Premiums Premiums |
 83 Investor Day 12.04.08 U.S. Dollar Retirement Products Attractive Value Proposition in a Growing Market 43% 23% Rates offered reflect yields on U.S. dollar investments; compare favorably to Japanese yen-based products U.S.$ Fixed U.S.$ Fixed Annuity Annuity U.S.$ Denominated U.S.$ Denominated Retirement Income Retirement Income Prudential of Japan Prudential of Japan U.S.$ Denominated U.S.$ Denominated Retirement Income Retirement Income Gibraltar Life % of September 2008 % of September 2008 YTD Sales YTD Sales (1) (1) Attractive Yields for Attractive Yields for Japanese Market Japanese Market Flexibility Flexibility Retirement Retirement Accumulation Accumulation Death Protection Death Protection Benefits Benefits 1) Based on annualized new business premiums; translation of Japanese yen-based sales
at 106 Japanese yen per U.S. dollar |
 84 Investor Day 12.04.08 Mortality Expense Investment Retirement Accumulation Products Contribute to High Product Portfolio ROE Potential Targeted 20+% ROE Portfolio Targeted 20+% ROE Portfolio USD Whole Life Term USD Annuity USD Retirement Income |
 85 Investor Day 12.04.08 Positioned for International Market Developments Greater Regulatory Standards Govern Product Distribution Full-time, college-educated Life Planner force Proven training for all channels Superior agent retention Prudential Positioning Prudential Positioning Market Development Market Development Growing Demand for Retirement Accumulation Products Lifetime client relationships Well-established in Retirement Market through Associations Innovative, successful U.S. dollar retirement products |
 86 Investor Day 12.04.08 Positioned for International Market Developments Expanding Distribution Channels Established bank distribution relationships Gibraltar distributors “seconded” to Bank Channel Greater Regulatory Standards Govern Product Distribution Full-time, college-educated Life Planner force Proven training for all channels Superior agent retention Prudential Positioning Prudential Positioning Market Development Market Development Growing Demand for Retirement Accumulation Products Lifetime client relationships Well-established in Retirement Market through Associations Innovative, successful U.S. dollar retirement products |
 87 Investor Day 12.04.08 Enhancing Returns Through Proven Strategies Investment Portfolio • U.S. dollar investments • Extending duration • Asset class diversification Access to Prudential Resources • Product and distribution channel skills • Experience in the U.S. Retirement business Opportunities for Expense Synergies • Shared management resources • System integration • Common back office platforms |
 88 Investor Day 12.04.08 Investment Portfolio Opportunities Access to Prudential skill sets – commercial mortgages, corporate credit Equities support portion of long-dated risks Asset Class Diversification Extending asset duration reduces risk profile relative to long-dated liabilities while increasing yield Duration Lengthening “Natural hedge” for GAAP equity Additional U.S. dollar exposure related to economic value U.S. Dollar Investment Exposure |
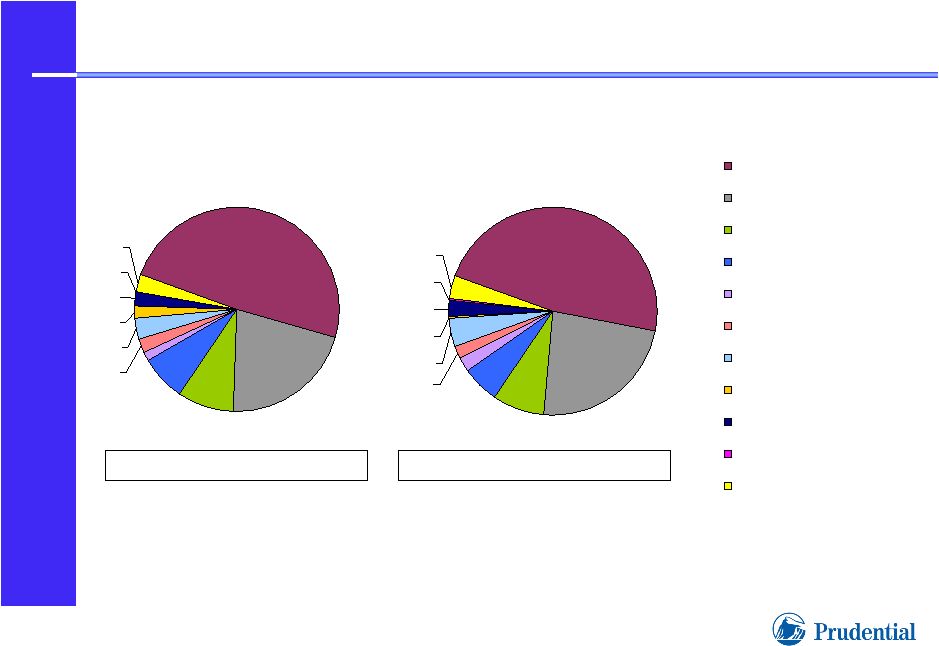 89 Investor Day 12.04.08 8% 6% 4% 0% 2% 4% 2% 1% 47% 24% 2% Government/Government related (primarily Japanese Gov't Bonds) Investment Grade Corporate Bonds (Aaa, Aa, A) Investment Grade Corporate Bonds (Baa or BBB) Commercial Loans Below Investment Grade Corporate Bonds Real Estate Equity Securities Short-Term Policy Loans U.S. Treasury Bonds Other (2) 21% 9% 7% 3% 2% 2% 0% 3% 2% 50% 1% Prudential International Insurance Japan Portfolios (1) 1) Includes U.S. dollar reinsurance activity 2) “Other” category includes Trading Account Assets and Other Long-term Investments Yen Portfolio Duration: 8 years Yen Portfolio Duration: 11 years December 31, 2004 September 30, 2008 |
 90 Investor Day 12.04.08 2007 Nine months ended Sept 30, 2008 International Division Financial Performance 1) Based on annualized after-tax adjusted operating income for the nine months ended
September 30, 2008 Adjusted operating income pre-tax: Life Planner Business Gibraltar Life International Insurance International Investments International Division $515 402 917 77 $994 $821 500 1,321 106 $1,427 $938 490 1,428 143 $1,571 $1,020 578 1,598 259 $1,857 $864 462 1,326 89 $1,415 Year Ended December 31, 2004 2005 2006 ($ millions) 24% ROE (1) |
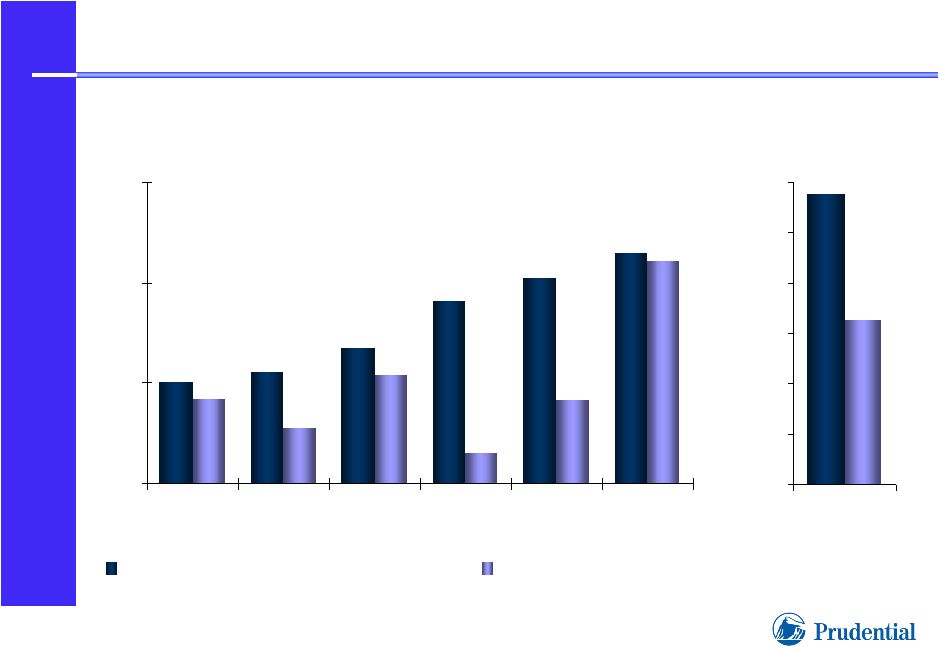 91 Investor Day 12.04.08 Prudential International Insurance Capital Redeployment $ millions 419 273 541 151 1,104 414 505 552 672 905 1,142 1,021 3,268 5,778 $0 $500 $1,000 $1,500 2002 2003 2004 2005 2006 2007 After Tax Adjusted Operating income Capital Redeployment $0 $1,000 $2,000 $3,000 $4,000 $5,000 $6,000 Cumulative 2002 - 09/30/08 |
 92 Investor Day 12.04.08 • Sustainable AOI growth at solid double-digit rates • Sustainable 20% ROE’s • Strong free cash flow • Complementary group of International businesses with short and long-term growth potential International Divisional Goals |