SLIDE PRESENTATION OF PRUDENTIAL FINANCIAL, INC.
Published on
 Exhibit 99.1 |
 Investor Day 6.9.2011
1
Forward-Looking Statements
Forward-Looking Statements
Certain of the statements included in this presentation constitute forward-looking statements
within the meaning of the U. S. Private Securities Litigation Reform Act of 1995. It is
possible that actual results may differ materially from any expectations or predictions expressed in this presentation. Words such as “expects,”
“believes,” “anticipates,” “includes,” “plans,”
“assumes,” “estimates,” “projects,” “intends,” “should,” “will,” “shall,” or variations of such words are generally part of
forward-looking statements. Forward-looking statements are made based on
management’s current expectations and beliefs concerning future developments and their
potential effects upon Prudential Financial, Inc. and its subsidiaries. There can be no assurance that future developments affecting Prudential Financial, Inc.
and its subsidiaries will be those anticipated by management. These forward-looking statements are
not a guarantee of future performance and involve risks and uncertainties, and there are certain
important factors that could cause actual results to differ, possibly materially, from expectations or estimates reflected in such
forward-looking statements, including, among others: (1) general economic, market and
political conditions, including the performance and fluctuations of fixed income, equity, real
estate and other financial markets; (2) the availability and cost of additional debt or equity capital or external financing for our operations;
(3) interest rate fluctuations or prolonged periods of low interest rates; (4) the degree to which we
choose not to hedge risks, or the potential ineffectiveness or insufficiency of hedging or risk
management strategies we do implement, with regard to variable annuity or other product guarantees; (5) any inability to access our
credit facilities; (6) reestimates of our reserves for future policy benefits and claims; (7)
differences between actual experience regarding mortality, morbidity, persistency, surrender
experience, interest rates or market returns and the assumptions we use in pricing our products, establishing liabilities and reserves or for
other purposes; (8) changes in our assumptions related to deferred policy acquisition costs, valuation
of business acquired or goodwill; (9) changes in assumptions for
retirement expense; (10) changes in our financial strength or credit ratings; (11) statutory reserve
requirements associated with term and universal life insurance policies under Regulation XXX and
Guideline AXXX; (12) investment losses, defaults and counterparty non-performance; (13) competition in our product
lines and for personnel; (14) difficulties in marketing and distributing products through current or
future distribution channels; (15) changes in tax law; (16) economic, political, currency and
other risks relating to our international operations; (17) fluctuations in foreign currency exchange rates and foreign securities
markets; (18) regulatory or legislative changes, including the recently enacted Dodd-Frank Wall
Street Reform and Consumer Protection Act; (19) inability to protect our intellectual property
rights or claims of infringement of the intellectual property rights of others; (20) adverse determinations in litigation or regulatory
matters and our exposure to contingent liabilities, including in connection with our divestiture or
winding down of businesses; (21) domestic or international military actions, natural or
man-made disasters including terrorist activities or pandemic disease, or other events resulting in catastrophic loss of life; (22) ineffectiveness of
risk management policies and procedures in identifying, monitoring and managing risks; (23)
effects of acquisitions, divestitures and restructurings, including possible difficulties in
integrating and realizing the projected results of acquisitions, including risks associated with the recent acquisition of certain insurance
operations in Japan; (24) interruption in telecommunication, information technology or other
operational systems or failure to maintain the security, confidentiality or privacy of sensitive
data on such systems; (25) changes in statutory or U.S. GAAP accounting principles, practices or policies; (26) Prudential Financial, Inc.’s
primary reliance, as a holding company, on dividends or distributions from its subsidiaries to meet
debt payment obligations and the ability of the subsidiaries to pay such dividends or
distributions in light of our ratings objectives and/or applicable regulatory restrictions; and (27) risks due to the lack of legal separation
between our Financial Services Businesses and our Closed Block Business. Prudential Financial, Inc.
does not intend, and is under no obligation, to update any particular forward-looking
statement included in this presentation. Prudential Financial, Inc. of the United States is not affiliated with Prudential PLC which is
headquartered in the United Kingdom. |
 Investor Day 6.9.2011
2
Non–GAAP Measures
Non–GAAP Measures
This presentation includes references to “adjusted operating income.” Adjusted operating
income is a non-GAAP measure of performance of our Financial Service Businesses
(“FSB”). Adjusted operating income excludes “Realized investment gains (losses), net,” as adjusted, and related charges and adjustments. A
significant element of realized investment gains and losses are impairments and credit-related and
interest rate-related gains and losses. Impairments and losses from sales of
credit-impaired securities, the timing of which depends largely on market credit cycles, can vary considerably across periods. The timing of other
sales that would result in gains or losses, such as interest rate-related gains or losses, is
largely subject to our discretion and influenced by market opportunities as well as our tax and
capital profile. Realized investment gains (losses) within certain of our businesses for which such gains (losses) are a
principal source of earnings, and those associated with terminating hedges of foreign currency
earnings and current period yield adjustments are included in adjusted operating income. Adjusted operating income
excludes realized investment gains and losses from products that contain embedded derivatives, and from
associated derivative portfolios that are part of a hedging program related to the risk of those
products. Adjusted operating income also excludes gains and losses from changes in value of certain assets and
liabilities relating to foreign currency exchange movements that have been economically hedged or
considered part of our capital funding strategies for our international subsidiaries, as well as
gains and losses on certain investments that are classified as other trading account assets.
Adjusted operating income also excludes investment gains and losses on trading account assets supporting
insurance liabilities and changes in experience-rated contractholder liabilities due to asset
value changes, because these recorded changes in asset and liability values are expected to ultimately accrue to
contractholders. Trends in the underlying profitability of our businesses can be more clearly identified
without the fluctuating effects of these transactions. In addition, adjusted operating income
excludes the results of divested businesses, which are not relevant to our ongoing operations. Discontinued operations, which
is presented as a separate component of net income under GAAP, is also excluded from adjusted operating
income. We believe that the presentation of adjusted operating income as we measure it for management purposes
enhances understanding of the results of operations of the Financial Services Businesses by
highlighting the results from ongoing operations and the underlying profitability of our businesses. However, adjusted
operating income is not a substitute for income determined in accordance with GAAP, and the adjustments
made to derive adjusted operating income are important to an understanding of our overall results
of operations. Return on equity (“ROE”) based on adjusted operating income is determined by dividing adjusted
operating income after-tax (giving effect to the direct equity adjustment for earnings per
share calculation) by average attributed equity for the Financial Services Businesses excluding accumulated other comprehensive
income related to unrealized gains and losses on investments and accumulated other comprehensive income
related to pension and postretirement benefits. Our expectations of ROE potential are based on after-tax adjusted operating income. Because we do
not predict future realized investment gains / losses or recorded changes in asset and liability
values that are expected to ultimately accrue to contractholders, we cannot provide a measure of our ROE expectations
based on income from continuing operations of the Financial Services Businesses, which is the GAAP
measure most comparable to adjusted operating income. For additional information about adjusted operating income and the comparable GAAP measure, including
reconciliation between the two, please refer to our Annual Report on Form 10-K for the year
ended December 31, 2010 and our Quarterly Report on Form 10-Q for the quarter ended March 31, 2011 located on the
Investor Relations Web site at www.investor.prudential.com.
Additional historical information relating to the Company’s financial performance, including its first
quarter 2011 Quarterly Financial Supplement, is also located on the Investor Relations website.
The information referred to above and on the prior page, as well as the risks of our businesses
described in our Annual Report on Form 10-K for the year ended December 31, 2010, should be
considered when reviewing forward-looking statements contained in this presentation. |
 Investor Day 6.9.2011
3
Reconciliation for Individual Annuities pre-tax adjusted
Reconciliation for Individual Annuities pre-tax adjusted
operating income excluding disclosed items
operating income excluding disclosed items
2011
1Q
2Q
3Q
4Q
1Q
2Q
3Q
4Q
1Q
Individual Annuities pre-tax adjusted operating income (loss)
(244)
489
315
197
244
(131)
588
345
292
Reconciling items:
Amortization of deferred policy acquisition and other costs
(1)
112
(142)
(26)
(32)
(21)
88
(245)
(46)
(19)
Change in reserves for guaranteed minimum death and income benefits
(1)
215
(274)
(185)
(47)
(53)
196
(167)
(100)
(40)
Other
(2)
-
-
-
-
(25)
-
-
-
-
Individual Annuities pre-tax adjusted operating income
excluding disclosed items indicated above
83
73
104
118
145
153
176
199
233
2009
2010
1) Reflects impact of market performance, actual-to-expected result differences, and
changes in assumptions used in projecting gross profits and claims. 2) Includes
refinements based on review and settlement of reinsurance contracts related to acquired business. |
 PRUDENTIAL FINANCIAL, INC.
JOHN STRANGFELD
CHAIRMAN AND CEO
|
 Investor Day 6.9.2011
Prudential Today
Prudential Today
1
•
Attractive return opportunities in high quality businesses, supported by
strong balance sheet
•
Balanced portfolio of selected risks; improving risk profile
•
Expanding distribution: market leadership across multiple channels
•
Growth engines in International Insurance, Annuities and
Asset Management
•
Capital management: balanced approach to investing in businesses,
returning capital to investors
•
Proven acquisition and integration track record
•
Seasoned management team; focus on talent and leadership
|
 Investor Day 6.9.2011
Leadership Positions in Chosen Markets
Leadership Positions in Chosen Markets
Rank
Rank
Business
Business
Metric
Metric
As of
As of
1
Variable Annuities
Sales (Advisor-sold)
1Q ’11
2
Stable Value
Assets
4Q ’10
7
Defined Contribution
Assets managed
2010
7
Defined Benefit
Assets managed
2010
3
Term Life
New annualized premiums
1Q ’11
2
Group Life
In-force premiums
4Q ’10
4
International Insurance
New business face amount in Japan
Dec. 2010
Sources: LIMRA, VARDS, PlanSponsor, Pensions & Investments, Life
Insurance Association of Japan (excluding Japan Post Insurance) 2
A set of businesses that are diverse, healthy and competitive in
A set of businesses that are diverse, healthy and competitive in
their markets
their markets |
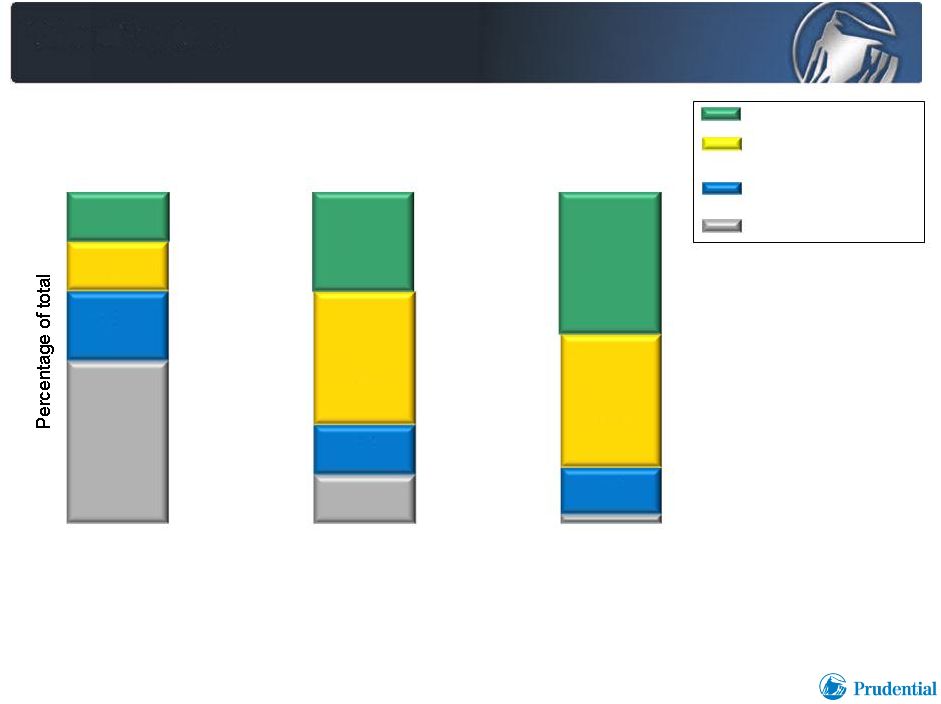 Equity Deployment to a Superior Mix of
High Quality Businesses
High Quality Businesses
$18.4 Billion
(1)
12/31/10
12/31/02
$29.2 Billion
(1)
$30.1 Billion
(1)
International Insurance
Annuities, Retirement &
Asset Management
Individual Life &
Group Insurance
Corporate & Other
(2)
3/31/11
3
3%
49%
21%
15%
15%
15%
15%
30%
40%
43%
14%
40%
Investor Day 6.9.2011
1)
Attributed equity of Financial Services Businesses, including Corporate and Other; excludes
accumulated other comprehensive income related to unrealized gains and losses on investments
for all periods presented and excludes accumulated other comprehensive income related to pension and
postretirement benefits for December 31, 2010 and March 31, 2011.
2)
Includes divested businesses.
|
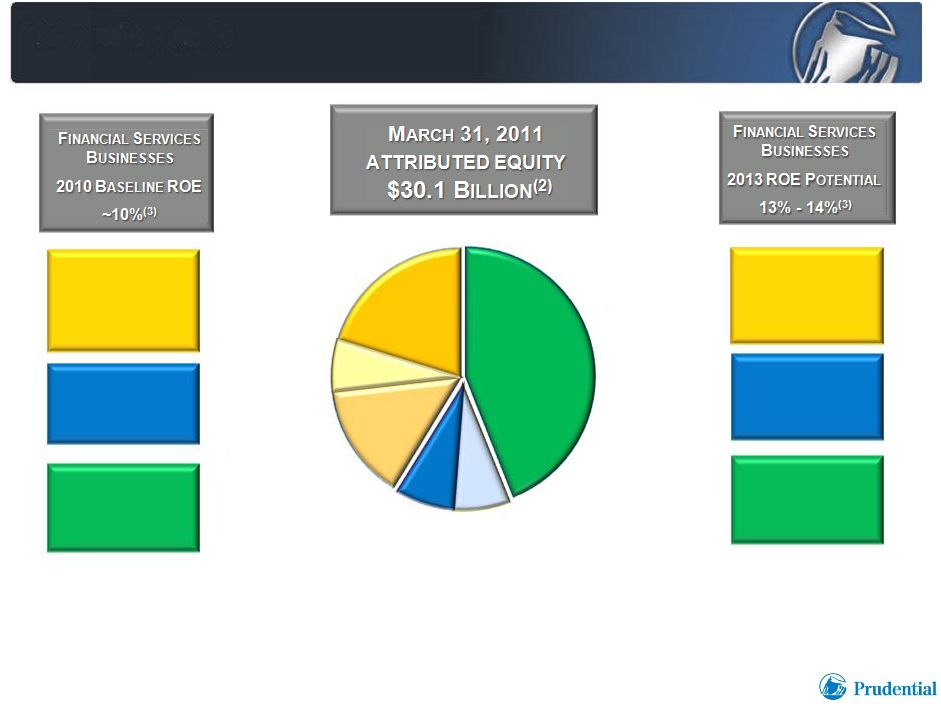 High
Quality Mix of Businesses with Superior ROE Prospects
(1)
4
1)
Business unit ROE’s are unlevered and are based on FSB effective tax rate
applicable to Adjusted Operating Income. 2)
Attributed equity of Financial Services Businesses as of March 31, 2011, excluding
accumulated other comprehensive income related to unrealized gains and losses
on
investments
and
pension
and
postretirement
benefits;
includes
$1.0
billion
attributed
to
Corporate
and
Other.
3)
Includes Corporate & Other results, including costs of Capital Debt.
Annuities,
Retirement & Asset
Mgmt
2010 Baseline ROE
11% -
12%
Individual Life &
Individual Life &
Group Ins
Group Ins
2010 Baseline ROE
2010 Baseline ROE
11%
11%
-
-
12%
12%
International
International
Insurance
Insurance
2010 Baseline ROE
2010 Baseline ROE
19%
19%
-
-
20%
20%
Annuities,
Retirement & Asset
Mgmt
2013 ROE Potential
14% -
15%
Individual Life &
Individual Life &
Group Ins
Group Ins
2013 ROE Potential
2013 ROE Potential
12%
12%
-
-
13%
13%
International
International
Insurance
Insurance
2013 ROE Potential
2013 ROE Potential
17%
17%
-
-
18%
18%
Group
Insurance
$2.1B
Individual
Life $2.2B
Retirement
$4.2B
Asset
Management
$1.9B
Individual
Annuities
$5.9B
International
Insurance
$12.8B
Investor Day 6.9.2011 |
 |
 Investor Day 6.9.2011
Capital Deployment
“Then”
and “Now”
1
•
Defense
•
Offense
•
Offense
•
Defense
Circa 2008 -
Circa 2008 -
2009
2009
2011
2011 |
 Investor Day 6.9.2011
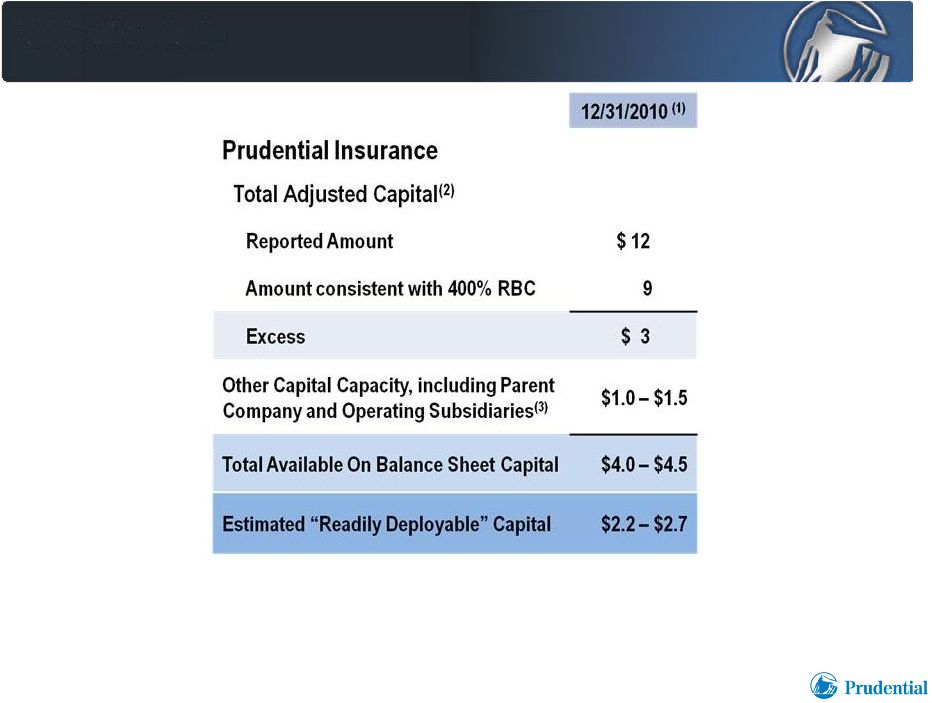
Strong Capital Position
2
1)
Pro-forma for Star/Edison acquisition which closed February 1, 2011 and Global Commodities
business divestiture expected to close in second quarter 2011; in billions.
2)
As reported on statutory basis.
3)
Reflects targeted statutory ratios in domestic and international regulated entities consistent with
“AA” ratings objectives. |
 Investor Day 6.9.2011
Capital Management and Business Approach
3
Capital Management
Capital Management
Begins with
Begins with
Selection of
Selection of
Businesses
Businesses
and Risks
and Risks
•
High value-added
business models
•
Credible diversification
in mix of businesses
and risks
•
Consistent with
established strategies
•
Fit with proven execution
and risk management
capabilities
•
Contribution to
ROE prospects
and growth potential |
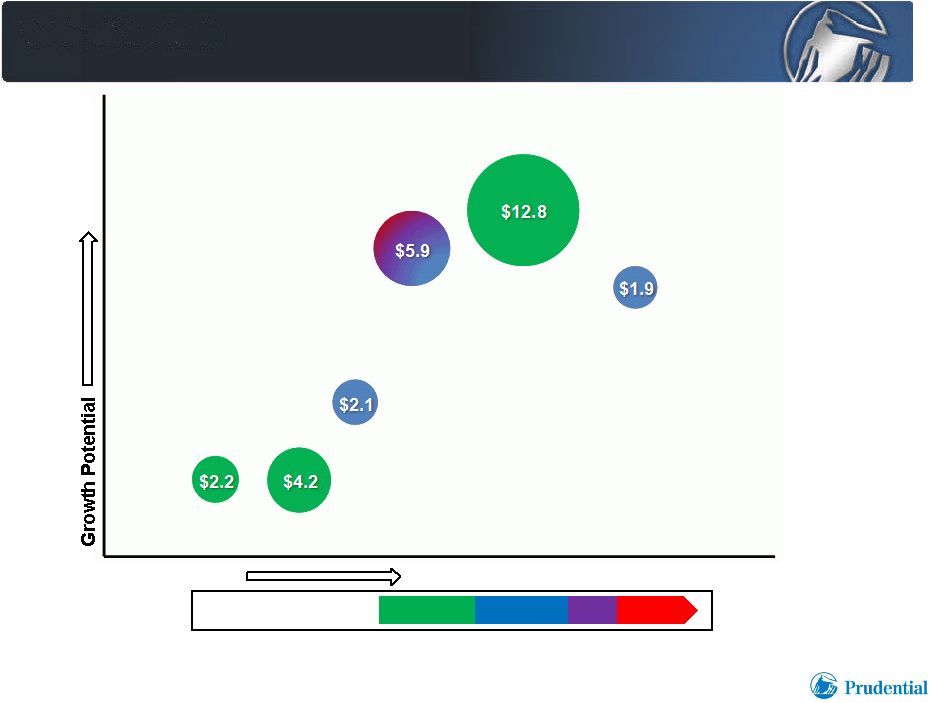 Investor Day 6.9.2011
Superior Business Mix Drives
Growth and Return Prospects
(1)
4
International
Insurance
Asset
Management
Individual
Annuities
Retirement
Group
Insurance
Individual
Life
ROE Prospects
Low
Medium
High
Expected AOI Volatility
1)
For illustrative purposes only; not intended to express actual growth or return expectations for any
particular periods. Amounts shown (in billions) represent attributed equity as of March 31,
2011. |
 Investor Day 6.9.2011
Prudential’s Business Mix
5
Individual Life
•
Focus on returns through capital management,
cost effective distribution
•
Coordinated approach to product and distribution
channel management
•
Quality business; avoid inappropriate financing
•
Results largely uncorrelated to U.S. equity markets
Group Insurance
•
Focus on returns: case selection, appropriate pricing
•
Cultivate optional life sales through employer clients
•
Deliver stable earnings and strong cash flows
Retirement
•
Emphasis on Full Service business
•
Market
opportunity
in
investment-only
products
for pension plan sponsors
•
Positioned for developing pension risk transfer market
|
 Investor Day 6.9.2011
6
Prudential’s Business Mix
Asset
Asset
Management
Management
•
Leading third party asset manager
Leading third party asset manager
•
•
Seasoned skills in multiple asset classes provide
Seasoned skills in multiple asset classes provide
competitive advantage for Prudential businesses
competitive advantage for Prudential businesses
•
•
Strong net flows drive increasing AUM, growing
Strong net flows drive increasing AUM, growing
asset management fees
asset management fees
•
•
Improving earnings quality; reduced exposure
Improving earnings quality; reduced exposure
to volatility
to volatility |
 Investor Day 6.9.2011
7
Prudential’s Business Mix
Annuities
•
Market leading positions across multiple
distribution channels
•
Proven, superior value proposition based on
“highest daily”
living benefits
•
Popularity of auto-rebalancing products drives
improving overall risk profile
•
Growing returns on an increasing base |
 Investor Day 6.9.2011
8
Prudential’s Business Mix
International
Insurance
•
Sustained success in Japan built on foundation
of
needs-based
selling,
emphasis
on
protection
products adapted to successful retirement products
•
Expanding distribution including Life Planners,
Life Advisors, banks and independent distributors
fuels growth prospects
•
Lifetime client relationships, innovative products
and
broad-based
distribution
support
opportunities in attractive retirement market |
 PRUDENTIAL INTERNATIONAL INSURANCE
BUILDING ON SUCCESS IN JAPAN
BUILDING ON SUCCESS IN JAPAN
EDWARD BAIRD
EDWARD BAIRD
EXECUTIVE VICE PRESIDENT
EXECUTIVE VICE PRESIDENT
CHIEF OPERATING OFFICER, INTERNATIONAL
CHIEF OPERATING OFFICER, INTERNATIONAL
PRUDENTIAL FINANCIAL, INC.
PRUDENTIAL FINANCIAL, INC. |
 Investor Day 6.9.2011
•
Big business
•
A market leader in Japan
•
High margins, low volatility
•
Strong growth
International Insurance
International Insurance
1 |
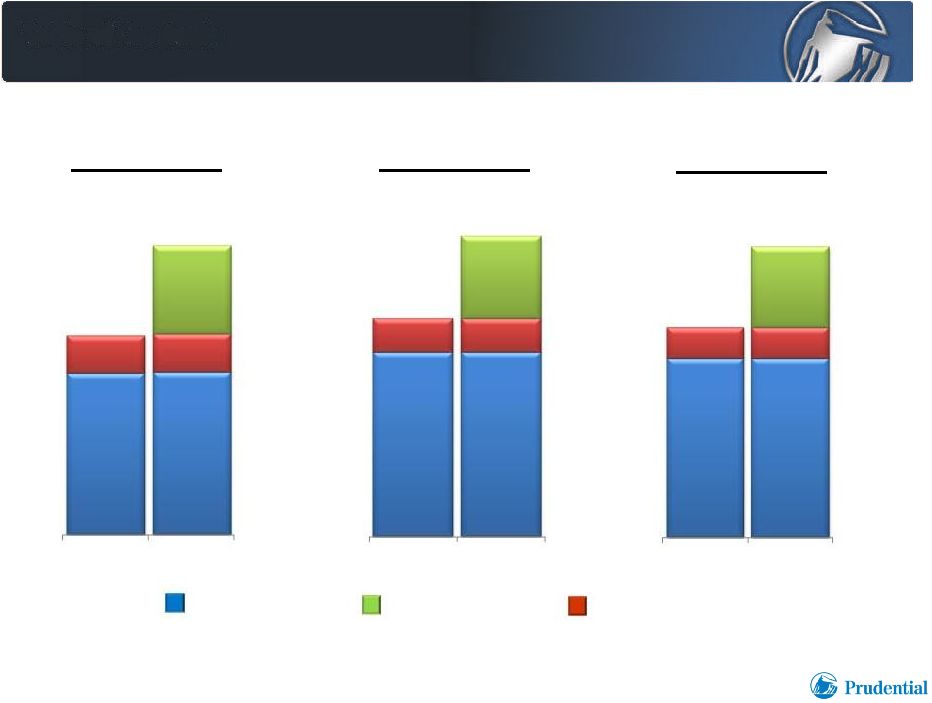 Investor Day 6.9.2011
International Insurance
International Insurance
2
Star/Edison
POJ
(4)
/Gibraltar
All Other Operations
Annualized New
Business
Premiums
(2)
Total
Premium
Revenue
(2)(3)
Number of
Policies
Inforce
(1)
(thousands)
(millions)
(millions)
1)
Direct business only; includes annuities.
2)
Foreign denominated activity translated to U.S. dollars at uniform exchange rates;
Japanese yen 92 per U.S. dollar; Korean won 1190 per U.S. dollar. 3)
Represents net premiums, policy charges and fee income.
4)
Prudential of Japan (“POJ”).
7,956
11,569
12/31/10
3/31/11
$9,200
$12,700
2010
2010
Proforma
$1,787
$2,467
2010
2010
Proforma |
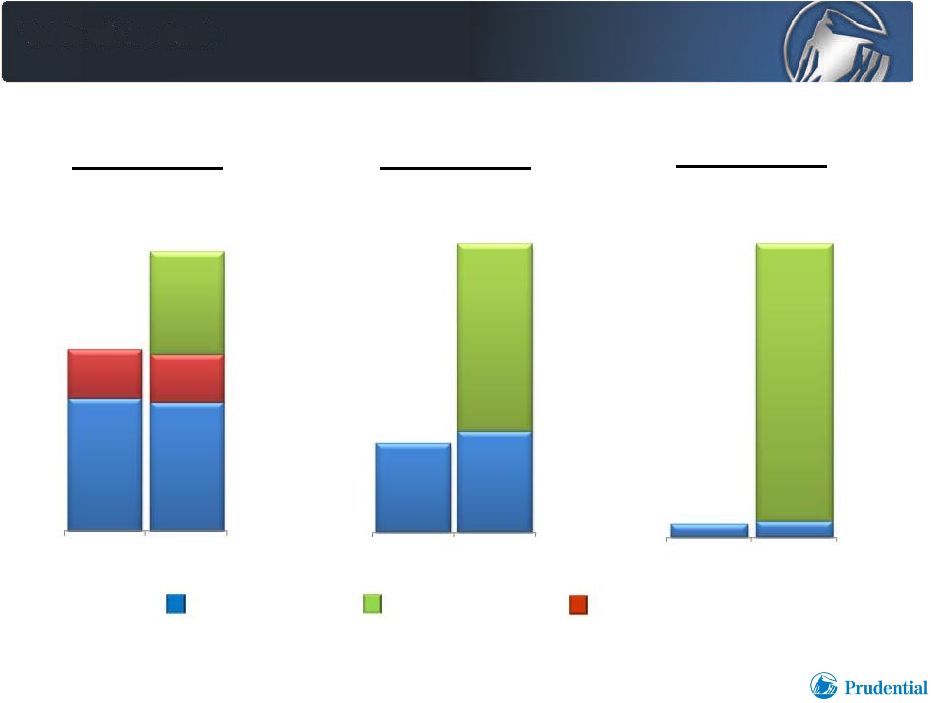 Investor Day 6.9.2011
3
Number of
Captive
Agents
Number of
Bank
Relationships
Number of
Independent
Agencies
International Insurance
International Insurance
Star/Edison
POJ/Gibraltar
All Other Operations
238
5,148
12/31/10
3/31/11
31
100
12/31/10
3/31/11
12,846
19,808
12/31/10
3/31/11 |
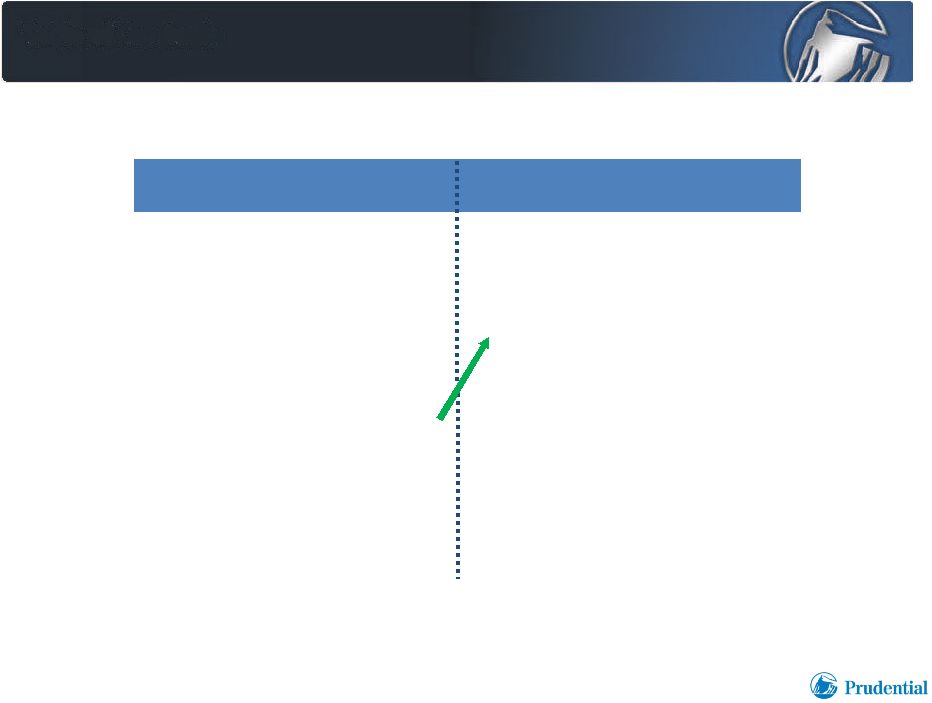 Investor Day 6.9.2011
6 Years Ago
6 Years Ago
FY 2004
FY 2004
Share
Share
Nine Months ended
Nine Months ended
December 31, 2010
December 31, 2010
Share
Share
1. Nippon
18.4%
1. Dai-ichi
12.2%
2. Dai-ichi
14.3%
2. Nippon
12.1%
3. Meiji-Yasuda
11.1%
3. T&D Financial
10.9%
4. Sumitomo
10.8%
4. Prudential
9.7%
5. T&D Financial
7.7%
5. Sumitomo
7.5%
6. AIG Group
5.6%
6. Meiji-Yasuda
7.3%
7. Prudential
4.9%
7. Sony
6.7%
8. Sony
3.8%
8. MetLife Alico
4.8%
9. Fukoku
3.4%
9. Millea
4.5%
10. Mitsui
2.9%
10. Sompo Japan
3.6%
Overall Position –
New
Business
(Face
Amount)
(1)
4
Market share improvement of 4.8%
1)
Industry data from Life Insurance Association of Japan. Data shown are based on companies’
Japanese statutory results for nine months ended December 31, 2010 and fiscal year ended March
31, 2005. New business amounts are individual life and annuity contracts including net increase by
conversion. Excludes Japan Post Insurance. Prudential’s share for the nine months ended
December 31, 2010 is pro forma for the acquisition of Star/Edison, which contributed 1.7% of
share. |
 Investor Day 6.9.2011
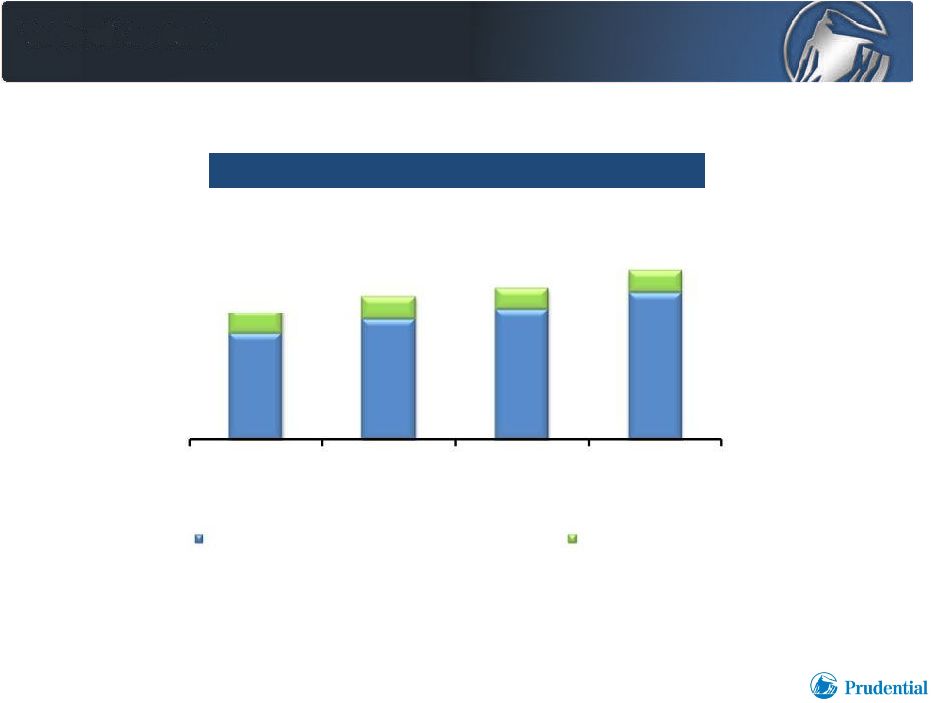
Stable Sources of Earnings
5
Includes margin on multi-currency annuity products.
Earnings are primarily the result of stable drivers.
(2)
$ in millions
$1,598
$1,747
$1,843
$2,057
2007
2008
2009
2010
Mortality Margin and Expense & Other Margin
Investment Margin
Pre-Tax
AOI
International
Insurance
Operation
(1)
Pre-tax adjusted operating income for our International Insurance operations as presented above
excludes the results of the International Investments businesses previously included in the
International Investments segment and currently included within “Gibraltar Life and Other Operations” within the International Insurance
segment for financial reporting purposes.
1)
2) |
 Investor Day 6.9.2011
Japan: Substantial Growth Opportunities
Japan: Substantial Growth Opportunities
in an Attractive Market
in an Attractive Market
•
World’s second largest life insurance market:
Life premiums $399 billion
(1)
•
Household sector wealth $18.3 trillion, similar to
U.S. on per-capita basis
(2)
•
Expanding retirement market driven by aging population,
increased emphasis on individual responsibility for
financial security
•
Growing distribution opportunities include banks,
independent distributors
6
1)
For the year 2009, based on Swiss Re survey
2)
Based
on
December
31,
2010
data;
Sources:
Federal
Reserve,
Bank
of
Japan,
U.S.
Census
Bureau,
Oanda |
 Investor Day 6.9.2011
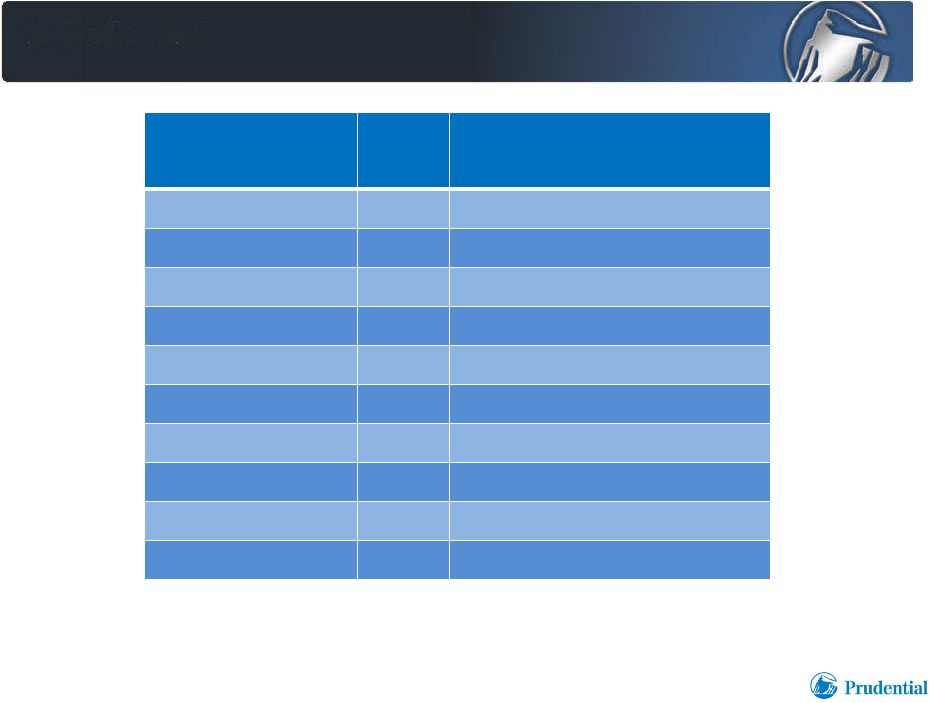
World’s Largest Life Insurance Markets
World’s Largest Life Insurance Markets
7
Country
Country
Rank
Rank
Life Premiums ($ billions)
Life Premiums ($ billions)
2009
2009
United States
United States
1
1
492
492
Japan
Japan
2
2
399
399
United Kingdom
United Kingdom
3
3
218
218
France
France
4
4
194
194
Italy
Italy
5
5
115
115
Germany
Germany
6
6
112
112
China
China
7
7
109
109
South Korea
South Korea
8
8
57
57
India
India
9
9
57
57
Taiwan
Taiwan
10
10
52
52
Source: Swiss Re survey |
 Investor Day 6.9.2011
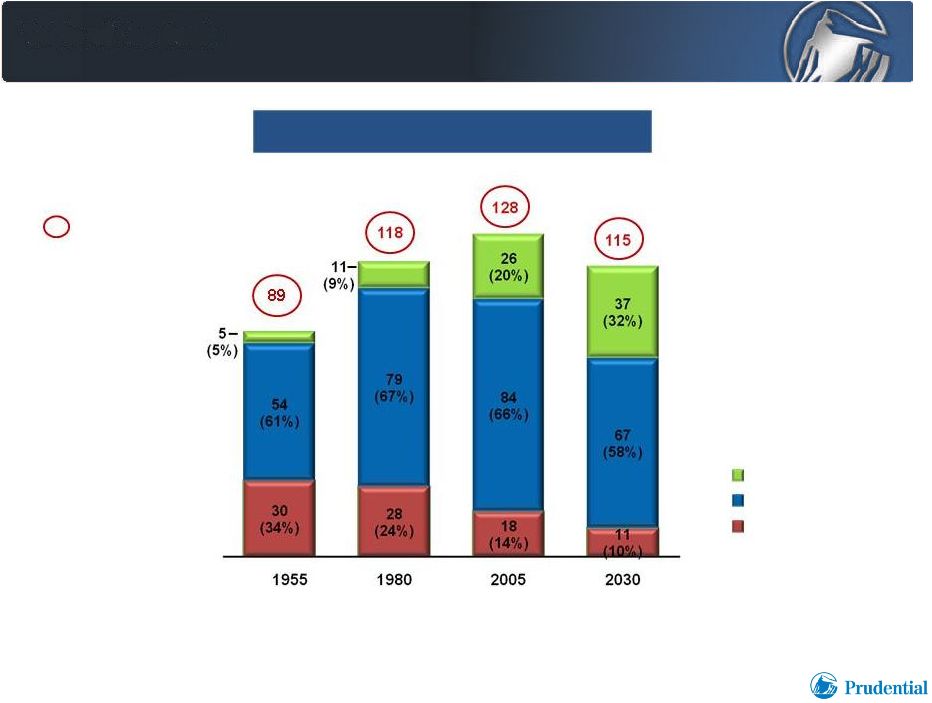
Growing Retirement Market Complements
Growing Retirement Market Complements
Substantial Premature Death Protection Market
Substantial Premature Death Protection Market
Source: National Institute of Population and Social Security Research, Japanese
Journal of Population Population
(in millions)
8
Japan Demographics
Japan Demographics
15-64 years old
65 and over
0-14 years old |
 Investor Day 6.9.2011
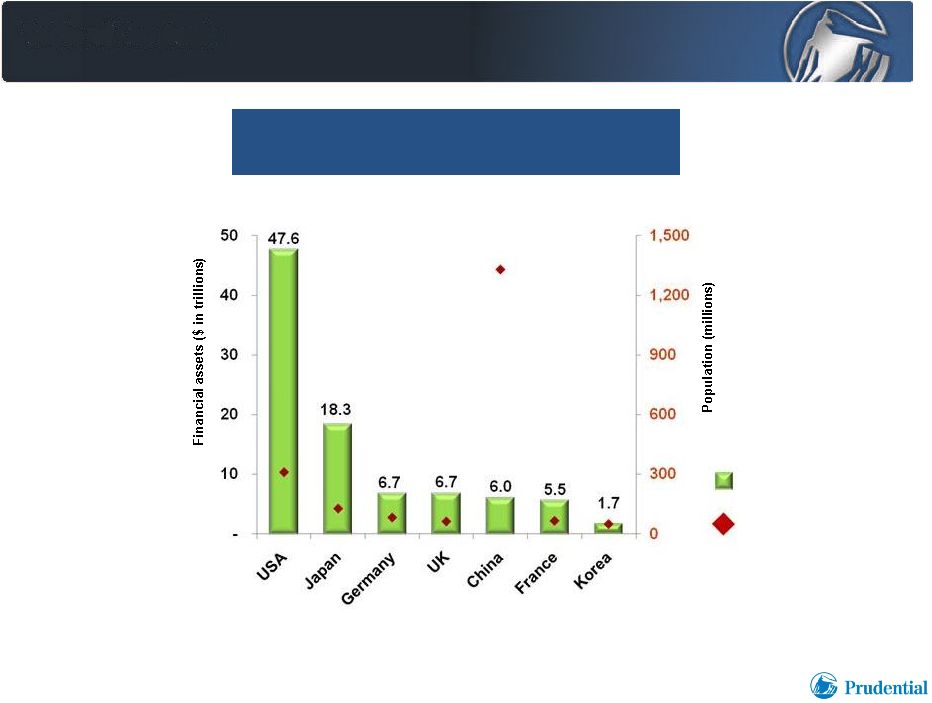
Financial Assets in the Household Sector
Financial Assets in the Household Sector
of Select Major Economies
of Select Major Economies
Household Sector Financial Assets
Household Sector Financial Assets
Note: Data for Japan, USA, and UK is as of December 31, 2010; China is as of
September 30, 2009; other markets are as of December 31, 2009 Source:
Federal Reserve, Bank of Japan, Eurostat, Central Bureau of Statistics of China, OECD, US Census Bureau, Oanda.
9
Financial assets
Population |
 Investor Day 6.9.2011
Portfolio
Portfolio
of
of
Financial
Financial
Assets
Assets
–
–
Japan
Japan
Source: Bank of Japan, Federal Reserve, Oanda
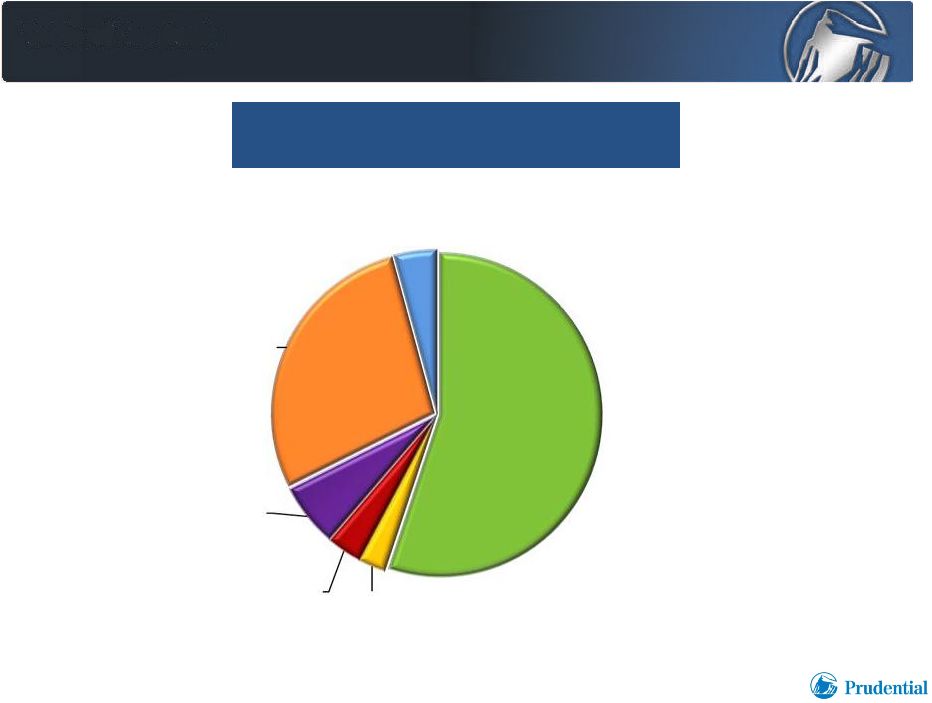
$10.1T
10
Financial Assets in the Household Sector
Financial Assets in the Household Sector
December 31, 2010
December 31, 2010
Currency and
Deposits
55.1%
Bonds 2.7%
Investment
Trusts 3.5%
Shares and
Equities 6.3%
Life
Insurance
and Pension
Reserves
28.2%
Other 4.2%
100% = $18.3 Trillion |
 Investor Day 6.9.2011
Household Sector
Household Sector
Pool of Currency and Deposits
Pool of Currency and Deposits
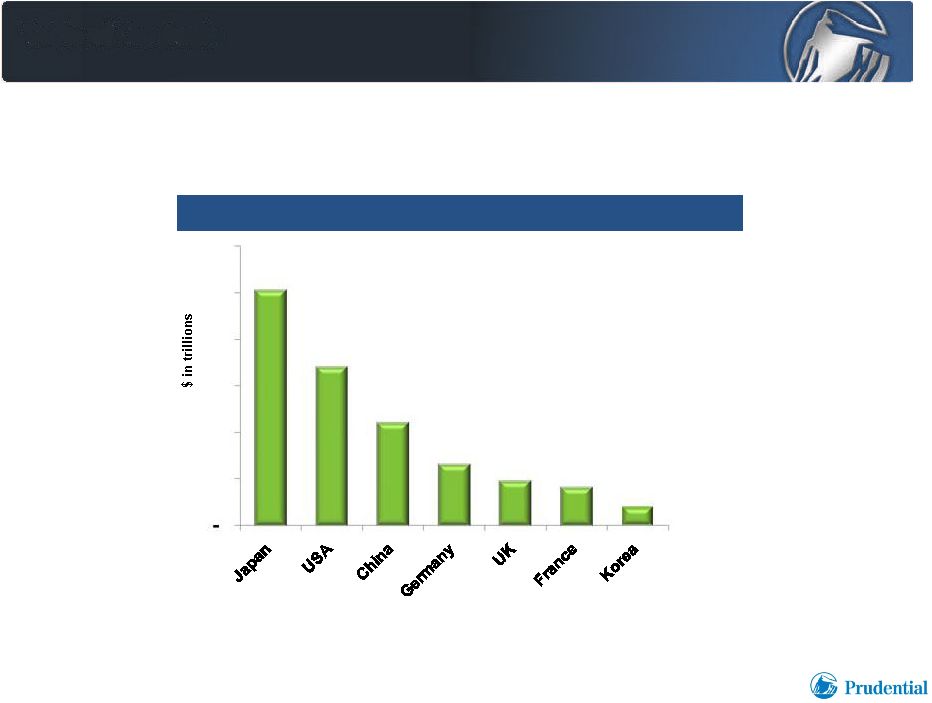
Japan has the largest pool of household assets in currency and deposits
•~50% higher than that of the U.S. despite a population that is ~60% smaller
•Greater than the currency and deposits of Germany, the United Kingdom and France
combined 11
Household Sector Financial Assets in Currency and Deposits
Note: Data for Japan, USA, and UK is as of December 31, 2010; China is as of
September 30, 2009; other markets are as of December 31, 2009 Source:
Federal Reserve, Bank of Japan, Eurostat, Central Bureau of Statistics of China, OECD, US Census Bureau, Oanda.
10.1
6.8
4.4
2.6
1.9
1.6
0.8
2
4
6
8
10
12 |
 Investor Day 6.9.2011
Needs-Based Selling Over a Lifetime
12
1)
Accident and Health (A&H) primarily includes daily hospitalization indemnity,
cancer insurance, and accident and sickness riders. Client Age
20
30 40 50
60+
Client Focus
Death
Retirement
Protection
Income
Needs
Needs
Prudential
Solutions
Term Insurance
Term Insurance
Whole Life
Whole Life
U.S. Dollar Retirement Income
Accident & Health
(1)
Fixed Annuity Products
•
Lifetime client relationships
•
Needs-based selling through client life cycles
•
Innovative products serve evolving needs |
 Investor Day 6.9.2011
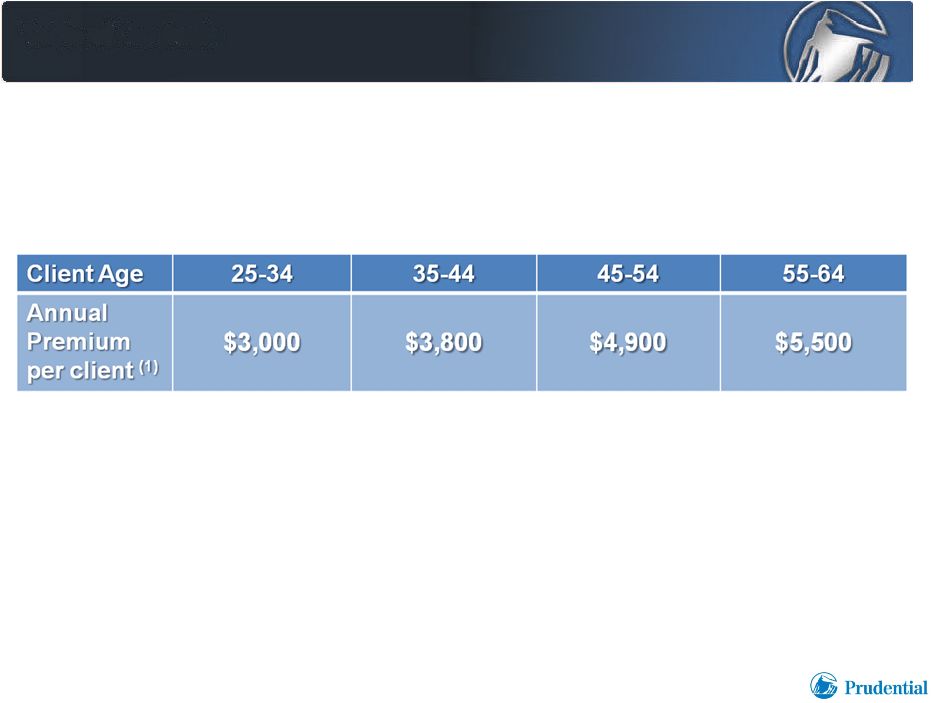
Protecting Financial Security For a Lifetime
1)
Based on annual premium for new Prudential of Japan insureds in 2009 (male, married
insured, individual policies); foreign-denominated activity translated
to U.S. dollars at uniform exchange rates, Japanese yen 99 per U.S. dollar.
13
Aging population leads to demand for larger policy size.
|
 Investor Day 6.9.2011
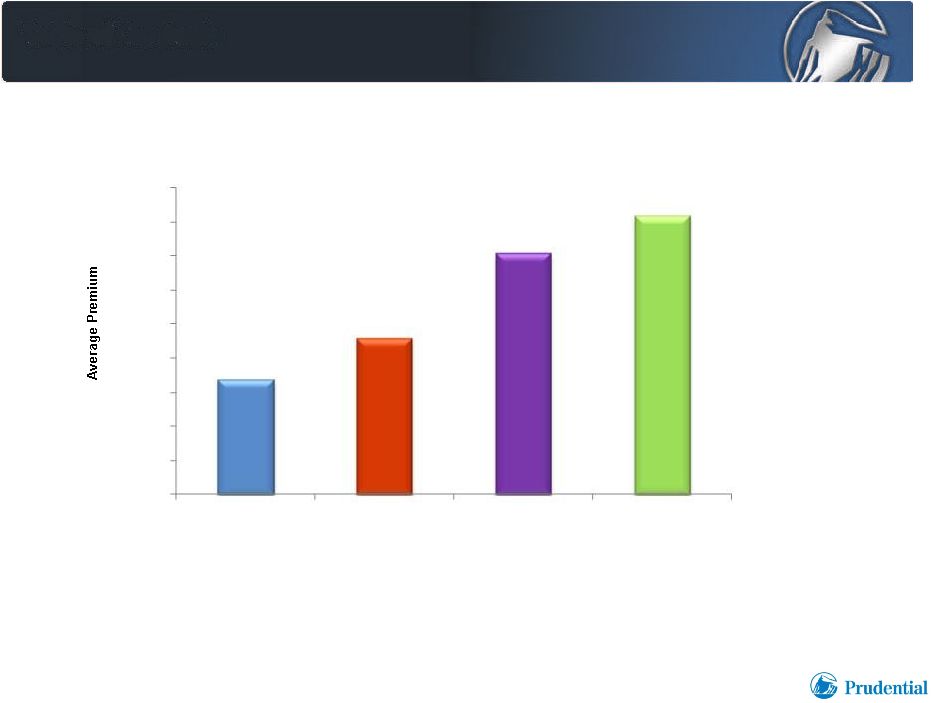
Japan Average Premium
(1)
14
1)
Based on annualized new business premiums for the year ended December 31, 2010 sold
by Life Planners and Life Advisors. Foreign denominated activity translated
to U.S. dollars at uniform exchange rates; Japanese yen 92 per U.S. dollar. 4,500
2,000
1,500
1,000
500
3,000
3,500
4,000
2,500
-
Protection
Accident & Health
Annuity
Retirement |
 Investor Day 6.9.2011
International Insurance
Meeting customer needs through…
–
Strong and diverse product portfolio
–
Complementary distribution capabilities
–
Strong relationships
15 |
 Investor Day 6.9.2011
684
669
656
645
642
637
626
622
618
613
607
602
602
600
597
590
589
576
567
500
600
700
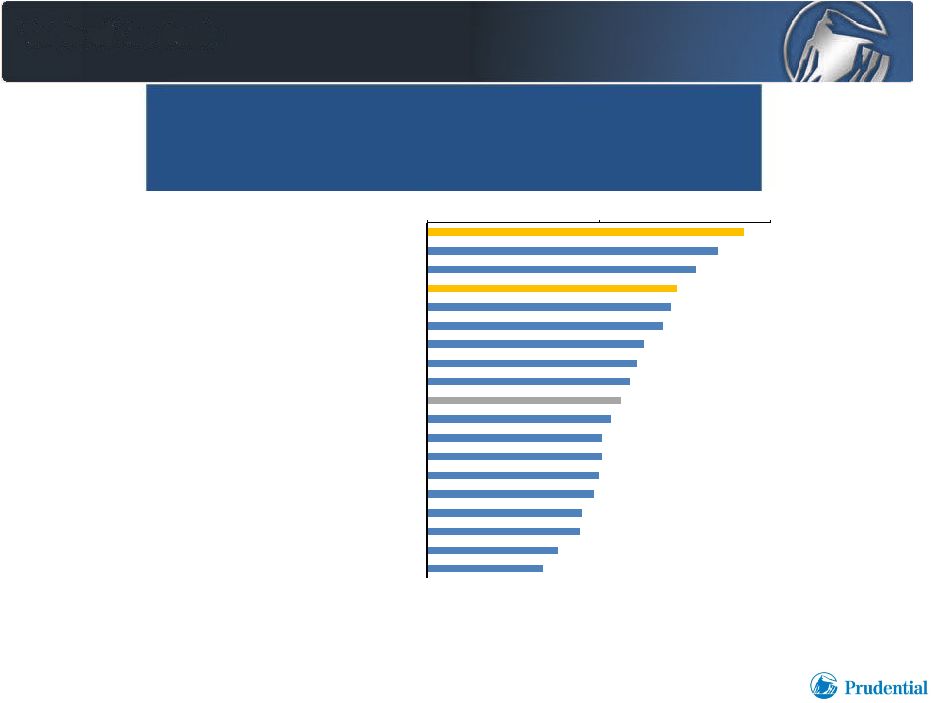
The Prudential Life Insurance
Sony Life Insurance
Tokio Marine & Nichido Life Insurance
The Gibraltar Life Insurance
Sompo Japan Himawari Life Insurance
American Life Insurance Company (ALICO)
JAPAN POST INSURANCE
Fukoku Mutual Life Insurance
American Family Life Assurance Company of Columbus (Aflac)
Life Support Insurance Segment Average
Aioi Life Insurance
Nippon Life Insurance
Sompo Japan DIY Life Insurance
AXA Life Insurance
The Dai-ichi Life Insurance
Sumitomo Life Insurance
Mitsui Life Insurance
Meiji Yasuda Life Insurance
Asahi Mutual Life Insurance
No. 1 in Customer Satisfaction
16
Source: J.D. Power Asia Pacific 2011 Japan Life Insurance Contract Customer
Satisfaction Study Rankings are based on numerical scores, and not
necessarily on statistical significance. SM
Included in the study but not ranked due to small sample size are: AIG Edison Life Insurance; AIG Star
Life Insurance; Allianz Life Insurance Japan; Daido Life Insurance; Fukokushinrai Life
Insurance; ING Life Insurance; Lifenet Insurance; Manulife Life Insurance; Mitsui Sumitomo Kirameki Life Insurance; NEXTIA Life
Insurance (former SBI AXA Life Insurance); NIPPONKOA Life Insurance; ORIX Life Insurance; Taiyo Life
Insurance; The FujiLife Insurance; The Prudential Gibraltar Financial Life Insurance (former
Yamato Life Insurance); and Zurich Life Insurance.
J.D. Power Asia Pacific
2011 Japan Life Insurance Contract Customer Satisfaction Study
SM
Customer Satisfaction Index Ranking (Based
on a 1,000-point scale) Life Support Insurance Segment
|
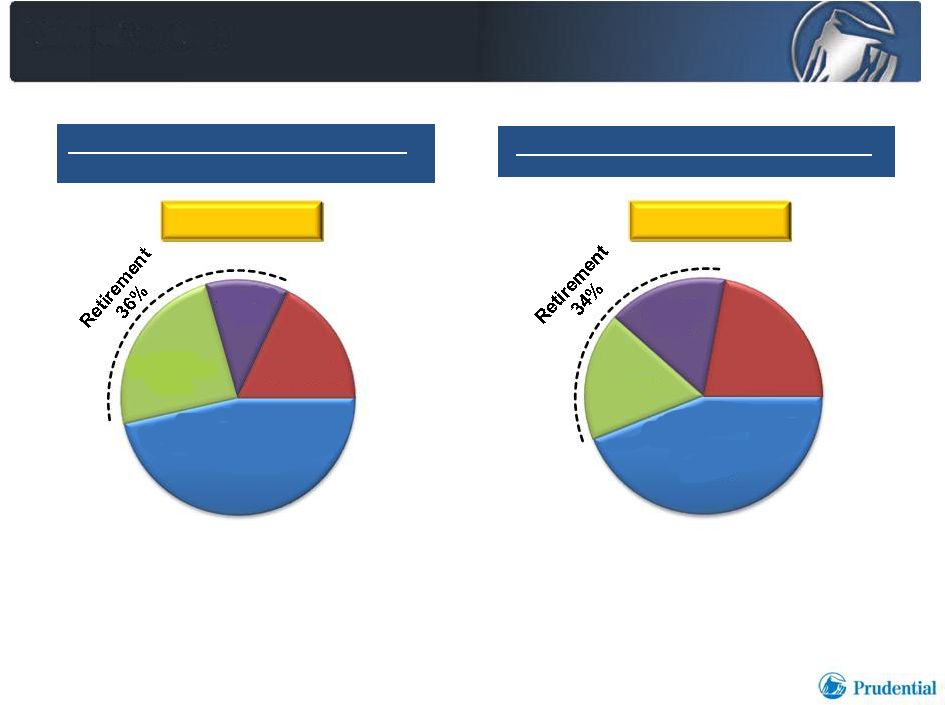 Product Portfolio
Serving Financial Security Needs Over a Lifetime
Annualized
Annualized
New
New
Business
Business
Premiums
Premiums
(1)
(1)
Year ended December 31, 2010
Year ended December 31, 2010
1)
For Prudential’s Japanese businesses; foreign denominated activity translated
to U.S. dollars at uniform exchange rates; Japanese yen 92 per U.S. dollar.
2)
Pro-forma including approximation of Star and Edison businesses.
Annualized
Annualized
New
New
Business
Business
Premiums
Premiums
(1)
(1)
(2)
(2)
Death
Protection
46%
Retirement
24%
Annuity
12%
A&H 18%
Death
Protection
44%
Retirement
18%
Annuity
16%
A&H
22%
$1,521 million
$2,202 million
Investor Day 6.9.2011
17
Pro Forma Year ended December 31, 2010
Pro Forma Year ended December 31, 2010 |
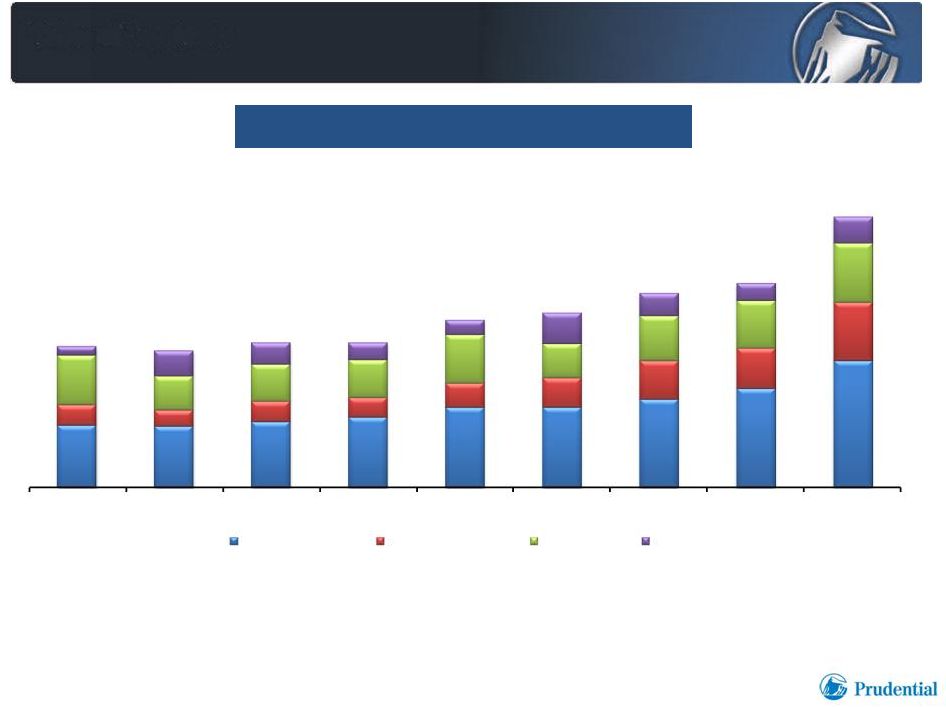 Diverse Annualized New Business Premiums in Japan
18
1)
For Prudential’s Japanese businesses; foreign denominated activity translated
to U.S. dollars at uniform exchange rates for all periods presented;
Japanese yen 92 per U.S. dollar.
Annualized
Annualized
New
New
Business
Business
Premiums
Premiums
(1)
(1)
($ in millions)
$289
$281
$296
$298
$344
$359
$398
$420
$555
1Q09
2Q09
3Q09
4Q09
1Q10
2Q10
3Q10
4Q10
1Q11
Death Protection
Accident & Health
Retirement
Annuity
Investor Day 6.9.2011 |
 Investor Day 6.9.2011
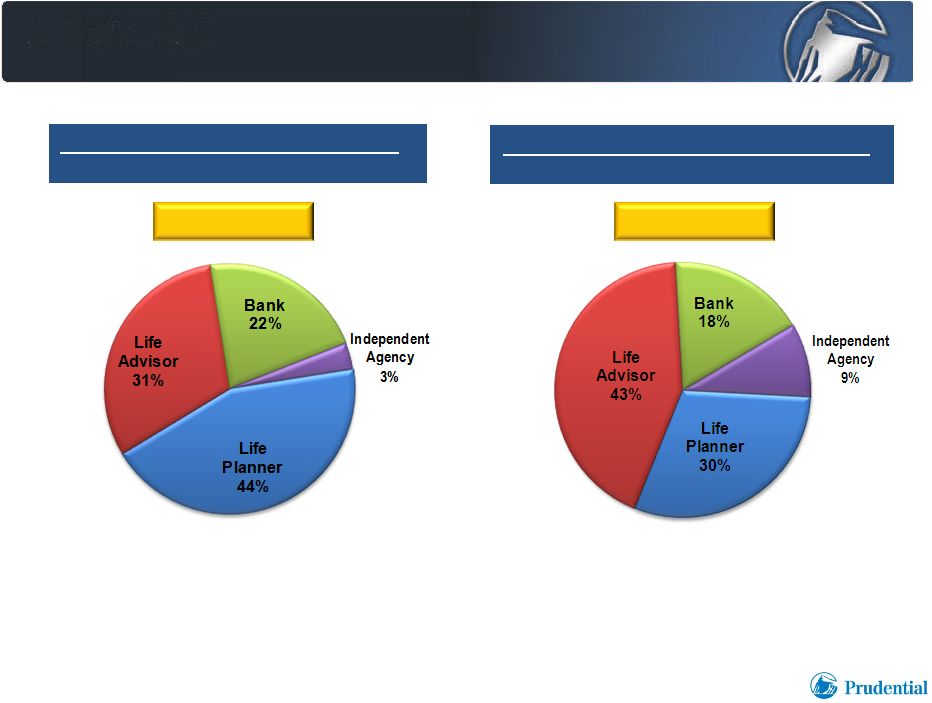
Distribution Channels in Japan
19
1)
For Prudential’s Japanese businesses; foreign denominated activity translated
to U.S. dollars at uniform exchange rates; Japanese yen 92 per U.S.
dollar. 2)
Pro-forma including approximation of Star and Edison businesses.
Annualized
Annualized
New
New
Business
Business
Premiums
Premiums
(1)
(1)
Year ended December 31, 2010
Year ended December 31, 2010
Annualized
Annualized
New
New
Business
Business
Premiums
Premiums
(1)(2)
(1)(2)
Pro Forma Year ended December 31, 2010
Pro Forma Year ended December 31, 2010
$1,521 million
$2,202 million |
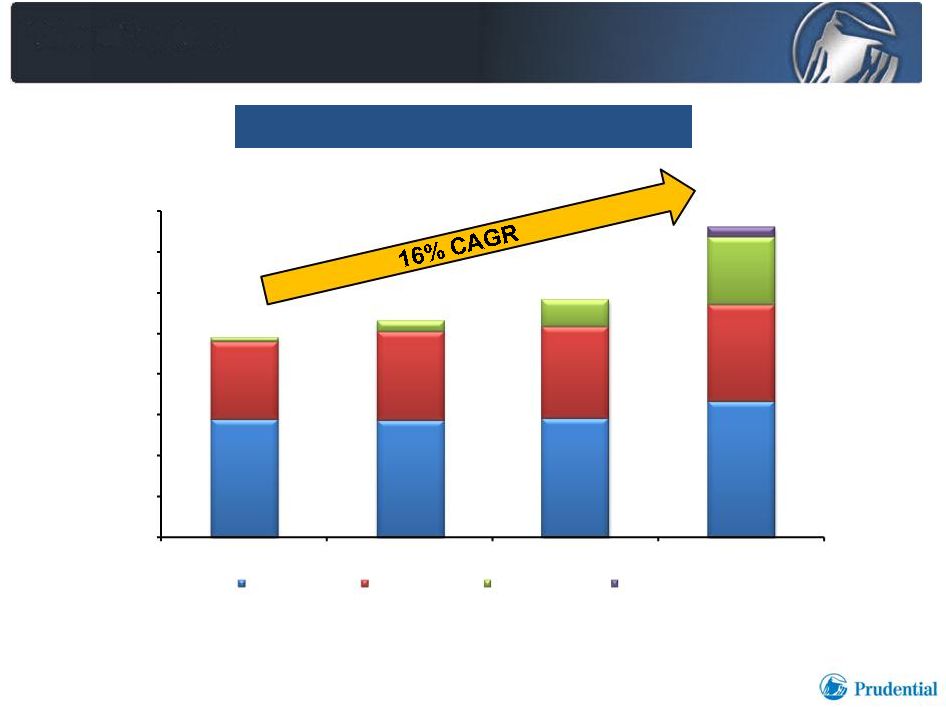 Complementary Distribution Channels
Drive Sales Growth in Japan
1)
For Prudential’s Japanese businesses; foreign denominated activity translated
to U.S. dollars at uniform exchange rates for all periods presented.
Japanese yen 92 per U.S. dollar.
Annualized New Business Premiums
Annualized New Business Premiums
(1)
(1)
20
($ in millions)
$979
$1,521
-
200
400
600
800
1,000
1,200
1,400
1,600
2007
2008
2009
2010
Life Planners
Life Advisors
Bank Channel
Independent Agency
Investor Day 6.9.2011 |
 Investor Day 6.9.2011
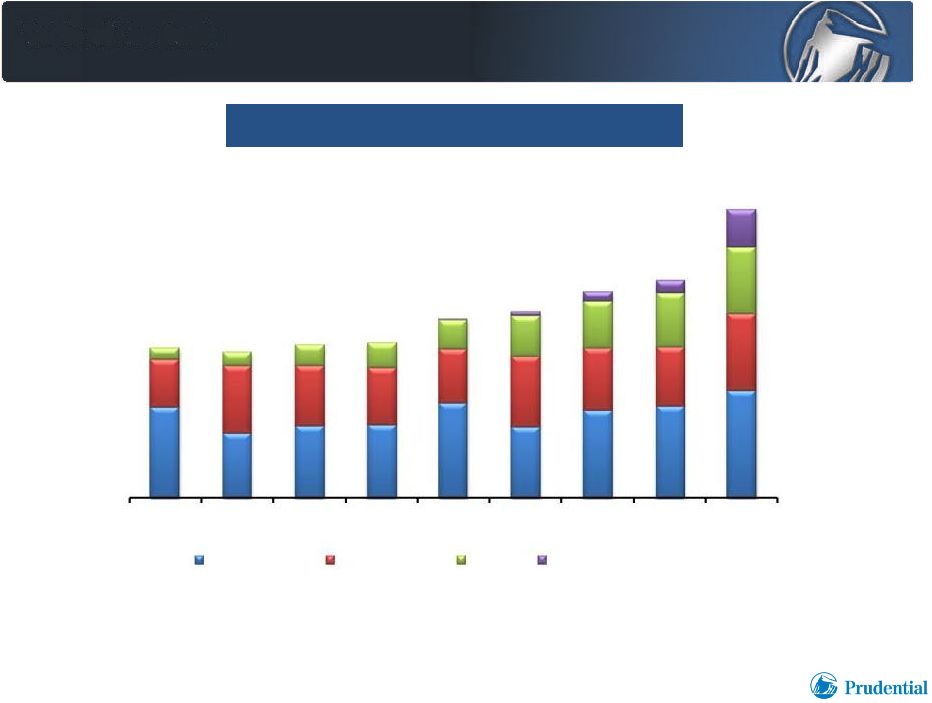
Complementary Distribution Channels
Drive Sales Growth in Japan
21
($ in millions)
1)
For Prudential’s Japanese businesses; foreign denominated activity translated
to U.S. dollars at uniform exchange rates for all periods presented.
Japanese yen 92 per U.S. dollar.
Annualized New Business Premiums
Annualized New Business Premiums
(1)
(1)
$289
$281
$296
$298
$344
$359
$398
$420
$555
1Q09
2Q09
3Q09
4Q09
1Q10
2Q10
3Q10
4Q10
1Q11
Life Planner
Life Advisor
Bank
Independent Agency |
 Investor Day 6.9.2011
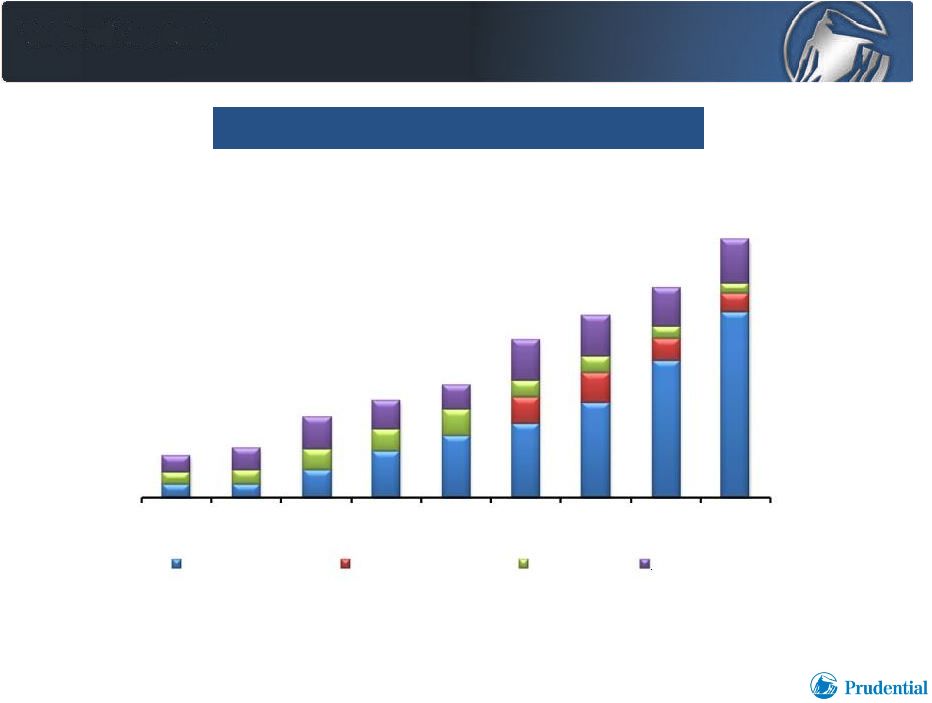
Bank Channel Sales Growth
Driven by Protection Products
Annualized New Business Premiums
(1)
1)
Foreign
denominated
activity
translated
to
U.S.
dollars
at
uniform
exchange
rates
for
all
periods
presented;
Japanese
yen
92
per
U.S.
dollar.
22
($ in millions)
$21
$25
$40
$48
$56
$78
$90
$104
$128
1Q09
2Q09
3Q09
4Q09
1Q10
2Q10
3Q10
4Q10
1Q11
Death Protection
Accident & Health
Retirement
Annuity |
 Investor Day 6.9.2011
Prudential’s Key International Strategies:
Suited to Japanese Market Opportunities
•
Target the affluent and mass affluent consumer
•
Needs-based selling: historical focus on life insurance;
increasing emphasis on meeting retirement needs
•
Proprietary distribution model built on recruiting, selection
and training
•
Growth through complementary distribution channels and
opportunistic acquisitions
23 |
 Investor Day 6.9.2011
Life Planner Distribution
•
Life Planner –
a selective, high quality sales force
–
Hire about 3 out of 100 candidates
–
Well trained and professional
–
Customer focused
–
Disciplined, and demonstrate “missionary zeal”
•
Emphasize protection products requiring analysis of client needs
•
Significant sales to small business/executive/professional market
•
Exceptional sales productivity and persistency
24 |
 Investor Day 6.9.2011
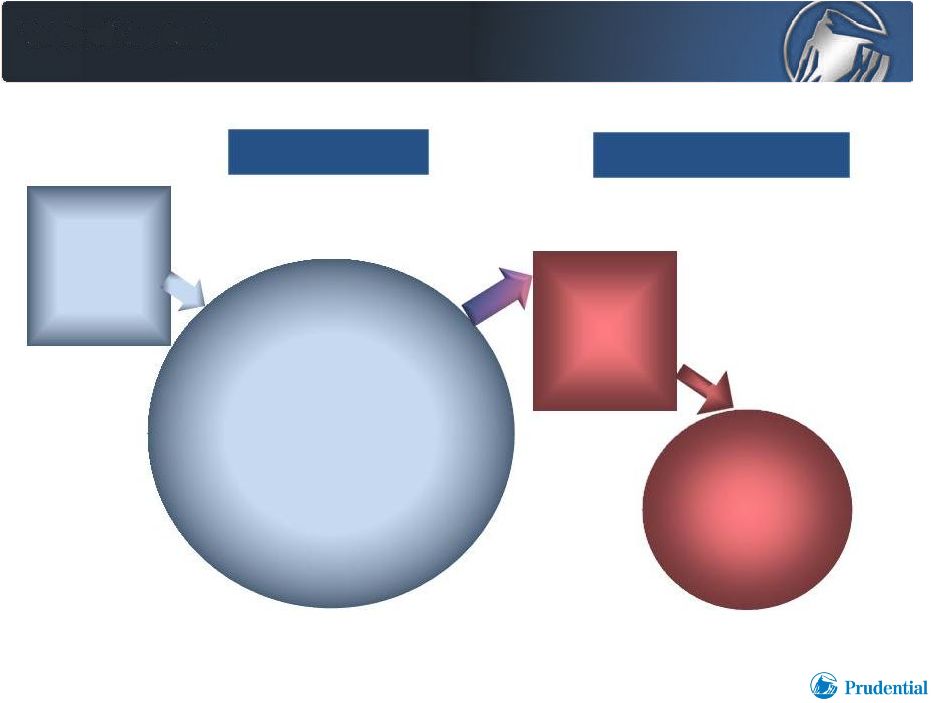
Teachers Association:
Perennial Sales Opportunities
1)
Numbers approximate as of March 31, 2011.
Active
Active
Market
Market
Retirement
Retirement
Market
Market
25
48% Gibraltar
Policyholders
87% Gibraltar
Policyholders
120,000
120,000
Retired
Retired
Teachers
Teachers
Association
Association
members
members
(1)
(1)
20,000
20,000
–
–
30,000 new
30,000 new
teachers
teachers
hired
hired
each year
each year
20,000
20,000
–
–
30,000
30,000
teachers
teachers
retire
retire
each year
each year
950,000
950,000
Active
Active
Teachers
Teachers
(1)
(1) |
 Investor Day 6.9.2011
Teachers Association
Core Relationship Contributes to Life Advisor Distribution
•
Relationship since 1952
•
Approximately 600,000 members
(1)
•
Access to approximately 950,000 teachers and school personnel
through
47
prefectural
(local)
associations
and
37,000
schools
(1)
•
Annualized
new
business
premiums
in
2010,
$181
million
(2)
Japanese Educational Mutual Aid
Japanese Educational Mutual Aid
Association of Welfare Foundation
Association of Welfare Foundation
(Teachers Association)
(Teachers Association)
1)
As of March 31, 2011.
2)
Foreign denominated activity translated to U.S. dollars at uniform exchange rates;
Japanese yen 92 per U.S. dollar. 26 |
 Investor Day 6.9.2011
Bancassurance Powered by Prudential
Prudential Support
Prudential Support
•
•
Insurance education and training
Insurance education and training
backed by proven distribution model
backed by proven distribution model
•
•
Competitive products focused
Competitive products focused
on protection
on protection
•
•
Highly regarded brand, promises
Highly regarded brand, promises
backed by a strong company
backed by a strong company
•
•
Access
Access
to
to
expertise
expertise
of
of
“seconded”
“seconded”
former Prudential of Japan
former Prudential of Japan
Life Planners
Life Planners
(1)
(1)
1)
At certain banks.
Bank Employee
Bank Employee
Life Insurance Sales
Life Insurance Sales
27 |
 Investor Day 6.9.2011
International Insurance
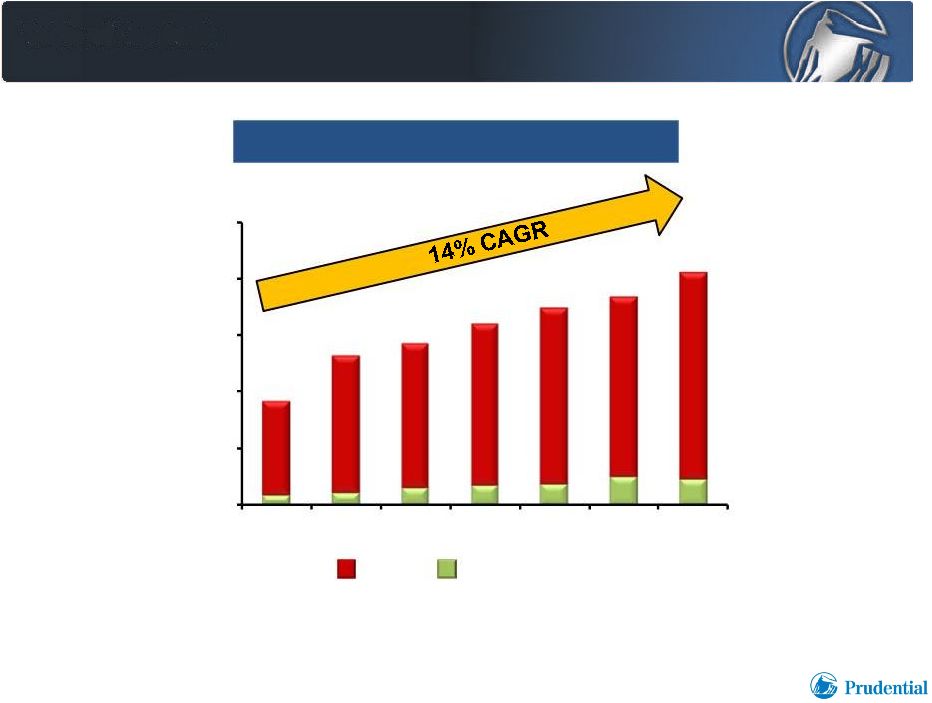
Sustained Growth Reflects Success in Japanese Market
28
$917
$1,321
$1,428
$1,598
$1,747
$1,843
$2,057
Japan
All Other Operations
$ in millions
Pre-Tax Adjusted Operating Income
Pre-Tax Adjusted Operating Income
(1)
(1)
$0
$500
$1,000
$1,500
$2,000
$2,500
2004
2005
2006
2007
2008
2009
2010
1)
Pre-tax adjusted operating income for our International Insurance operations as presented above
excludes the results of the International Investments businesses previously included in the
International Investments segment and currently included within “Gibraltar Life and Other
Operations” within the International Insurance segment for financial reporting purposes.
The pre-tax adjusted operating income (loss) of our International Investments businesses
was $28 million, $25 million, $(412) million, $63 million, $20 million, $(5) million and $(9) million in 2010, 2009,
2008, 2007, 2006, 2005 and 2004, respectively. |
 Investor Day 6.9.2011
Key Takeaways
29
•
Prudential’s largest business
•
A market leader in Japan
•
High margins, low volatility
•
Strong growth |
 |
 Investor Day 6.9.2011
Asset Management
•
Robust institutional and retail businesses attract and retain talented
investment professionals
•
Substantial fee-based earnings that benefit from operating leverage
•
Limited capital requirements; sustainable high ROE
•
Seasoned skills in multiple asset classes support attractive
general account investments
•
Investment management strength supports retirement, annuities, and
insurance businesses
1
Leading
Leading
Third
Third
Party
Party
Asset
Asset
Manager
Manager
Competitive
Competitive
Advantage
Advantage
for
for
Prudential
Prudential
Businesses
Businesses |
 Investor Day 6.9.2011
•
Utilize significant talent base
across multiple asset classes;
established track records, and
broad and deep client relationships
to increase AUM
(1)
base
•
Grow high-quality earnings driven
primarily by asset management fees
•
Manage business risks and
strategically employ
proprietary investing
•
Apply skill sets to support general
account asset selection and
management
Prudential Investment Management
Key Strategies
2
•
Fee-driven growth potential
•
Favorable ROE
•
Competitive advantage
for Prudential’s retirement,
annuities and
insurance businesses
1)
Assets under management (AUM). |
 Investor Day 6.9.2011
Asset Management’s Competitive Strengths
Appeal to Clients as well as Investment Professionals
1)
As of March 31, 2011; AUM excludes affiliated institutional and retail assets under
management. 3
Experience and
Experience and
Track Record
Track Record
Breadth and Depth
Breadth and Depth
of Capabilities
of Capabilities
Access to Capital
Access to Capital
and Co-investing
and Co-investing
Brand and
Brand and
Reputation
Reputation
Scale
Scale
Third
Third
Party
Party
Clients
Clients
$275 billion
$275 billion
third party AUM
third party AUM
(1)
(1)
13% AUM CAGR
13% AUM CAGR
Manager
Manager
Continuity
Continuity
(1)
(1)
220 portfolio
220 portfolio
managers
managers
Average tenure
Average tenure
13 years
13 years
(2005
(2005
–
–
2010)
2010) |
 Investor Day 6.9.2011
Asset Management has Three Major Client Types
4
Total
Total
AUM:
AUM:
$569
$569
billion
billion
(1)
(1)
1)
As of March 31, 2011.
•
Public Pension Plans
(DB/DC)
•
Corporate Pension Plans
(DB/DC)
•
Union Pension Plans
•
Endowments
•
Foundations
•
Sovereign Wealth Funds
•
Non-affiliated Insurance
Companies
•
Affiliated
–
Annuities
–
Retirement
–
Individual life
•
Proprietary Mutual Funds
•
Subadvisory relationships
•
U.S. individual life and
group insurance
•
Retirement
•
Annuities
•
International Insurance
(U.S. dollar assets)
General Account
General Account
$214 billion
$214 billion
Institutional
Institutional
$246 billion
$246 billion
Retail
Retail
$109 billion
$109 billion |
 Investor Day 6.9.2011
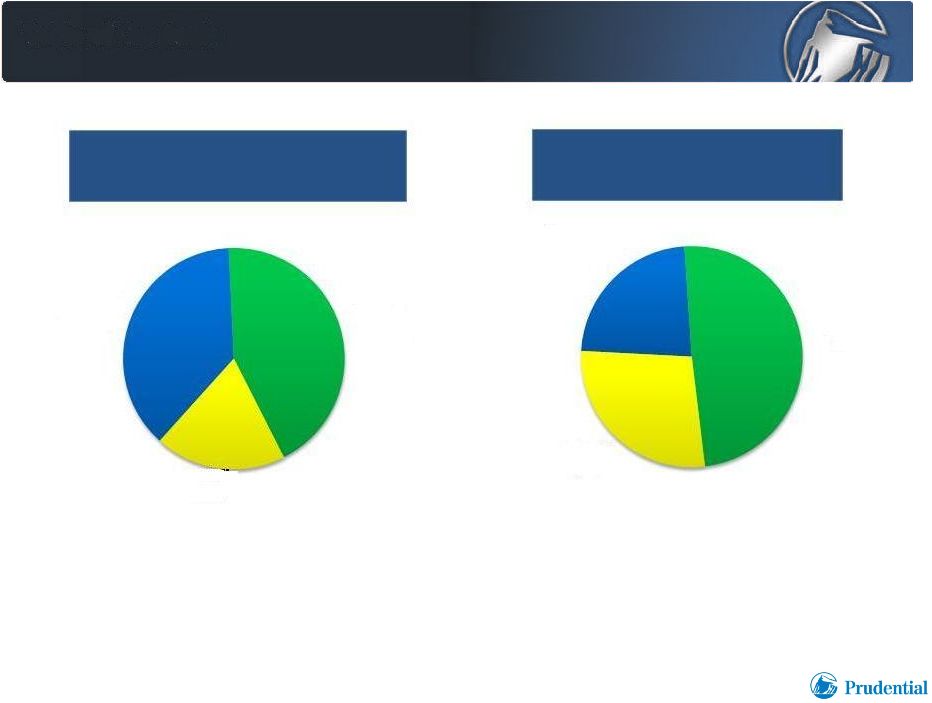
AUM and Revenues are Well Diversified by Client Type
5
1)
As of March 31, 2011.
2)
For the year ended December 31, 2010.
$246 B
$214 B
$109 B
$353 M
$626 M
$294 M
Retail
19%
General
Account
38%
Institutional
43%
General
Account
23%
Retail
28%
Institutional
49%
Assets
Assets
Under
Under
Management
Management
$569
$569
billion
billion
(1)
(1)
Asset
Asset
Management
Management
Fees
Fees
$1.3
$1.3
billion
billion
(2)
(2) |
 Investor Day 6.9.2011
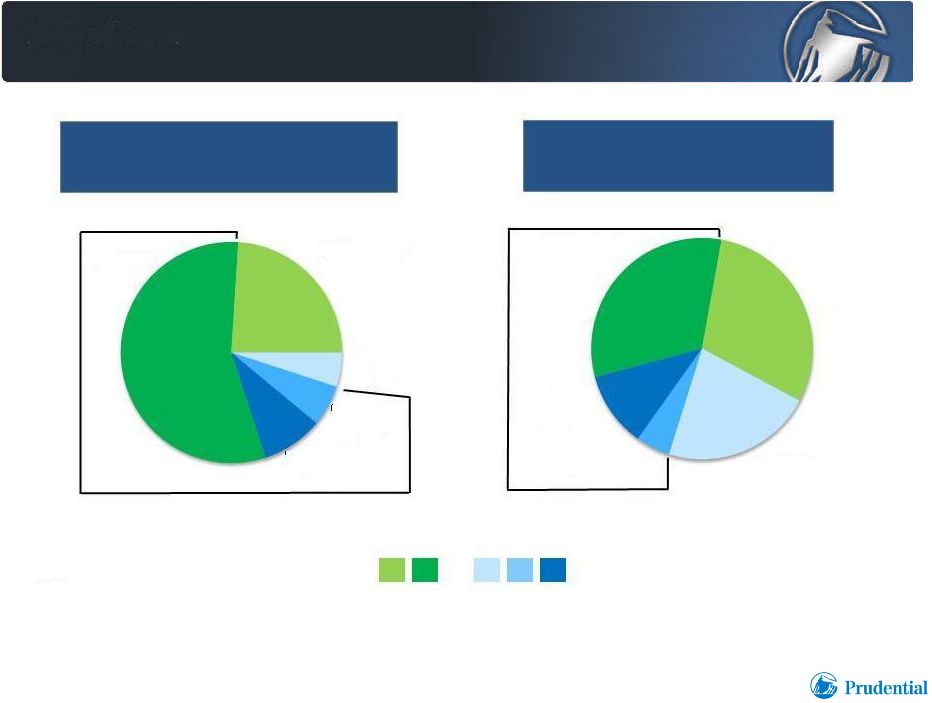
AUM and Revenues are also Diversified by Asset Class
6
1)
As of March 31, 2011.
2)
For the year ended December 31, 2010.
Public Fixed
Income
56%
Public Equity
24%
Real Estate
5%
Commercial
Mortgages
6%
Private Fixed
Income
9%
Public Fixed
Income
32%
Public Equity
30%
Real Estate
22%
Commercial
Mortgages
5%
Private Fixed
Income
11%
Public
Private
48% of Fees from Fixed Income
71% of AUM from Fixed Income
Assets
Assets
Under
Under
Management
Management
$569
$569
billion
billion
(1)
(1)
Asset
Asset
Management
Management
Fees
Fees
$1.3
$1.3
billion
billion
(2)
(2) |
 Investor Day 6.9.2011
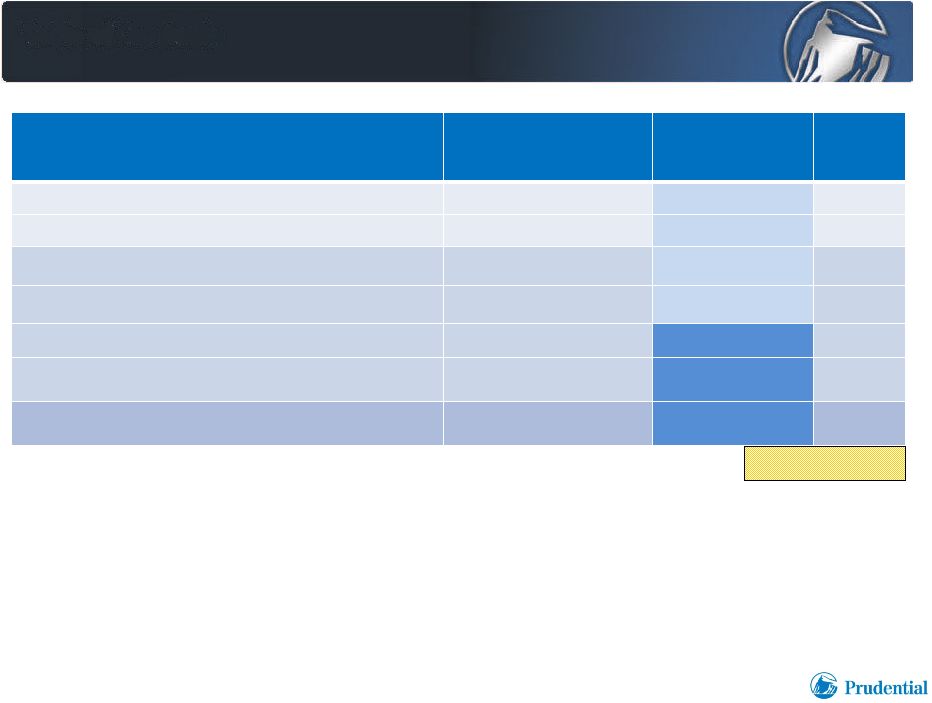
AUM Spans Six Distinct Investment Disciplines
7
Investment Manager
Investment Manager
Investment
Investment
Discipline
Discipline
Public/Private
Public/Private
3/31/11
3/31/11
AUM
AUM
(1)
(1)
Jennison Associates
Fundamental Equity
Public
$ 86
Quantitative Management Associates (QMA)
Quantitative Equity
Public
47
Prudential Fixed Income (PFIM)
Public Fixed Income
Public
273
Jennison Associates
Public Fixed Income
Public
47
Prudential Capital Group (PCG)
Private Fixed Income
Private
54
Prudential Mortgage Capital Company (PMCC)
Real Estate Debt
Private
34
Prudential Real Estate Investors (PREI)
Real Estate Equity
Private
28
1)
In billions.
Total
AUM:
$569 |
 Investor Day 6.9.2011
Public Fixed Income
8
Prudential Fixed Income
Prudential Fixed Income
Jennison Fixed Income
Jennison Fixed Income
•
$273 billion AUM
(1)
•
$47 billion in fixed income AUM
(1)
•
Operations in U.S., Europe, and Asia
•
Operations in U.S.
•
Comprehensive product line
•
Focused product line
–
Broad market strategies
–
Core, Core Plus
–
Intermediate Gov/Credit
–
Long Duration/LDI
–
Corporates
–
High Yield
–
Emerging Markets
–
US Bank Loans
–
Alternatives/CDOs
–
U.S. strategies
–
Intermediate and long duration
–
Core
•
276 Institutional clients
(1)
•
94 Institutional clients
(1)
•
180 Investment professionals
(1)
•
12 Investment professionals
(1)
1)
As of March 31, 2011. |
 Investor Day 6.9.2011
Public Equity
Jennison Associates
Quantitative Management Associates
•
$86 billion in equity AUM
(1)
•
$47 billion in equity AUM
(1)
•
Fundamental
•
Quantitative
•
Growth
•
Blend
•
Value
•
Multi-Cap
•
Equity income
•
Midcap growth
•
Small Cap
•
Sector strategies
•
Global
•
Core
•
Value
•
All Cap
•
Mid Cap
•
Small Cap
•
Global
•
International
•
Emerging Markets
•
Index
•
Asset Allocation
•
Domestic and Global
•
Domestic and Global
•
162 Institutional equity clients
(1)
•
140 Institutional clients
(1)
•
48 Investment professionals
(2)
•
35 Investment professionals
(1)
1)
As of March 31, 2011.
2)
As of May 24, 2011.
9 |
 Investor Day 6.9.2011
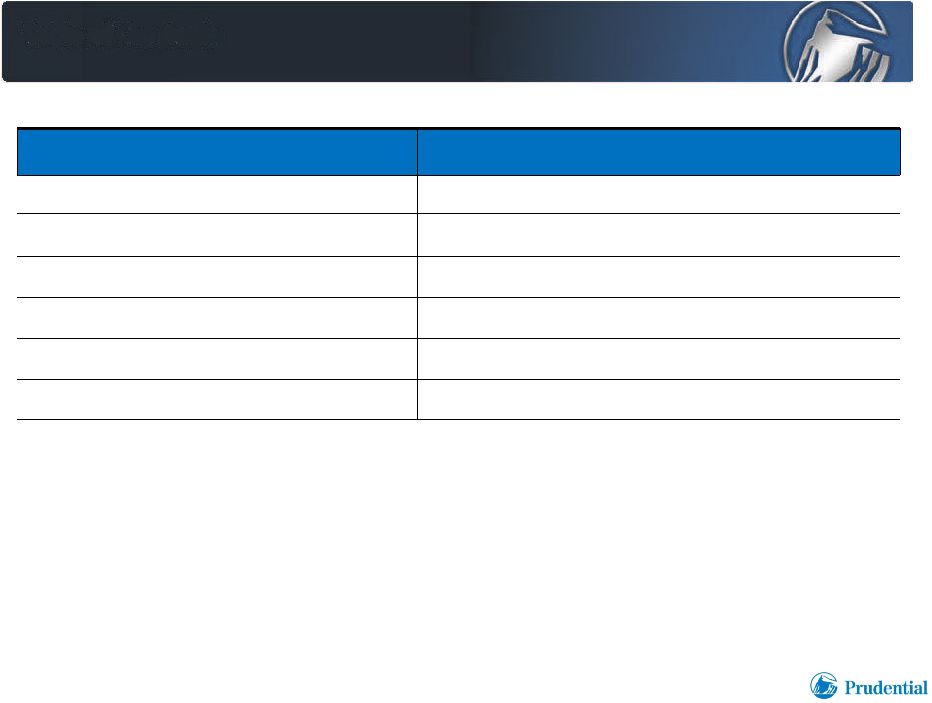
Private Fixed Income
10
1)
As of March 31, 2011.
Prudential Capital Group
Prudential Capital Group
Prudential Mortgage Capital Company
Prudential Mortgage Capital Company
•
$54 billion AUM
(1)
in private debt
•
$34 billion AUM
(1)
in commercial mortgages
•
Operations in U.S. and Europe
•
Operations in U.S. and Japan
•
Direct origination network
•
Direct origination network
•
$10 billion originations in 2010
•
$9 billion originations in 2010
•
Over 900 Borrowers
•
Over 2,000 Borrowers
•
140 Investment professionals
(1)
•
105 Investment professionals
(1) |
 Investor Day 6.9.2011
Prudential Real Estate Investors
11
1)
As of March 31, 2011.
Prudential Real Estate Investors
Prudential Real Estate Investors
•
$28 billion AUM
(1)
•
Operations in U.S., Europe, Asia, and Latin America
•
One of few global real estate investment managers
•
21 offices worldwide
(1)
•
490 Institutional clients
(1)
•
56 Funds managed
(1)
•
Asia (5), Europe (18), Mexico (7), U.S. (17), REITS (9)
•
216 investment professionals
(1) |
 Investor Day 6.9.2011
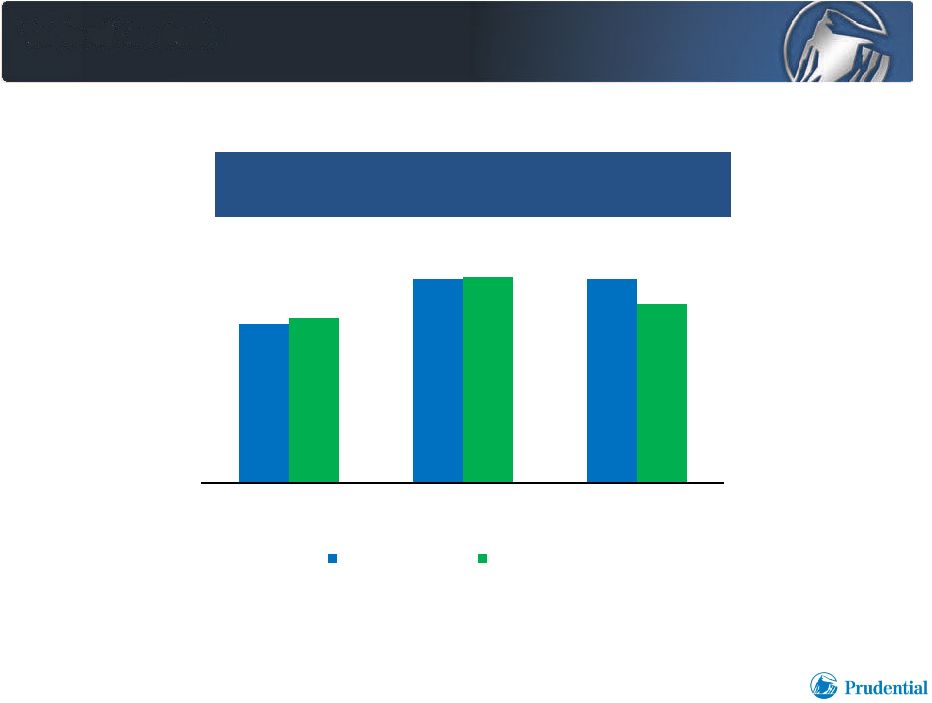
66%
84%
84%
68%
85%
74%
1 Year
3 Year
5 Year
As of 3/31/10
As of 3/31/11
Our Investment Performance Track Record is Strong
12
% of Total Third Party Assets Under Management
% of Total Third Party Assets Under Management
Exceeding Benchmark
Exceeding Benchmark
1)
70% ($247 billion) of Retail and Institutional assets under management as of March
31, 2011 is actively managed against a benchmark. •
Percentage
of
AUM
exceeding
their
respective
benchmarks
has
been
strong
in
the
1,
3,
and
5
year
periods
(1) |
 Investor Day 6.9.2011
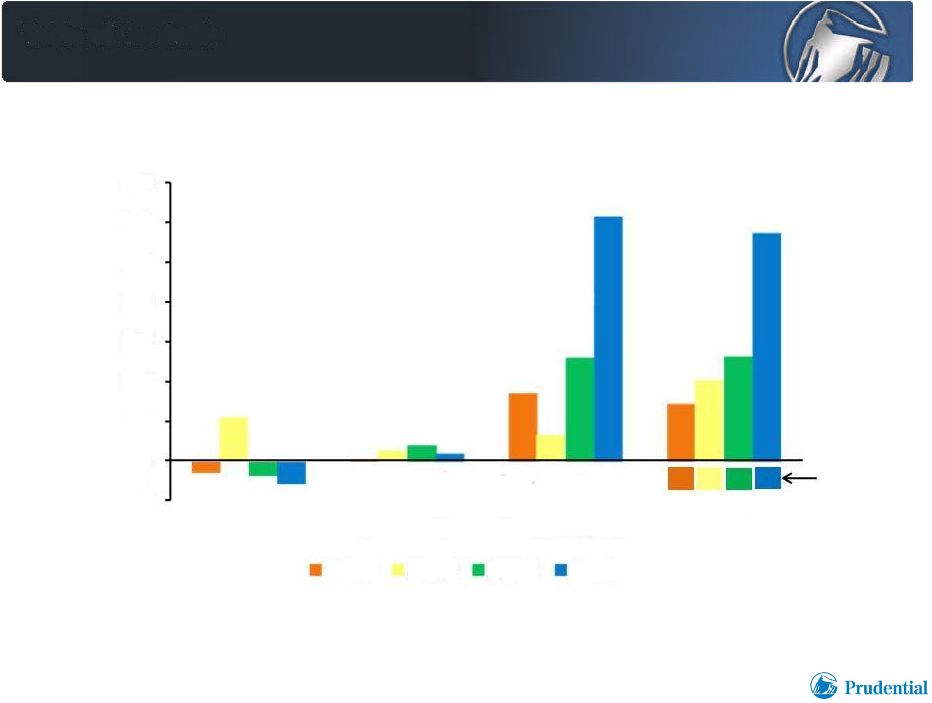
Net flows exclude money market flows, one-time transfers, and
acquisition/disposition events Third Party Net Institutional Flows
Reached Record Levels in 2010
13
$ billions
Percent of
beginning
of year
AUM
$(5)
$
$5
$10
$15
$20
$25
$30
$35
Equity
Real Estate
Fixed Income
Total
2007
2008
2009
2010
6
7
10
19 |
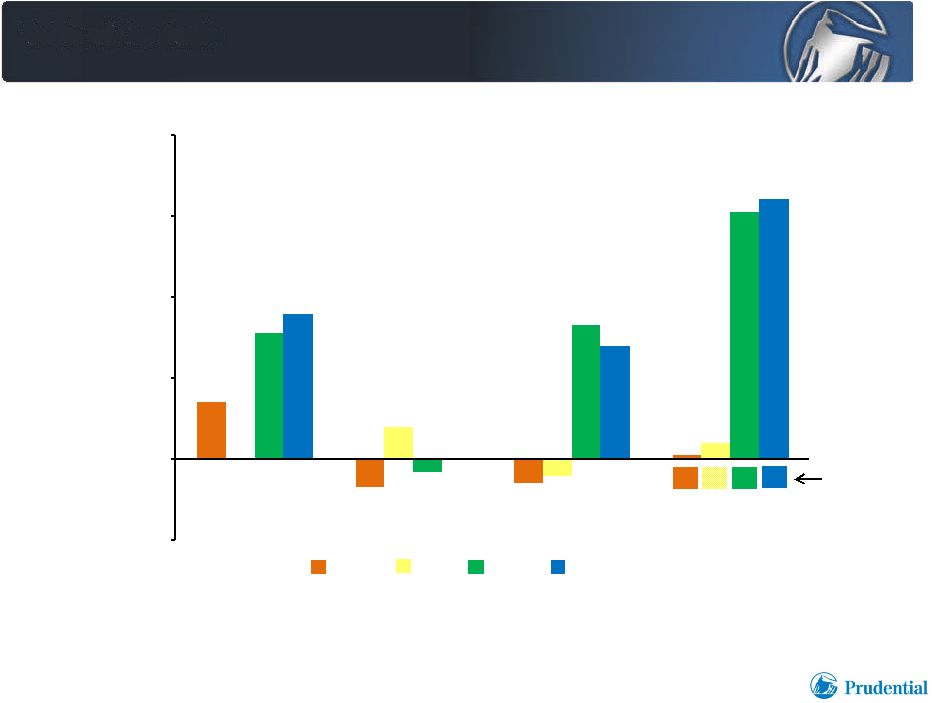 Investor Day 6.9.2011
$(2)
$-
$2
$4
$6
$8
Third Party Retail Client Flows
Also Reached Record Levels in 2010
14
$ billions
Net flows exclude money market flows, one-time transfers, and
acquisition/disposition events 1
-
18
13
Percent of
beginning
of year
AUM
Equity
Real Estate
Fixed Income
Total
2008
2007
2009
2010 |
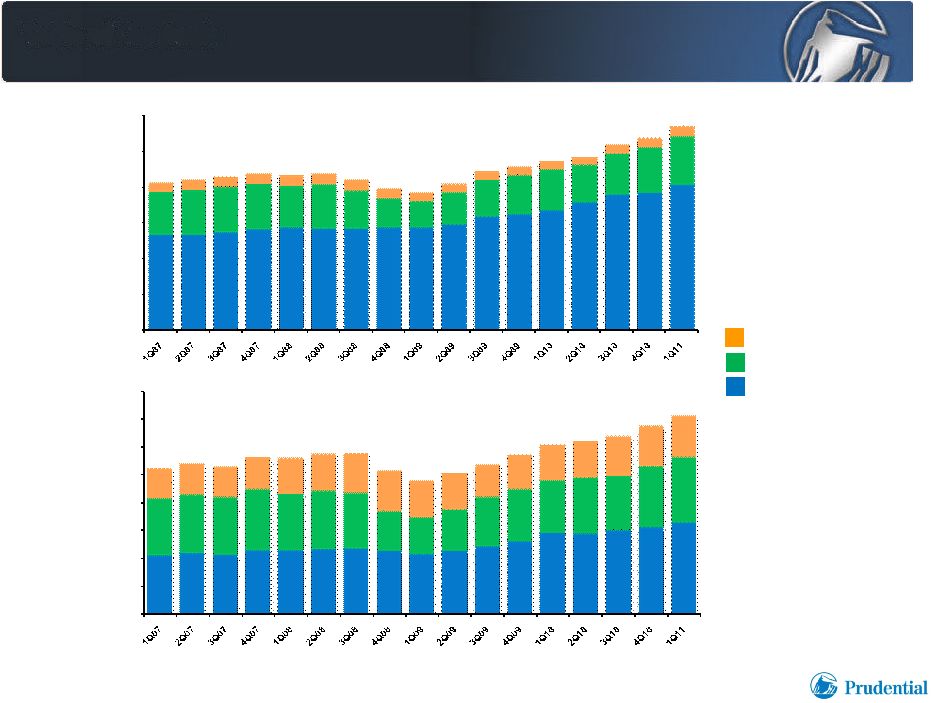 Investor Day 6.9.2011
$414
$420
$430
$438
$434
$439
$422
$395
$386
$409
$444
$457
$472
$484
$518
$537
$569
$0
$100
$200
$300
$400
$500
$600
Assets Under Management by Asset Class
Growth in AUM has Driven
Growth in Asset Management Fees
15
1)
At end of period.
$ billions
$ millions
(1)
Fixed Income
Real Estate
Equity
$262
$271
$265
$283
$281
$288
$289
$257
$239
$254
$269
$287
$304
$311
$320
$338
$356
$0
$50
$100
$150
$200
$250
$300
$350
$400
Asset Management Fees by Asset Class |
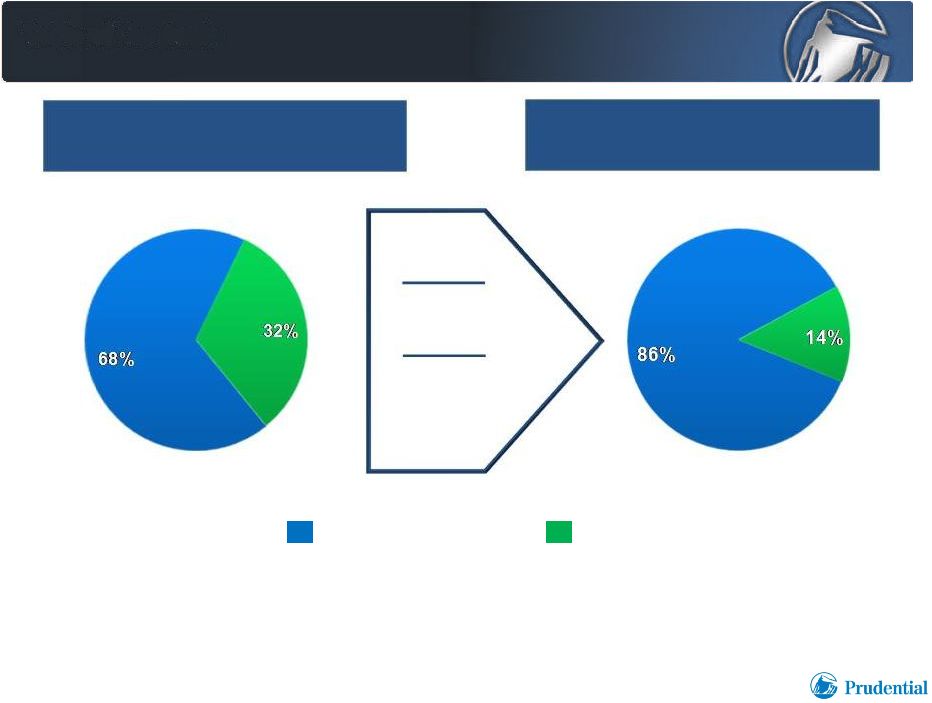 Investor Day 6.9.2011
Quality of Revenues Increasing
16
1)
Asset management fees and incentive, transaction, principal investing and
commercial mortgage (ITPICM) revenues. 2)
As originally reported.
Asset Management Fees
ITPICM
Growing
AUM Base
Reduced proprietary
investing exposure
Exited commercial
mortgage
securitization
conduit
$1.1 billion
$1.1 billion
$1.3 billion
$1.3 billion
2007 Asset Management Fees
2007 Asset Management Fees
+
+
“ITPICM”
“ITPICM”
=
=
$1.6
$1.6
billion
billion
(1)(2)
(1)(2)
2010 Asset Management Fees
2010 Asset Management Fees
+
+
“ITPICM”
“ITPICM”
=
=
$1.5
$1.5
billion
billion
(1)
(1) |
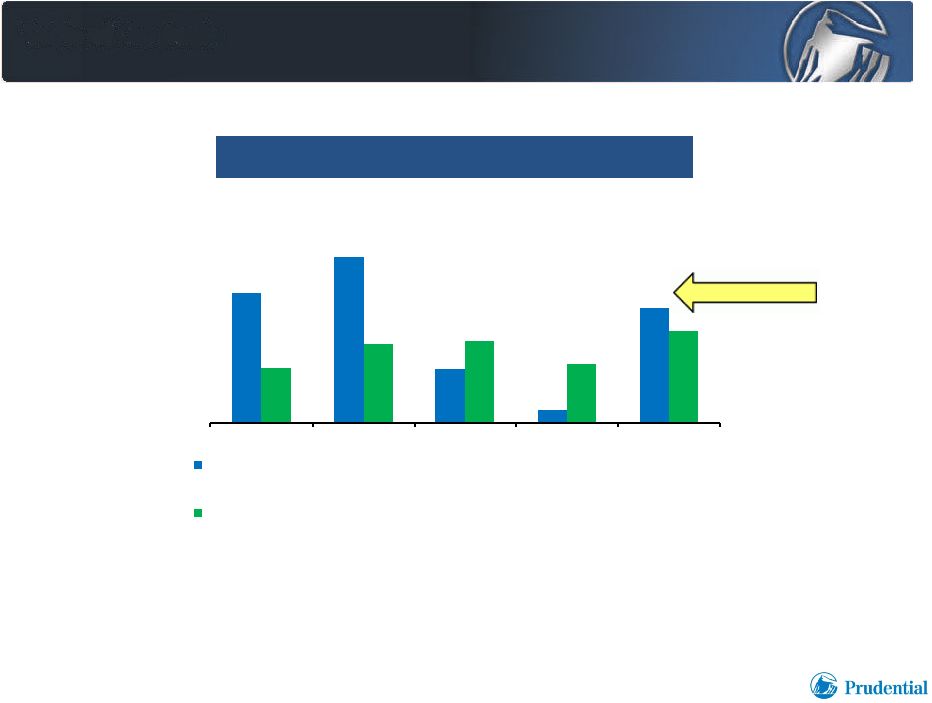 Investor Day 6.9.2011
$550
$701
$232
$55
$487
2006
2007
2008
2009
2010
Asset Management segment pre-tax adjusted operating income
Asset Management segment pre-tax adjusted operating income,
excluding contribution of Incentive, Transaction, Principal Investing and
Commercial Mortgage Activities ("ITPICM")
Building Sustainable Earnings Power
17
Pre-Tax Adjusted Operating Income
Pre-Tax Adjusted Operating Income
1)
Based on after-tax adjusted operating income for the year ended December 31,
2010 and overall effective tax rate for the Financial Services Businesses.
2)
ITPICM contribution represents revenues net of directly associated costs before
allocated compensation including Incentive Awards; excludes agency
origination activities.
(2)
$ millions
20% ROE
(1) |
 Investor Day 6.9.2011
•
Robust institutional and retail businesses attract and retain talented
investment professionals
•
Strong investment performance has contributed to significant third party flows
and growth in AUM
•
Asset management fees have been a stable percentage of AUM historically
and are expected to grow about in line with AUM
•
Asset management business has operating leverage; therefore, AOI
attributable to asset management fees grows faster than revenue from fees
•
ITPICM activities are sources of additional revenue and AOI, but
are
managed to be smaller and more stable than in the past
•
Our business model positions us well for continued growth and high ROE
Key Takeaways
18 |
 PRUDENTIAL ANNUITIES
MARKET-LEADING VALUE PROPOSITION
MARKET-LEADING VALUE PROPOSITION
DRIVES GROWING RETURNS AND IMPROVING RISK PROFILE
DRIVES GROWING RETURNS AND IMPROVING RISK PROFILE
STEVE PELLETIER
STEVE PELLETIER
PRESIDENT
PRESIDENT
PRUDENTIAL ANNUITIES
PRUDENTIAL ANNUITIES |
 •
Highly differentiated and sustainable strategy
•
#1 in advisor-sold variable
annuity sales
(1)
•
Leading positions in independent financial
planner, wirehouse, bank and insurance
agent channels
•
“Highest Daily”
living benefits serve
retirement income security needs of
attractive, growing market
•
Contract-level product based risk
management protects account values;
proven through financial market meltdown
Prudential Annuities
Superior Value Proposition and Business Prospects
1
•
Business growth driven by
strong net flows
•
Growing returns on
increasing base
•
Popularity of auto-
rebalancing products drives
improving overall risk profile
•
Demographic “push”
and individual
retirement responsibility
provide sustained
growth opportunity
1)
Source: VARDS 1Q’11 Report, Advisor-sold, excludes group/retirement plan
contracts. Proven Value Proposition
Proven Value Proposition
Market Leadership
Market Leadership
Strong Business Prospects
Strong Business Prospects
Investor Day 6.9.2011 |
 Investor Day 6.9.2011
Drivers of Market Leadership
2
•
Innovative retirement
income guarantee features
•
Proven product-based risk
management protecting
account values
•
Sophisticated
hedging capabilities
•
Broad multi-channel
distribution
•
Scale supporting efficient
cost structure
•
Brand, reputation and
demonstrated commitment
to market |
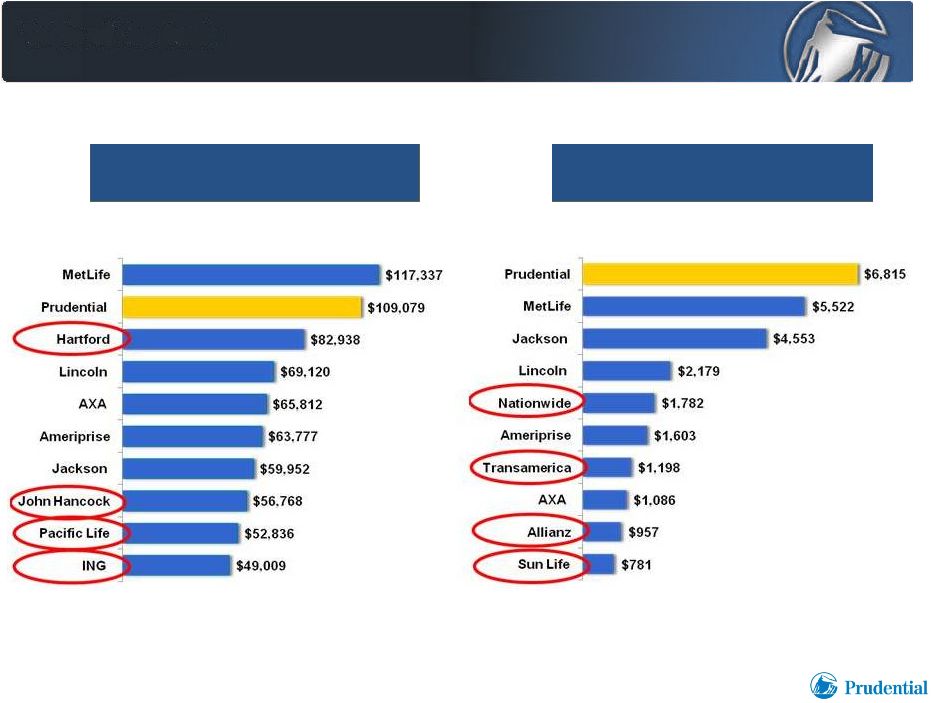 Investor Day 6.9.2011
($ millions)
Variable Annuity
Variable Annuity
Assets Under Management
Assets Under Management
(1)
(1)
Advisor-Sold
Variable
Variable
Annuity
Annuity
Sales
Sales
(1)
(1)
Prudential Annuities
1Q11 Asset and Sales Rankings
1)
Source: VARDS 1Q’11 report. Advisor-sold, excludes group/retirement
plan contracts. ($ millions)
3 |
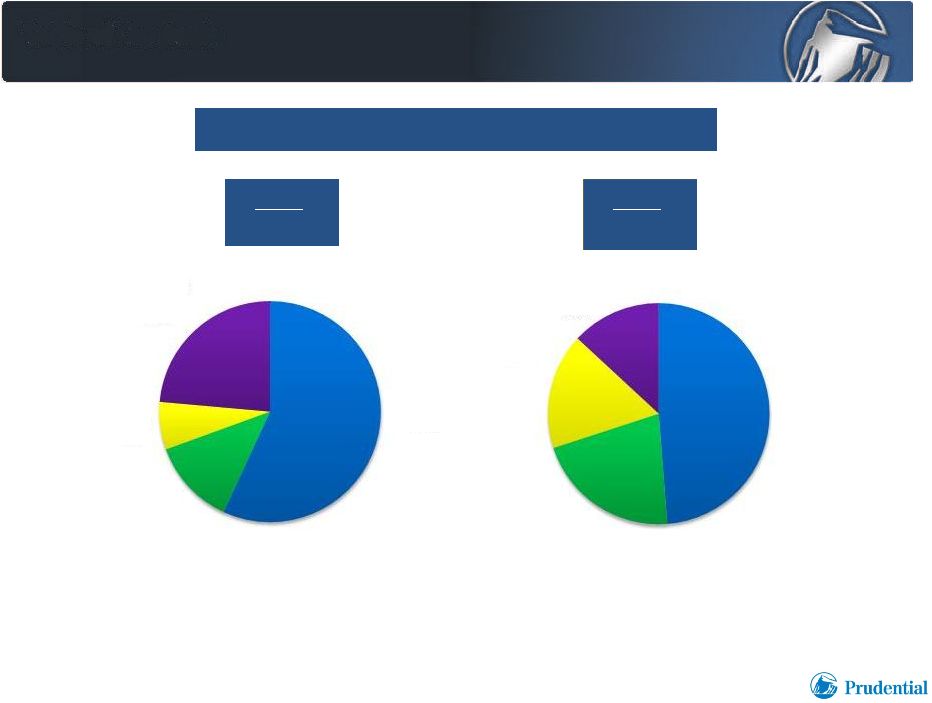 Investor Day 6.9.2011
Building Multi-Channel Distribution Strength
4
Prudential
Prudential
Individual
Individual
Annuity
Annuity
Gross
Gross
Sales
Sales
(1)
(1)
1)
In millions; includes variable and fixed annuities.
2008
2008
$10,329
$10,329
2010
2010
$21,754
$21,754
Insurance
Agents
24%
Bank
7%
Independent
57%
Insurance
Agents
13%
Bank
17%
Wirehouse
21%
Independent
49%
Wirehouse
12% |
 Investor Day 6.9.2011
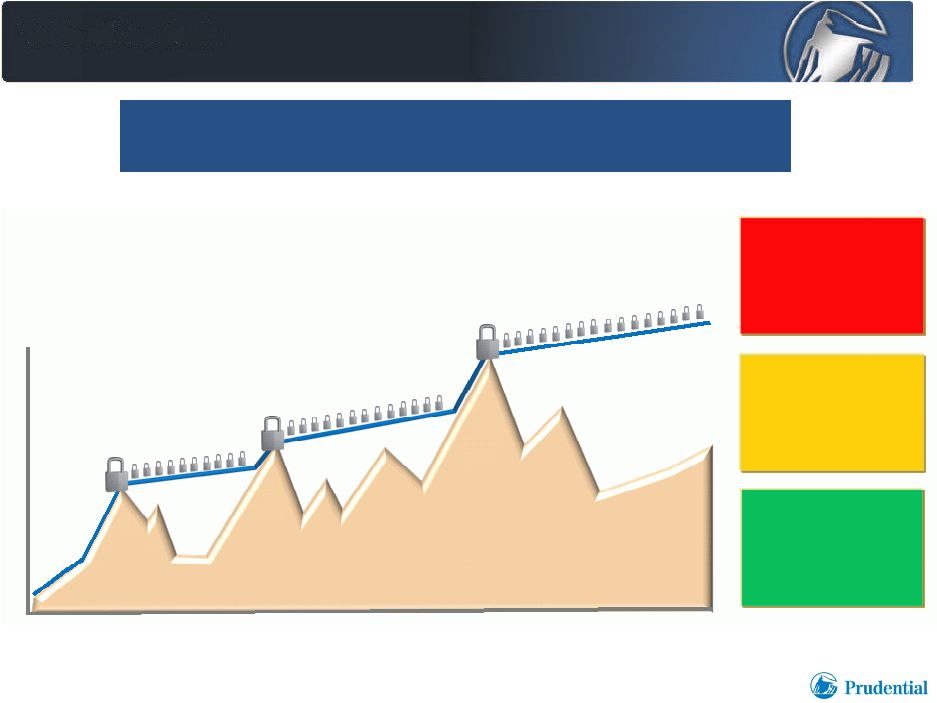
Product Design:
The Highest Daily Lock-In
Hypothetical for illustrative purposes only.
5
Prudential’s unique Highest Daily Product
Prudential’s unique Highest Daily Product
is a powerful feature that continues to drive strong sales
is a powerful feature that continues to drive strong sales.
5
Account Value
This is a hypothetical example for illustrative purposes only. It does not reflect
a specific annuity or the performance of any investment. Source for
percentages: Standard & Poor's, Barclay's Capital; based on analysis of 2,245 rolling ten-year periods assuming 80%
allocation to equities and 20% allocation to bonds.
What are the chances
of a daily lock-in
capturing the
best day?
100%
What are the chances
of a quarterly lock-in
capturing the
best day?
6%
What are the chances
of an annual lock-in
capturing the
best day?
2% |
 Investor Day 6.9.2011
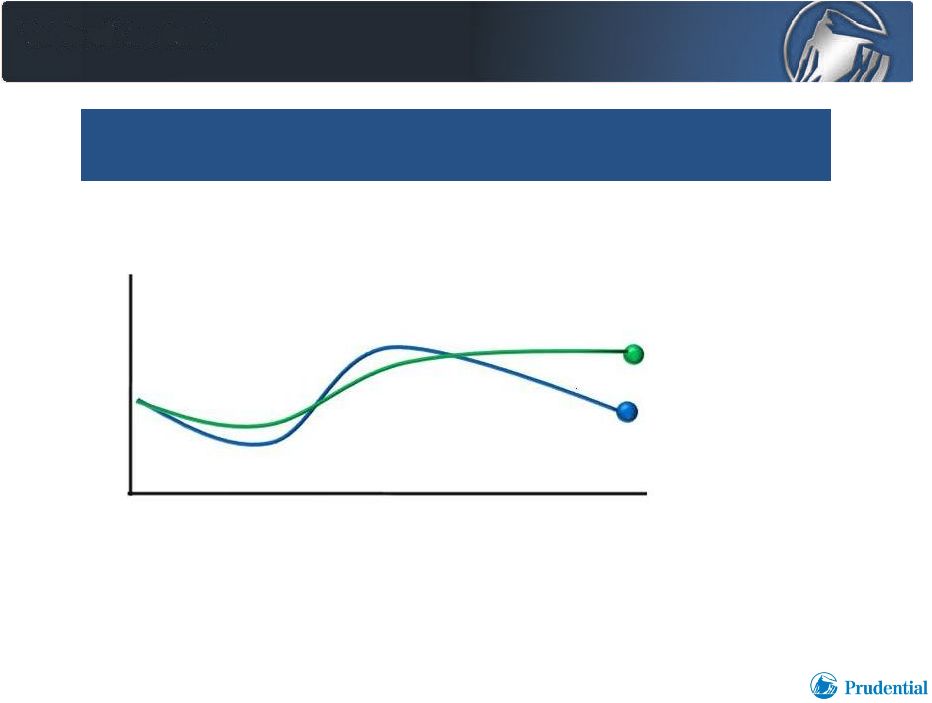
Product Embedded Risk Management
Protects Account Values at Contract Level
6
Note: For illustrative purposes, not representative of actual results.
Powerful algorithmic risk mitigation tool protects client account
Powerful algorithmic risk mitigation tool protects client account
values in market downturns and improves our risk profile.
values in market downturns and improves our risk profile.
6
Account Value without auto-rebalancing
Account Value with auto-rebalancing
Time
Account
Value |
   Investor Day 6.9.2011
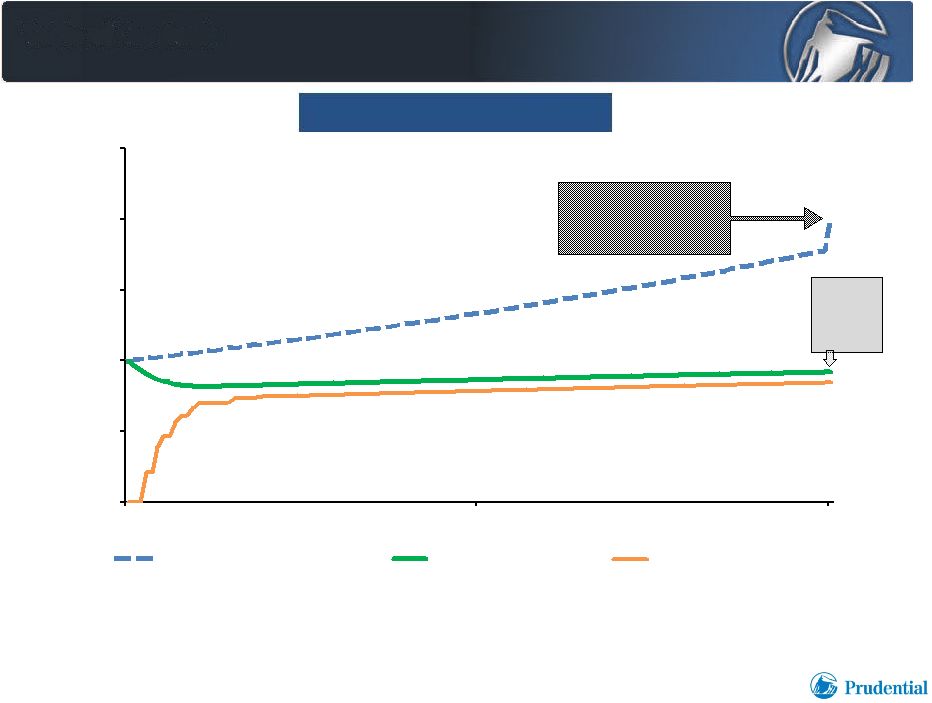
$0
$50,000
$100,000
$150,000
$200,000
$250,000
0
60
120
Protected Withdrawal Value
Total Account Value
Bond Fund Value
Account Value and
“Protected Withdrawal Value”
“PWV”: notional amount
for calculation of
lifetime annual withdrawals
Year
0
6
12
7
Account
value
available to
customer
Market Downturn Scenario
Market Downturn Scenario
(1)
(1)
(“PWV”)
1)
Highest Daily Lifetime Income (HDI) – sub-accounts suffer 30% decline in year 1, followed by
0% sub-account return thereafter; bond fund assumed annual return of 3%. No withdrawals
through end of year 12. All quoted returns are net of fund management and base policy fees. The fee for HDI was explicitly deducted from the account value on
a quarterly basis. |
    Investor Day 6.9.2011
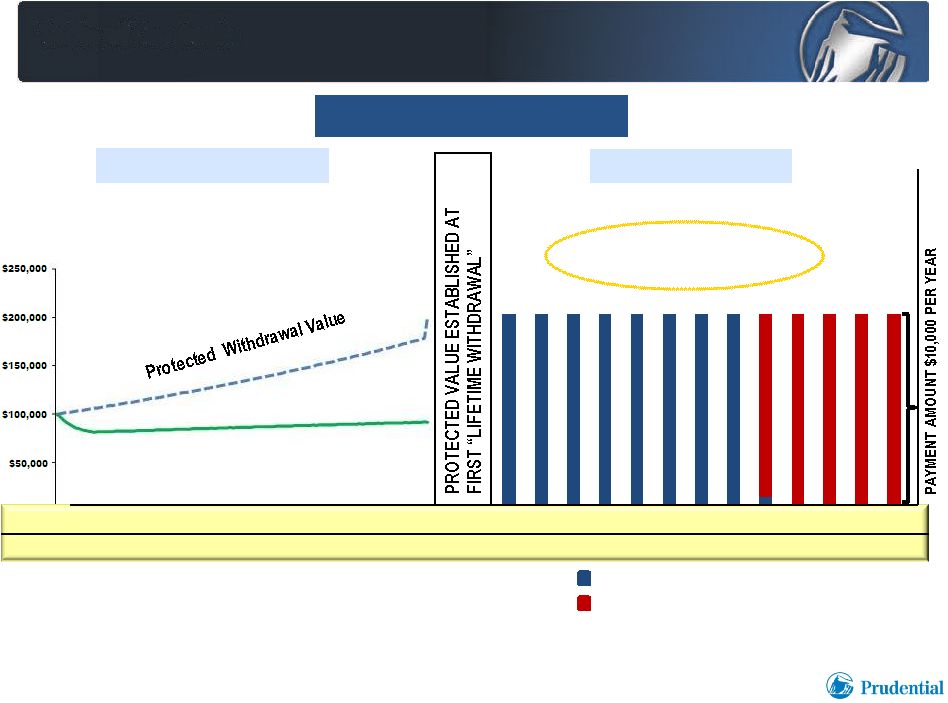
Guaranteed Lifetime Withdrawals
Client’s Account Value Pays First
Account Value
Client Age
60
72
85
Year
0
12
25
Annual Payments = $10,000,
5% x Protected Value
Accumulation Period
Accumulation Period
Retirement Period
Retirement Period
= Customer account value withdrawals
= Prudential funds
Market Downturn Scenario
Market Downturn Scenario
(1)
(1)
81
8
$0
1)
Highest Daily Lifetime Income (HDI) – sub-accounts suffer 30% decline in year 1, followed by
0% sub-account return thereafter; bond fund assumed annual return of 3%. Withdrawals
commence at end of year 12. All quoted returns are net of fund management and base policy fees. The fee for HDI was
explicitly deducted from the account value on a quarterly basis. |
 Investor Day 6.9.2011
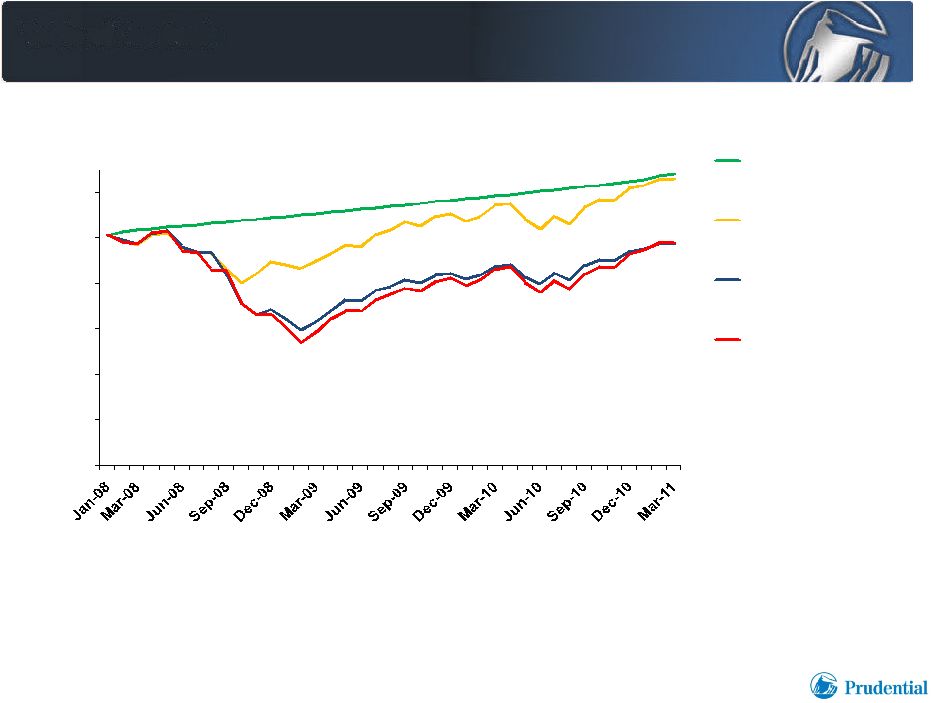
Auto-Rebalancing
Proven Through Financial Market Crisis…
and Beyond
9
This illustration analysis for HD Lifetime Seven assumes a $500,000 initial
investment into the AST Capital Growth Portfolio & AST Investment Grade
Bond Portfolio and election on February 23, 2009 of the 90% limit on bond fund
allocation. $0
$100,000
$200,000
$300,000
$400,000
$500,000
$600,000
Protected Withdrawal
Value +28%
HD7 Account Value
+26%
Account Value w/o
Auto-rebalancing
Formula (3%)
S&P 500 (2%)
Account Value
% of HD Account
Value Invested in
Customer-Selected
Funds
(1)
1)
Assumes investment of funds in S&P 500 index on launch date of HD Lifetime
Seven, January 28, 2008. |
 Investor Day 6.9.2011
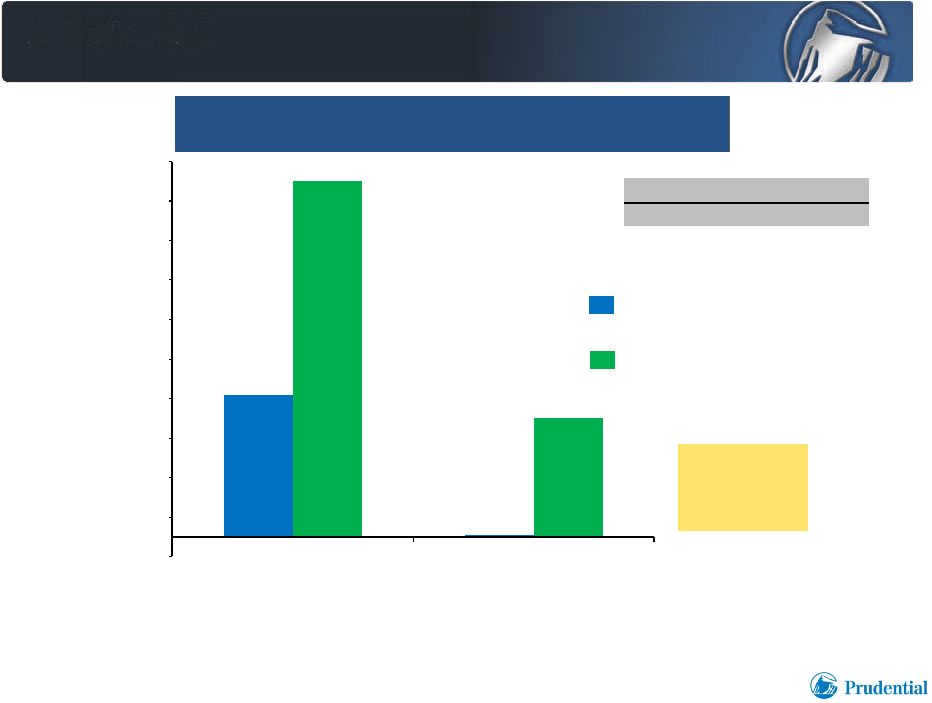
7.2%
0.1%
18.0%
6.0%
-1%
1%
3%
5%
7%
9%
11%
13%
15%
17%
19%
20% loss of account value
33% loss of account value
Comparison of a VA with Auto-Rebalancing
to a VA without Auto-Rebalancing
10
Probability that a client’s account value suffers a
20%
or
33%
loss
over
a
hypothetical
ten-year
period
(1)
Variable Annuity (“VA”) with
Auto-Rebalancing
Variable Annuity without
Auto-Rebalancing
Based on
Ernst & Young
Monte Carlo
simulation
Limited “opportunity cost”
~40 bps mean return reduction
1)
Key assumptions used in analysis: Fees (same for both VAs): Mortality and Expense charge of 1.35%,
Asset Management fees of .95%, and lifetime withdrawal benefit fee of 1%. Asset
allocation: 55-year-old client’s original asset allocation assumed to be 70% equities and 30% fixed-income. Asset transfer
algorithm: The algorithm used in this analysis is the same algorithm employed in Prudential’s
Highest Daily Income Benefit and Premier variable annuities. This analysis is not intended to
be indicative of actual results for Prudential’s or any other provider’s variable annuity. While the algorithm is intended to reduce
account value volatility, it is not a tool to optimize investment results. The projections generated
by the Ernst & Young Monte Carlo simulation regarding the likelihood of various investment
outcomes are hypothetical in nature, do not reflect actual investment results, and are not guarantees of future results. The
analysis presents a range of possible outcomes; the calculated results will vary with each use and
over time. |
 Investor Day 6.9.2011
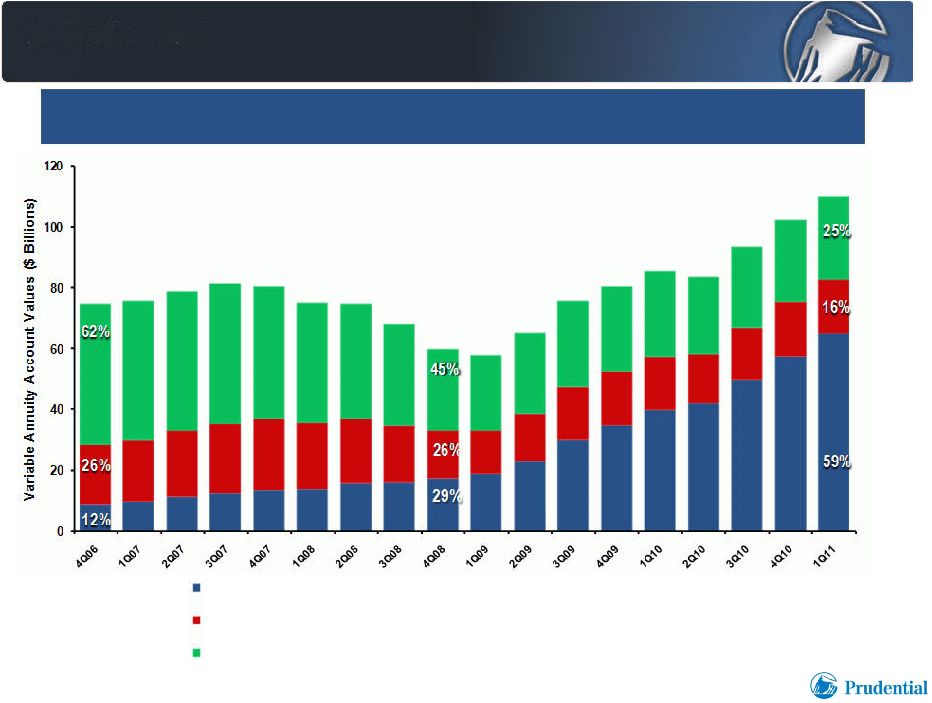
Improving Risk Profile
14
11
Variable
Annuity
Account
Values
with
Living
Benefits
with
auto-rebalancing
feature
Variable Annuity Account Values without any Living Benefit options
Variable
Annuity
Account
Values
with
Living
Benefits
with
auto-rebalancing
feature
The accelerated growth in our overall block has also increased the percentage of
algorithmic mechanism
based
account
values,
which
will
continue
to
improve
the
level
and
volatility
of
returns. |
 Investor Day 6.9.2011
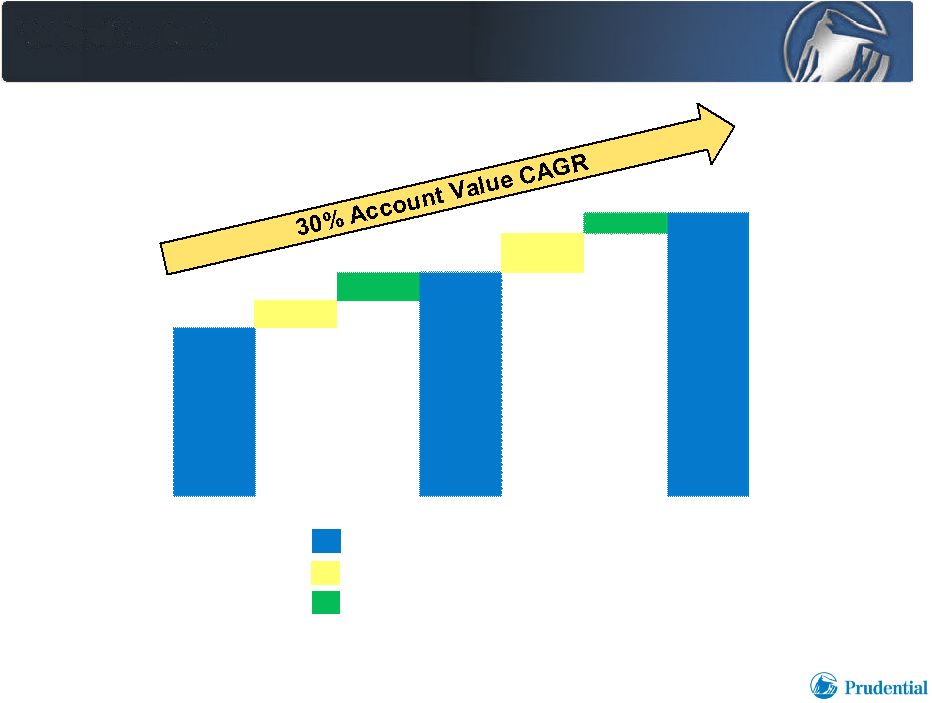
2008
2009
2010
Strong Net Sales Contribute to
Growing Account Value Base
(1)
12
1)
Account values as of end of period; includes variable and fixed annuities. In
billions. $63.3
$63.3
$10.3
$10.4
$84.0
$84.0
$14.6
$7.6
$106.2
$106.2
Account values
Net sales
Market appreciation and other activity |
 Investor Day 6.9.2011
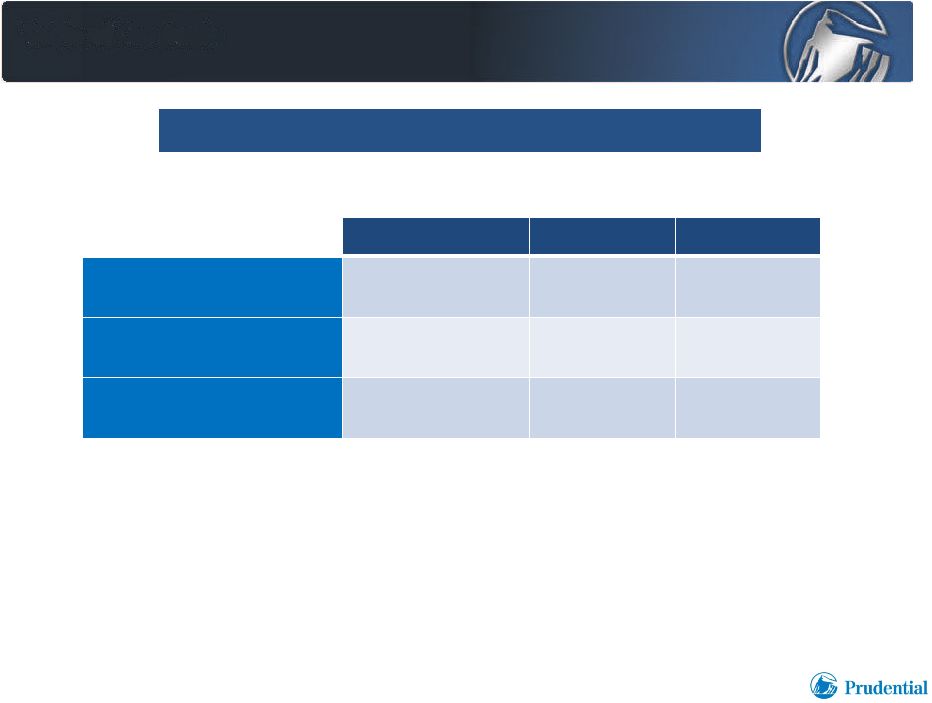
Well Positioned to Retain
Auto-Rebalancing Business In-Force
13
Less Than 1%
Less Than 1%
1% to 3%
1% to 3%
Over 3%
Over 3%
6%
2%
92%
54%
10%
36%
25%
5%
70%
Surrender
Surrender
Charges
Charges
Applicable
Applicable
to
to
Account
Account
Values
Values
(1)
(1)
1)
Surrender charges as percentage of variable annuity account values; as of March 31,
2011. Auto-Rebalancing
$65 B
Non-Auto-Rebalancing
$45 B
Total
$110 B |
 Investor Day 6.9.2011
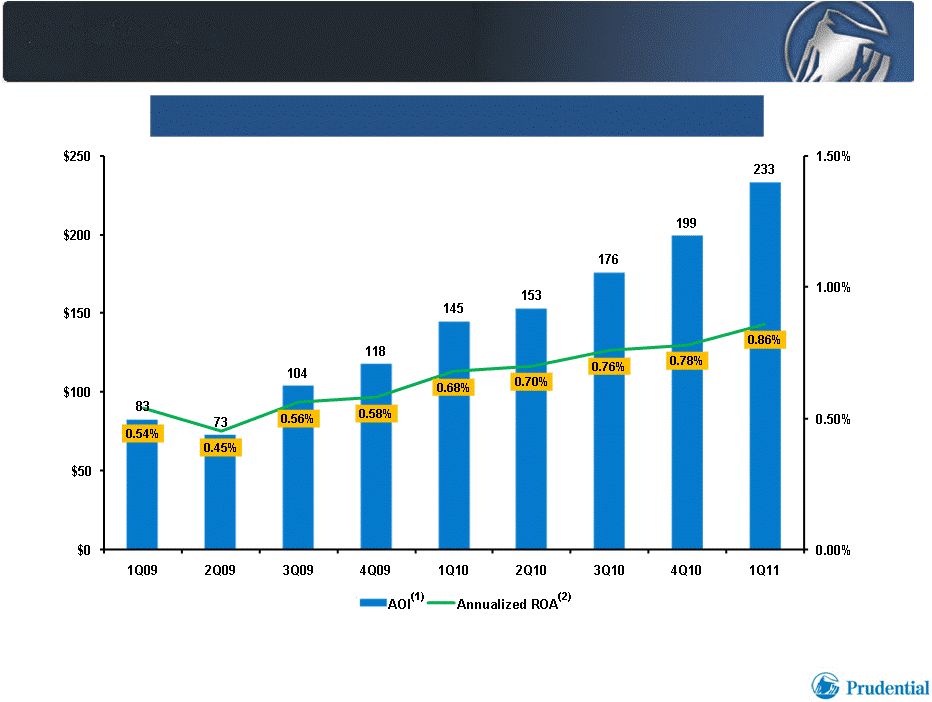
Growing Returns on an Increasing Base
14
1)
Excludes market
driven
and
other
discrete
items
disclosed
by
the
company
including
unlockings
of
deferred
policy
acquisition
and
other
costs
and
reserves
for guaranteed minimum death and income benefits. See “Reconciliation for
Individual Annuities pre-tax adjusted operating income excluding disclosed
items”
within this presentation for further information.
2)
Pretax adjusted operating income excluding disclosed items as percentage of average
account values for variable and fixed annuities. ($ millions)
Adjusted Operating Income –
Excluding Disclosed Items
Investor Day 6.9.2011 |
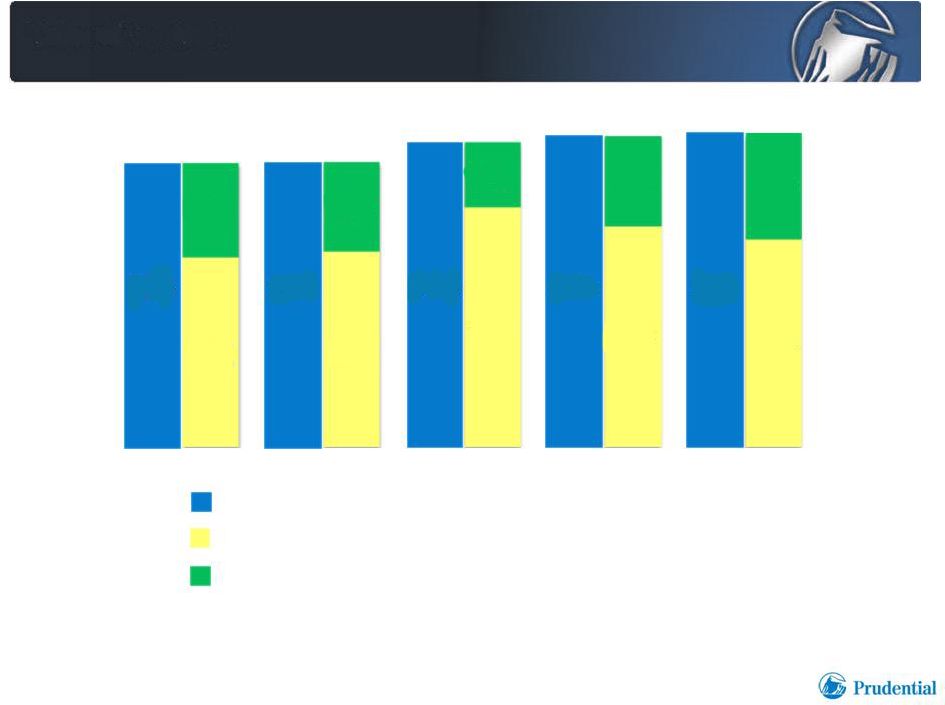 Improving Product Mix and Market Performance
Drive Growing Returns
15
Net
revenues
(1)
as
percentage
of
average
account
values
(2)
Operating
expenses
(1)
as
percentage
of
average
account
values
(2)
“ROA”: Pretax adjusted operating income excluding disclosed items
as
percentage
of
average
account
values
(2)
2007
2008
2009
2010
1Q11
Investor Day 6.9.2011
2.31%
2.32%
2.48%
2.53%
2.55%
1.55%
1.60%
1.95%
1.80%
1.69%
0.76%
0.72%
0.53%
0.73%
0.86%
1)
“Net revenues” and “operating expenses” based on adjusted operating income
excluding market driven and other discrete items disclosed by the company including unlockings
of deferred policy acquisition and other costs and reserves. “Net revenues” and “operating expenses” reflect
reclassification of certain amounts included in reported revenue and expense line items (e.g., asset
management fees netted against revenues for purposes of this display).
2)
Annualized for interim period.
|
 Investor Day 6.9.2011
•
Market leadership driven by superior value proposition
•
Expanding distribution strength across multiple channels
•
Popularity of auto-rebalancing products driving improving
risk profile
•
Product structure, strong net sales and market performance
producing increasing returns on a growing base of business
•
Sustainable, profitable growth in an attractive market
Key Takeaways
16 |
 PRUDENTIAL FINANCIAL, INC.
JOHN STRANGFELD
CHAIRMAN AND CEO
|
 Investor Day 6.9.2011
Key Takeaways
Key Takeaways
1
•
Attractive return opportunities in high quality businesses, supported by
strong balance sheet
•
Balanced portfolio of selected risks; improving risk profile
•
Expanding distribution: market leadership across multiple channels
•
Growth engines in International Insurance, Annuities and
Asset Management
•
Capital management: balanced approach to investing in businesses,
returning capital to investors
•
Proven acquisition and integration track record
•
Seasoned management team; focus on talent and leadership
|