SLIDE PRESENTATION OF PRUDENTIAL FINANCIAL, INC.
Published on
 May
24, 2012 May 24, 2012
Prudential Financial, Inc.
Financial Strength Symposium
Exhibit 99.1 |
 Forward-Looking Statements
Financial Strength Symposium 5.24.2012
2
Certain of the statements included in this presentation constitute forward-looking statements
within the meaning of the U. S. Private Securities Litigation Reform Act of 1995. Words such as
“expects,” “believes,” “anticipates,” “includes,” “plans,” “assumes,” “estimates,” “projects,” “intends,”
“should,” “will,” “shall,” or variations of such words are generally
part of forward-looking statements. Forward-looking statements are made based on
management’s current expectations and beliefs concerning future developments and their potential effects upon Prudential Financial, Inc. and
its subsidiaries. There can be no assurance that future developments affecting Prudential
Financial, Inc. and its subsidiaries will be those anticipated by management. These
forward-looking statements are not a guarantee of future performance and involve risks and uncertainties, and
there are certain important factors that could cause actual results to differ, possibly materially,
from expectations or estimates reflected in such forward-looking statements, including,
among others: (1) general economic, market and political conditions, including the performance and
fluctuations of fixed income, equity, real estate and other financial markets; (2) the availability
and cost of additional debt or equity capital or external financing for our operations; (3)
interest rate fluctuations or prolonged periods of low interest rates; (4) the degree to which we choose not
to hedge risks, or the potential ineffectiveness or insufficiency of hedging or risk management
strategies we do implement, with regard to variable annuity or other product guarantees; (5)
any inability to access our credit facilities; (6) reestimates of our reserves for future policy benefits and
claims; (7) differences between actual experience regarding mortality, morbidity, persistency,
surrender experience, interest rates or market returns and the assumptions we use in pricing
our products, establishing liabilities and reserves or for other purposes; (8) changes in our
assumptions related to deferred policy acquisition costs, value of business acquired or goodwill; (9)
changes in assumptions for retirement expense; (10) changes in our financial strength or credit
ratings; (11) statutory reserve requirements associated with term and universal life insurance
policies under Regulation XXX and Guideline AXXX; (12) investment losses, defaults and counterparty non-performance;
(13) competition in our product lines and for personnel; (14) difficulties in marketing and
distributing products through current or future distribution channels; (15) changes in tax law;
(16) economic, political, currency and other risks relating to our international operations; (17) fluctuations in
foreign currency exchange rates and foreign securities markets; (18) regulatory or legislative
changes, including the Dodd-Frank Wall Street Reform and Consumer Protection Act; (19)
inability to protect our intellectual property rights or claims of infringement of the intellectual property
rights of others; (20) adverse determinations in litigation or regulatory matters and our exposure to
contingent liabilities, including in connection with our divestiture or winding down of
businesses; (21) domestic or international military actions, natural or man-made disasters including terrorist
activities or pandemic disease, or other events resulting in catastrophic loss of life; (22)
ineffectiveness of risk management policies and procedures in identifying, monitoring and
managing risks; (23) effects of acquisitions, divestitures and restructurings, including possible difficulties
in integrating and realizing the projected results of acquisitions, including risks associated with
the acquisition of certain insurance operations in Japan; (24) interruption in
telecommunication, information technology or other operational systems or failure to maintain the security,
confidentiality or privacy of sensitive data on such systems; (25) changes in statutory or U.S. GAAP
accounting principles, practices or policies; (26) Prudential Financial, Inc.’s primary
reliance, as a holding company, on dividends or distributions from its subsidiaries to meet debt payment
obligations and the ability of the subsidiaries to pay such dividends or distributions in light of our
ratings objectives and/or applicable regulatory restrictions; and (27) risks due to the lack of
legal separation between our Financial Services Businesses and our Closed Block Business.
Prudential Financial, Inc. does not intend, and is under no obligation, to update any particular
forward-looking statement included in this presentation. Prudential
Financial, Inc. of the United States is not affiliated with Prudential PLC which is headquartered in the United Kingdom. |
 Non–GAAP Measures
Financial Strength Symposium 5.24.2012
3
The information referred to above and on the prior page, as well as the risks of our businesses
described in our Forms 10-K and 10-Q, should be considered by readers when reviewing
forward-looking statements contained in this presentation.
This presentation includes references to “adjusted operating income.” Adjusted operating
income is a non-GAAP measure of performance of our Financial Services Businesses.
Adjusted operating income excludes “Realized investment gains (losses), net,” as adjusted, and related charges and adjustments. A significant element of
realized investment gains and losses are impairments and credit-related and interest
rate-related gains and losses. Impairments and losses from sales of credit-
impaired securities, the timing of which depends largely on market credit cycles, can vary
considerably across periods. The timing of other sales that would result in gains or losses,
such as interest rate-related gains or losses, is largely subject to our discretion and influenced by market opportunities as well as our tax and capital
profile.
Realized investment gains (losses) within certain of our businesses for which such gains (losses) are
a principal source of earnings, and those associated with terminating hedges of foreign
currency earnings and current period yield adjustments are included in adjusted operating income. Adjusted operating income
excludes realized investment gains and losses from products that contain embedded derivatives, and
from associated derivative portfolios that are part of a hedging program related to the risk of
those products. Adjusted operating income also excludes gains and losses from changes in value of certain assets and
liabilities relating to foreign currency exchange movements that have been economically hedged or
considered part of our capital funding strategies for our international subsidiaries, as well
as gains and losses on certain investments that are classified as other trading account assets.
Adjusted operating income also excludes investment gains and losses on trading account assets
supporting insurance liabilities and changes in experience-rated contractholder liabilities
due to asset value changes, because these recorded changes in asset and liability values are expected to ultimately accrue to
contractholders. Trends in the underlying profitability of our businesses can be more clearly
identified without the fluctuating effects of these transactions. In addition, adjusted
operating income excludes the results of divested businesses, which are not relevant to our ongoing operations. Discontinued operations, which
is presented as a separate component of net income under GAAP, is also excluded from adjusted
operating income.
We believe that the presentation of adjusted operating income as we measure it for management purposes
enhances understanding of the results of operations of the Financial Services Businesses by
highlighting the results from ongoing operations and the underlying profitability of our businesses. However, adjusted
operating income is not a substitute for income determined in accordance with GAAP, and the
adjustments made to derive adjusted operating income are important to an understanding of our
overall results of operations. Return on equity (“ROE”) based on adjusted operating
income is determined by dividing adjusted operating income after-tax (giving effect to the direct equity
adjustment for earnings per share calculation) by average attributed equity for the Financial Services
Businesses excluding accumulated other comprehensive income. Our expectations of
ROE potential are based on after-tax adjusted operating income. Because we do not predict future realized investment gains / losses or
recorded changes in asset and liability values that are expected to ultimately accrue to
contractholders, we cannot provide a measure of our ROE expectations based on income from
continuing operations of the Financial Services Businesses, which is the GAAP measure most comparable to adjusted operating income.
For additional information about adjusted operating income and the comparable GAAP measure, including
reconciliation between the two, please refer to our Form 8-K filed on April 26, 2012, which
provides supplementary financial information for historical periods reflecting the retrospective adoption of revised U.S. GAAP
accounting standards related to deferred policy acquisition costs, as well as our Forms 10-K and
10-Q, located on the Investor Relations website at
www.investor.prudential.com.
Additional
historical information relating to the Company’s financial performance is also located on the Investor Relations website. |
 RBC
Disclosure 4
Financial Strength Symposium 5.24.2012
This presentation includes references to Risk Based Capital (“RBC”). Prudential manages
its insurance subsidiaries' RBC ratios to a level at or above a "AA" ratings target.
RBC is determined by statutory guidelines and formulas that consider, among other things, risks related to the type and quality of the invested
assets, insurance-related risks associated with an insurer's products and liabilities, interest
rate risks and general business risks. The RBC ratio calculations are intended to assist
insurance regulators in measuring the adequacy of an insurer's statutory capitalization. The RBC calculation is an annual calculation. As of
December 31, 2011, the RBC ratio for The Prudential Insurance Company of America
("PICA") was 491%. This information is provided to you for information purposes
only. It is not intended that this RBC information be used for the purpose of ranking any insurance company or for use in connection with any marketing,
advertising or promotional activities. |
 Prudential’s U.S. Businesses
Charles Lowrey
Charles Lowrey
Executive Vice President and
Executive Vice President and
Chief Operating Officer, U.S.
Chief Operating Officer, U.S. |
 Prudential’s U.S. Businesses
2
U.S. Retirement Solutions and
Investment Management Division
Attributed Equity $12.6 billion
(1)
1)
As of March 31, 2012, excluding total accumulated other comprehensive income.
U.S. Individual Life and
Group Insurance Division
Attributed Equity $3.9 billion
(1)
Prudential
Retirement
Asset
Management
Individual
Annuities
Individual
Life
Group
Insurance
Financial Strength Symposium 5.24.2012 |
 Prudential’s U.S. Businesses
3
U.S. Retirement Solutions and
Investment Management Division
•
Strong growth prospects in U.S.
retirement market
•
Stable value products, wrap
guarantees and pension risk transfer
solutions address retirement
plan needs
•
Robust asset management skills
drive commercial success,
competitive advantage for
Prudential businesses
U.S. Individual Life and
Group Insurance Division
•
Risk diversification; relatively limited
financial market sensitivity
•
Historically solid cash flows and
capital generation
Financial Strength Symposium 5.24.2012 |
 19%
8%
25%
25%
23%
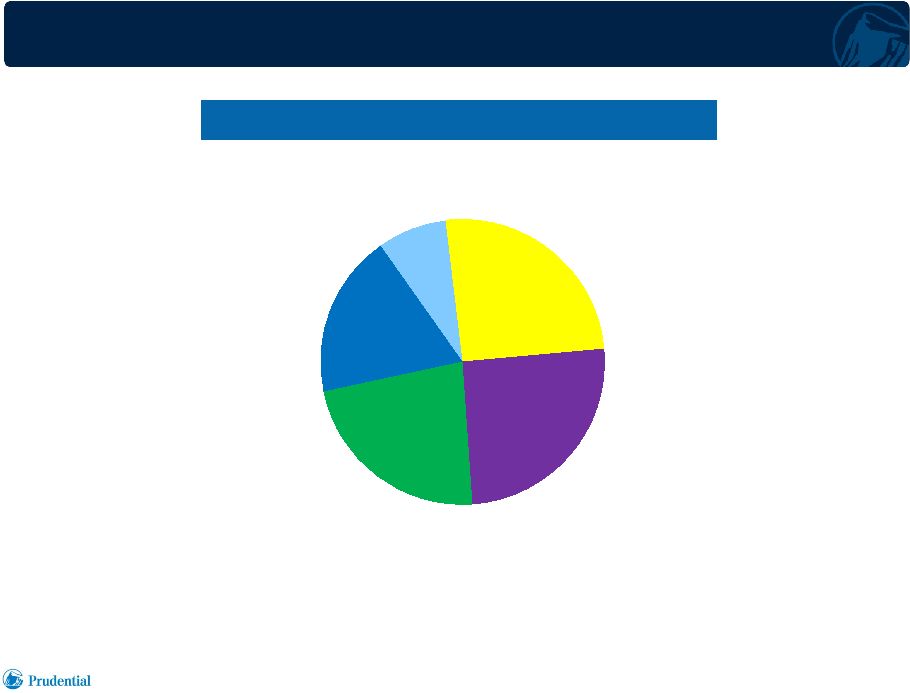
U.S. Businesses
Broad Earnings Diversification by Product and Risk
4
2011 Earnings: $2.6 billion
2011 Earnings: $2.6 billion
(1)
(1)
1)
Pre-tax adjusted operating income for U.S. Retirement Solutions and Investment
Management Division and U.S. Individual Life and Group Insurance Division;
segment results in millions.
Individual
Life
$482
Group
Insurance
$205
Asset
Management
$659
Retirement
$594
Individual
Annuities
$662
Financial Strength Symposium 5.24.2012 |
 5
Market Developments
Market Developments
Prudential Positioning
Prudential Positioning
•
Retirement income security goals
challenged by financial market volatility,
interest rate environment
•
Variable annuity providers enter and exit
market and restructure products, seeking
to adapt to changing landscape
•
Popular
“Highest
Daily”
variable
annuity
products offer retirement income security
supported by product-based risk
management, proven over 5+ year
track record
•
Pension plan sponsors face increasing
financial and regulatory challenges
•
Pension funds seek guarantees and asset
management expertise to support
benefit obligations
•
Ground-breaking defined benefit risk
transfer products offer innovative solutions
to pension plan sponsors based on
decades of Prudential experience
•
Investment Only Stable Value products
combine risk management backstop for
retirement benefit obligations with robust
asset management capabilities
Financial Strength Symposium 5.24.2012
U.S. Businesses: Annuities, Retirement and Asset Management
Positioned for Market Developments – Retirement Market
|
 6
Market Developments
Market Developments
Prudential Positioning
Prudential Positioning
•
Under-insured individuals seek
convenient access for life insurance
protection needs
•
Life insurance products demanded by
consumers require sophisticated risk
and capital management
•
Effective capital, risk and expense
management support competitively
priced term and universal life products
in individual market, offering attractive
value propositions to clients and
appropriate returns to Prudential
•
Economic conditions and rising health
care costs require employers to stretch
employee benefits dollars
•
“Voluntary”
group life products offer cost-
effective protection for employees through
worksite, while conserving employer’s
benefit dollars
Financial Strength Symposium 5.24.2012
U.S. Businesses: Individual Life and Group Insurance
Positioned for Market Developments – Protection Market |
 Prudential Annuities
•
Consistent approach to product design and
demonstrated commitment to advisor-sold market
provide strong competitive advantage
•
Proven, superior value proposition based on
“Highest Daily”
living benefits coupled with auto-
rebalancing tailored to each customer’s account
•
Solid performance of product-based risk
management features over history of 5+ years,
through financial crisis and beyond
•
Popularity and persistency of auto-rebalancing
products drive improving overall risk profile
•
Market leading positions across multiple
distribution channels
7
Financial Strength Symposium 5.24.2012 |
 $84.0
$106.2
$113.5
$0
$20
$40
$60
$80
$100
$120
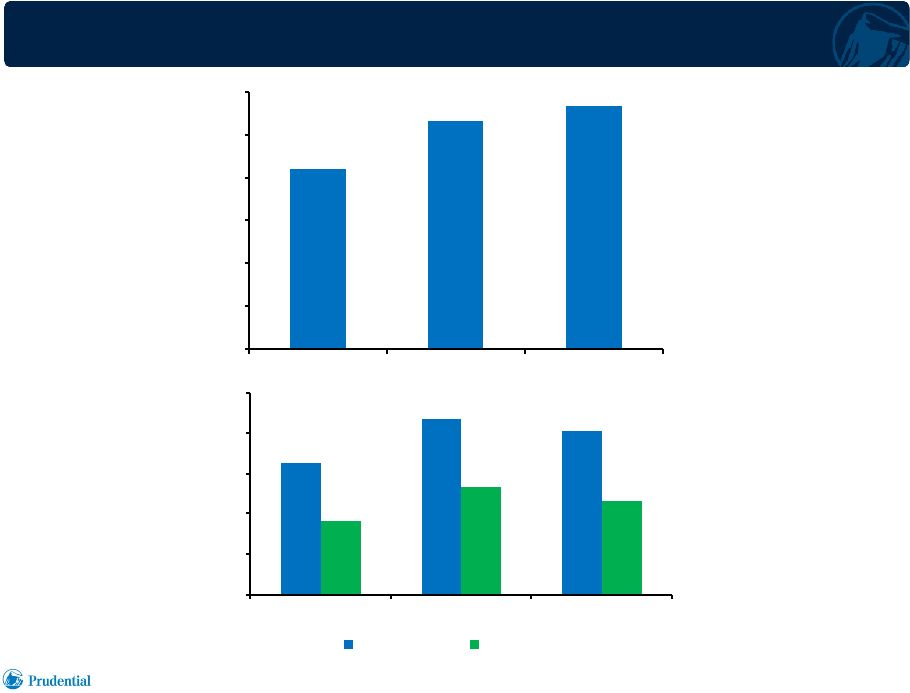
Individual Annuities
Account Values, Sales and Flows
2009
2010
2011
Account Values
(1)
Sales and Flows
($ billions)
($ billions)
1)
As of end of period.
8
$16.3
$21.8
$20.3
$9.1
$13.4
$11.7
$0
$5
$10
$15
$20
$25
2009
2010
2011
Gross Sales
Net Flows
Financial Strength Symposium 5.24.2012 |
 Prudential Retirement
•
Full Service Stable Value products: solid value
proposition for pre-retirees; experience rating limits
risks; low contractual interest rate floors
•
Strong growth in Investment Only Stable Value
risk management/asset management solutions for
pension plan sponsors
•
Emerging Defined Benefit Risk Transfer market
offers attractive opportunities aligned with
Prudential expertise and balance sheet strength
9
Financial Strength Symposium 5.24.2012 |
 $178.3
$205.5
$229.5
$0
$50
$100
$150
$200
$250
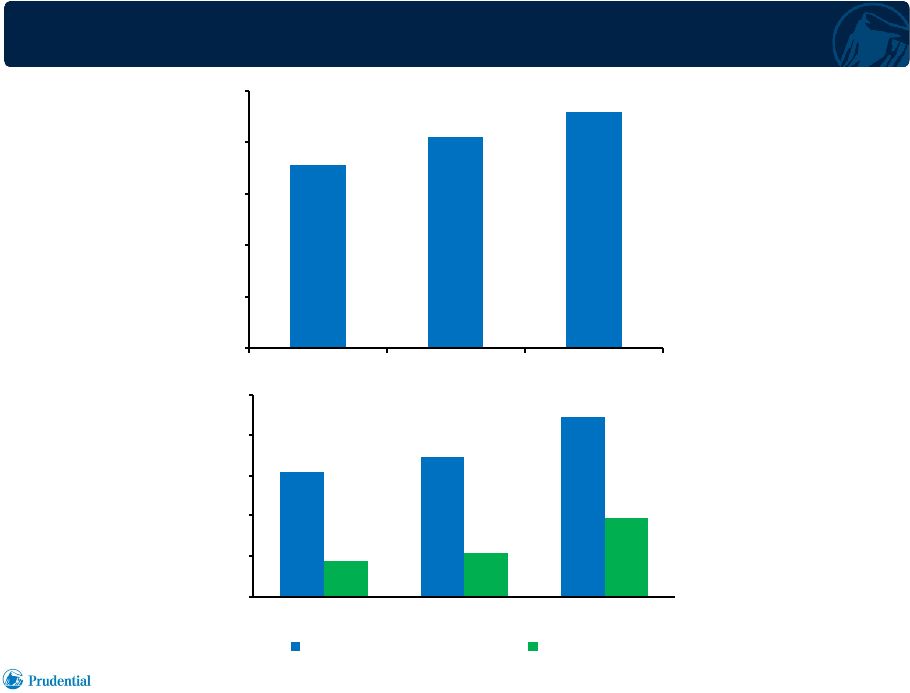
Prudential Retirement
Account Values, Sales and Flows
10
2009
2010
2011
Account Values
(1)
Sales and Flows
($ billions)
($ billions)
1)
As of end of period.
$31.0
$34.6
$44.6
$8.7
$10.8
$19.3
$0
$10
$20
$30
$40
$50
2009
2010
2011
Gross Deposits and Sales
Net Flows
Financial Strength Symposium 5.24.2012 |
 11
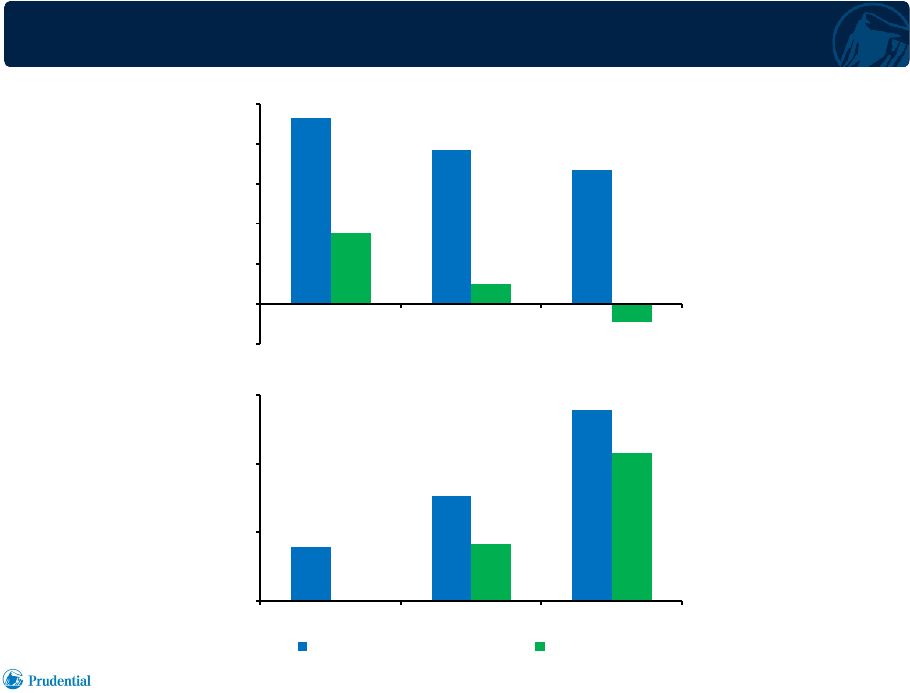
Prudential Retirement
Sales and Flows
Full Service
Institutional
Investment
Products
($ billions)
($ billions)
Financial Strength Symposium 5.24.2012
$23.2
$19.3
$16.8
$8.8
$2.5
-$2.3
-$5
$0
$5
$10
$15
$20
$25
2009
2010
2011
$7.8
$15.3
$27.8
$0.0
$8.3
$21.6
$0
$10
$20
$30
2009
2010
2011
Gross Deposits and Sales
Net Flows |
 Full
Service Stable Value Products •
Principal guarantee feature attractive to pre-retirees
•
Value proposition strengthened by low available interest rates on
alternatives for security-minded clients
•
Low risk profile: substantially all balances experience-rated, with clients
sharing investment risk
•
Rate resets semi-annually or annually on most products
•
Future crediting rates typically reflect prior experience
•
Low interest rate floors: about $31 billion has average of ~125 bps
contractual room to reduce rates, or zero crediting rate floors
1)
As of March 31, 2012.
Account Values: $41 billion
Account Values: $41 billion
(1)
(1)
12
Financial Strength Symposium 5.24.2012 |
 Investment Only Stable Value Products
•
Prudential recordkeeping relationship not required; asset management
mandate required for at least 50% of each account
•
Prudential sets investment guidelines
•
Wrap guarantee of book value based on zero-percent crediting rate floor
•
Liquidity buffers help manage exposure to asset liquidations driven by
participant level withdrawals
•
Plan level withdrawals at market value, or at book value over 3-9
year period
•
Re-pricing generally permitted at one-year intervals without
limitations •
Attractive returns
1)
As of March 31, 2012.
Account Values: $45 billion
Account Values: $45 billion
(1)
(1)
13
Financial Strength Symposium 5.24.2012 |
 Defined Benefit Risk Transfer
An Emerging Opportunity
•
Large potential market: $2.2 trillion private sector defined benefit plan
assets
(1)
; few companies equipped to offer solutions
•
Actuarially-driven long-term risks; relatively limited exposure to
financial markets volatility
•
Products draw on Prudential skill sets with successful track record of
more than 80 years in managing pension risks
•
Strong track record in defined benefit risk transfer
•
Longevity risk is a natural hedge to life insurance mortality risk
14
1)
As of December 31, 2010; Source: Investment Company Institute.
Financial Strength Symposium 5.24.2012 |
 Prudential Retirement
Flexible, Innovative Risk Transfer Strategies
15
2011 Gross Sales
Over $2 billion,
including U.S. market’s
first pension plan
“Buy-In”
and several
longevity reinsurance
transactions
Traditional Pension Plan “Buy-Out”
Plan sponsor completely transfers pension
plan risk to Prudential through general
account products
Portfolio Protected “Buy-In”
Plan holds specially designed Prudential
annuity as asset, transferring risk without
triggering settlement
Portfolio Protected “Buy-Out”
Combines strength of Prudential guarantee with
insulated separate account portfolio
Longevity Reinsurance
Prudential assumes risk of greater than
expected longevity, allowing plan sponsor
contribution certainty
Financial Strength Symposium 5.24.2012 |
 Asset
Management •
Leading third party asset manager
•
Robust institutional and retail businesses attract and retain talented
investment professionals
•
Growing base of AUM driven revenues
•
Limited capital requirements; sustainable high ROE
•
Competitive
advantage
for
Prudential
businesses;
seasoned
skills
in
multiple asset classes support attractive general account investments
and funds managed for clients
16
Financial Strength Symposium 5.24.2012 |
 Prudential Asset Management
Competitive Advantages
17
Experience and
Track Record
1)
As of March 31, 2012; AUM excludes affiliated institutional and retail assets under
management. 2)
As of December 31, 2011.
Breadth and Depth
of Capabilities
Access to Capital
and Co-investing
Brand and
Reputation
Scale
Third Party Clients
$320 billion
third party AUM
(1)
12% AUM CAGR
(2006 –
2011)
Manager Continuity
(2)
219 portfolio
managers
Average tenure
14 years
Financial Strength Symposium 5.24.2012 |
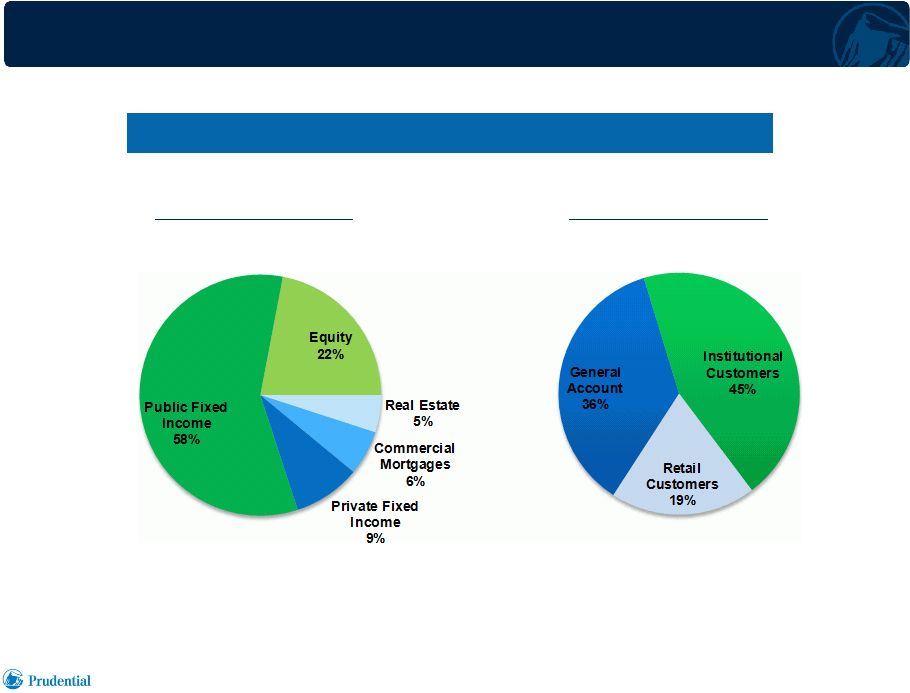 Asset
Management An Integral Business
18
AUM by Asset Type
AUM by Client Type
1)
As of March 31, 2012.
Total
AUM
$637
billion
(1)
Financial Strength Symposium 5.24.2012 |
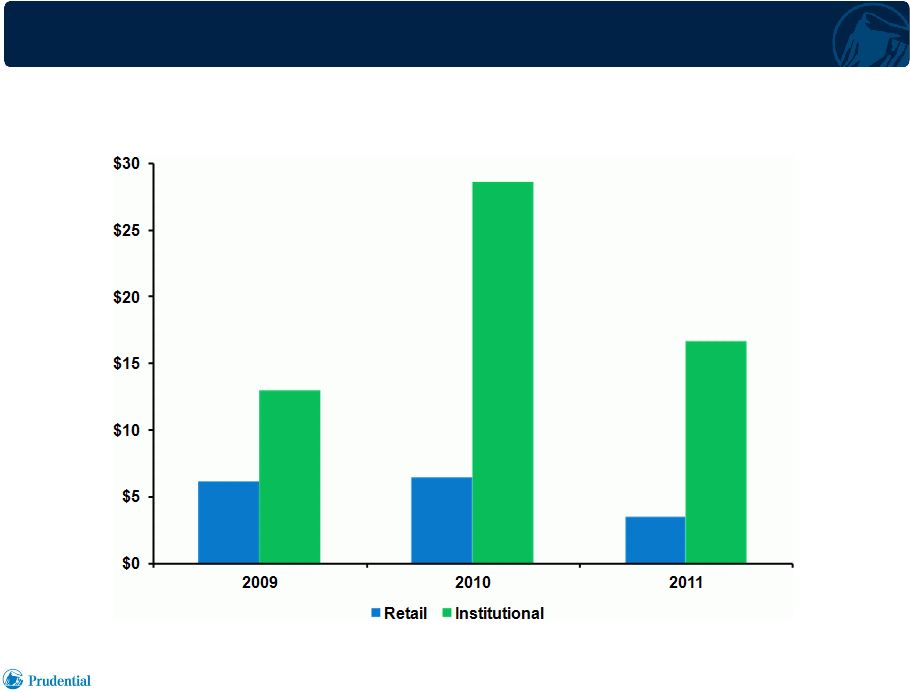 Strong Asset Management Net Flows
(1)
19
1)
Third party, excluding money market activity.
($ billions)
Financial Strength Symposium 5.24.2012 |
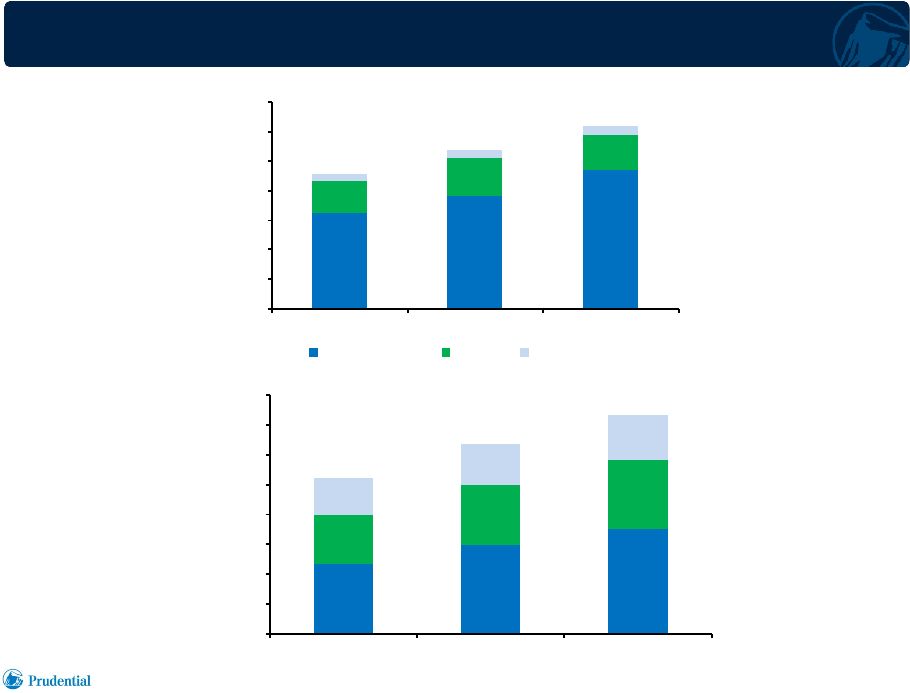 $0
$100
$200
$300
$400
$500
$600
$700
2009
2010
2011
Fixed Income
Equity
Real Estate
$0
$200
$400
$600
$800
$1,000
$1,200
$1,400
$1,600
2009
2010
2011
AUM Growth Driving Asset Management Fees
20
1)
As of end of period.
($ billions)
($ millions)
$1,049
$1,273
$1,467
$457
$537
$619
Assets
Under
Management
by Asset Class
(1)
Asset
Management
Fees
by Asset Class
Financial Strength Symposium 5.24.2012 |
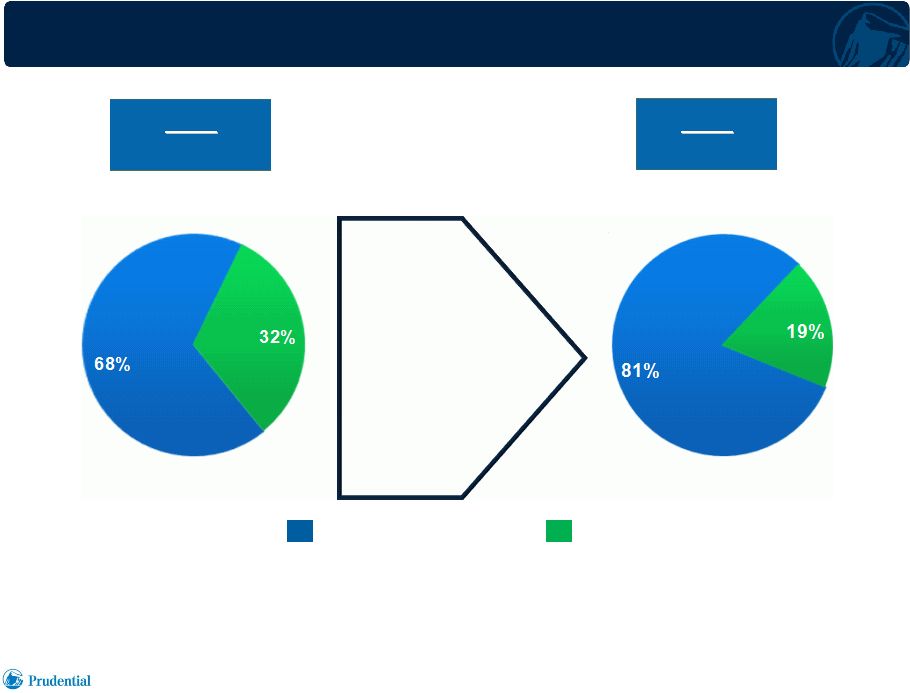 Building Sustainable Asset Management Revenues
(1)
21
•
Growth in
asset
management
fees
•
Reduced strategic
investing exposure
•
Exited commercial
mortgage
securitization
conduit
Asset Management Fees
ITSICM
2007
2007
$1.6 billion
$1.6 billion
(2)
(2)
2011
2011
$1.8 billion
$1.8 billion
1)
Asset management fees and incentive, transaction, strategic investing and
commercial mortgage (ITSICM) revenues. 2)
As originally reported.
Financial Strength Symposium 5.24.2012 |
 Group
Insurance •
Emphasis on group life insurance: approximately 75% of business
in force
(1)
•
Experience-rated larger-case business: pricing reflects experience
over time
•
Relatively short pricing cycle for smaller cases not subject to
retrospective experience rating
•
Focus on appropriate returns; actively repricing group disability products
•
“Voluntary”
business offers opportunity for low cost workplace delivery
of life insurance protection products
•
Manage business for stable earnings and strong cash flows
22
Financial Strength Symposium 5.24.2012
1)
Based on earned premiums, policy charges and fee income for year ended December 31, 2011. |
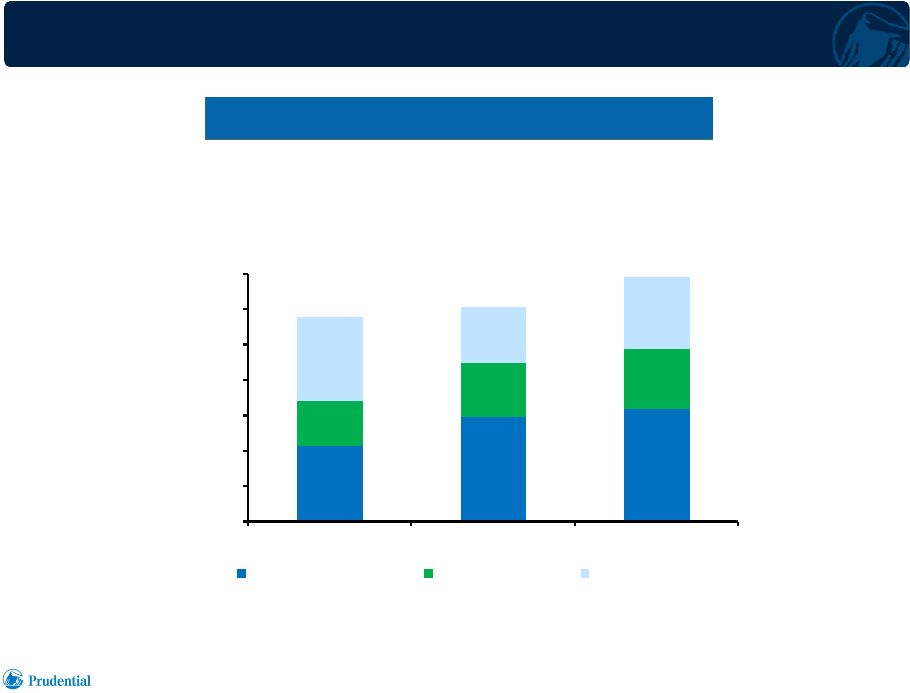 $0
$100
$200
$300
$400
$500
$600
$700
2009
2010
2011
Voluntary Group Life
Basic Group Life
Group Disability
Group Insurance
23
($ millions)
Annualized New Business Premiums
Annualized New Business Premiums
$577
$607
$690
Financial Strength Symposium 5.24.2012 |
 Individual Life
•
Focus on returns through capital management, cost effective distribution
•
Complementary products and distribution channels
•
Quality business: pricing and underwriting discipline
•
Product mix limits overall interest rate and equity market sensitivity
•
Historically solid cash flows, capital generation and ROE
24
Financial Strength Symposium 5.24.2012 |
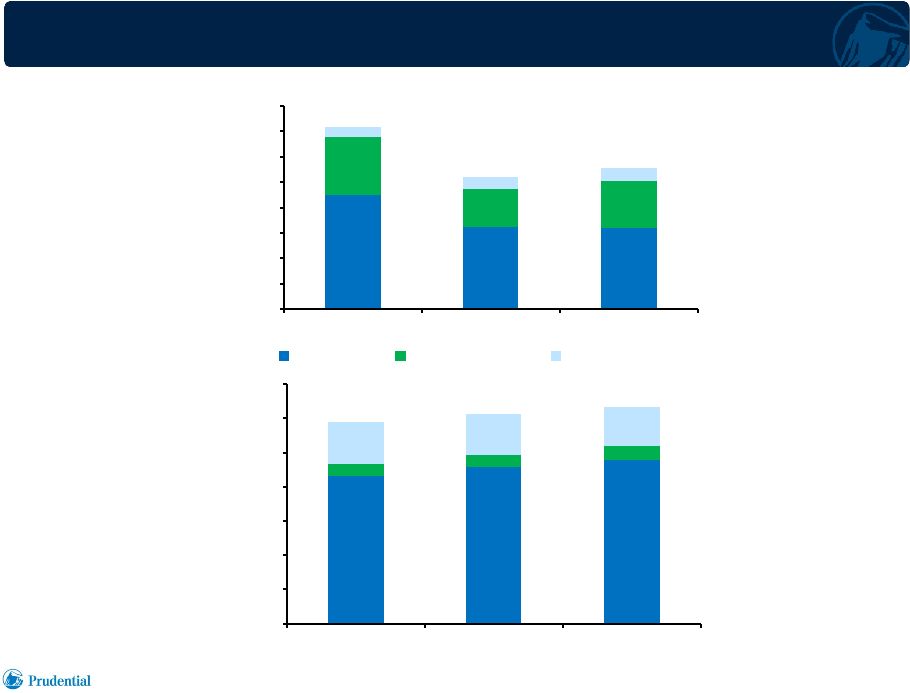 $0
$100
$200
$300
$400
$500
$600
$700
2009
2010
2011
$0
$50
$100
$150
$200
$250
$300
$350
$400
2009
2010
2011
Term Life
Universal Life
Variable Life
Individual Life
Building Quality Business
25
($ millions)
($ billions)
Annualized
New Business
Premiums
(1)
Face Amount
In Force
(2)
1)
Excludes corporate-owned life insurance.
2)
As of end of period; before reinsurance ceded.
$359
$260
$278
$589
$613
$631
Financial Strength Symposium 5.24.2012 |
 Key
Takeaways •
Strong growth prospects in U.S. retirement market
•
Popular “Highest Daily”
variable annuity products offer superior value
proposition supported by proven product-based risk management
•
Investment Only Stable Value products offer compelling risk management /
asset management solutions for pension plan sponsors
•
Emerging Defined Benefit Risk Transfer market offers attractive
opportunities aligned with Prudential expertise and balance sheet strength
•
Robust asset management skills drive commercial success, competitive
advantage for Prudential businesses
•
Individual Life and Group Insurance protection businesses provide risk
diversification, historically solid cash flows and capital generation; focusing
on appropriate returns
26
Financial Strength Symposium 5.24.2012 |
 Prudential Annuities
Robert O’Donnell
President
Prudential Annuities
1 |
 Strong Position in an Attractive Market
•
Superior value proposition for retirement
income security
•
Consistency of approach, demonstrated
commitment to market, brand and reputation
are competitive advantages
•
Risk management by design: contract level
auto-rebalancing proven over track record of
more than five years
•
Favorable demographics offer continuing
growth opportunity
•
Growing base of business with favorable return
prospects, improving risk profile
Financial Strength Symposium 5.24.2012
2 |
 Market Developments –
Client Perspective
Today’s Variable Annuity Market
Today’s Variable Annuity Market
Prudential Positioning
Prudential Positioning
•
Reduced availability of defined benefit
retirement plans and increasing retirement
lifespans strengthen client demand for
income clients can’t outlive
•
Financial crisis experience, volatile
markets, and alarming headlines drive
heightened client perception of risks in
retirement investing
•
Available yields on “safe”
investments at
historical low, rendering conservative
retirement savings strategies inadequate
to support income replacement needs
in retirement
•
Highest Daily living benefit features help
increase retirement income base, protect
it from market downturns, and guarantee
retirement income to last a lifetime
•
Prudential’s product-based risk
management allows client access to
market growth opportunities with
downside protection peace of mind
•
Rigorous investment oversight supported
by extensive experience comes with
every Prudential variable annuity
Financial Strength Symposium 5.24.2012
3 |
 Market Developments –
Distributor Perspective
Today’s Variable Annuity Market
Today’s Variable Annuity Market
Prudential Positioning
Prudential Positioning
•
Market entries, exits and re-entries by
variable annuity writers create challenges
for distributors and raise questions on
market commitment
•
Changing key product features require
substantial training efforts and adaptation
of sales story by financial advisors
•
Recent approaches for risk sharing with
clients untested through market cycles
•
Recent market risk management
approaches require highly restricted fund
selections, limiting advisors’
latitude in
recommending investment choices
•
Prudential’s Highest Daily product suite
forms basis of consistent approach to
advisor-sold variable annuity market
since 2006
•
Product-based risk management with
auto-rebalancing tailored to each client’s
account, proven over track record of
more than five years through financial
crisis and beyond
•
Contract-level auto rebalancing allows
Prudential to offer a wide range of
investment choices within asset
allocation programs
Financial Strength Symposium 5.24.2012
4 |
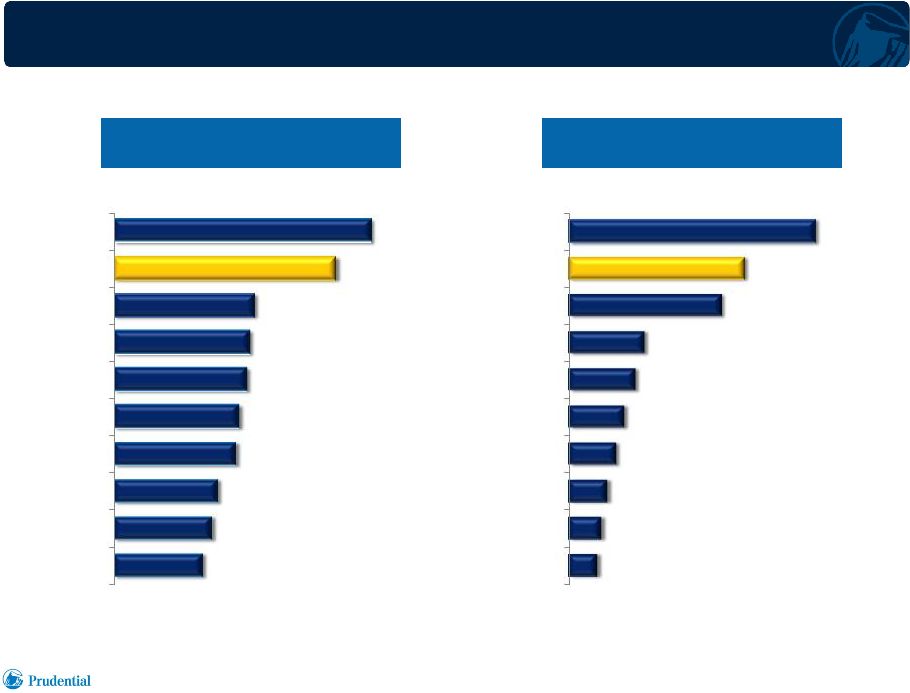 Financial Strength Symposium 5.24.2012
FY 2011 Variable Annuity
Assets Under Management
($ millions)
FY 2011 Advisor-Sold
Variable Annuity Sales
1)
Source: VARDS Q4’11. Advisor-sold, excludes group/retirement plan
contracts. Assets under management as of year end. Prudential Annuities
2011 Asset and Sales Rankings
5
$43,362
$48,123
$50,861
$59,902
$61,484
$65,217
$66,471
$68,725
$108,936
$126,164
Nationwide
Pacific Life
John
Hancock
AXA
Ameriprise
Jackson
Lincoln
Hartford
Prudential
MetLife
$3,318
$3,792
$4,478
$5,407
$6,395
$7,636
$8,692
$17,494
$20,236
$28,262
Pacific Life
Allianz
AXA
AEGON
Ameriprise
Nationwide
Lincoln
Jackson
Prudential
MetLife
1
1 |
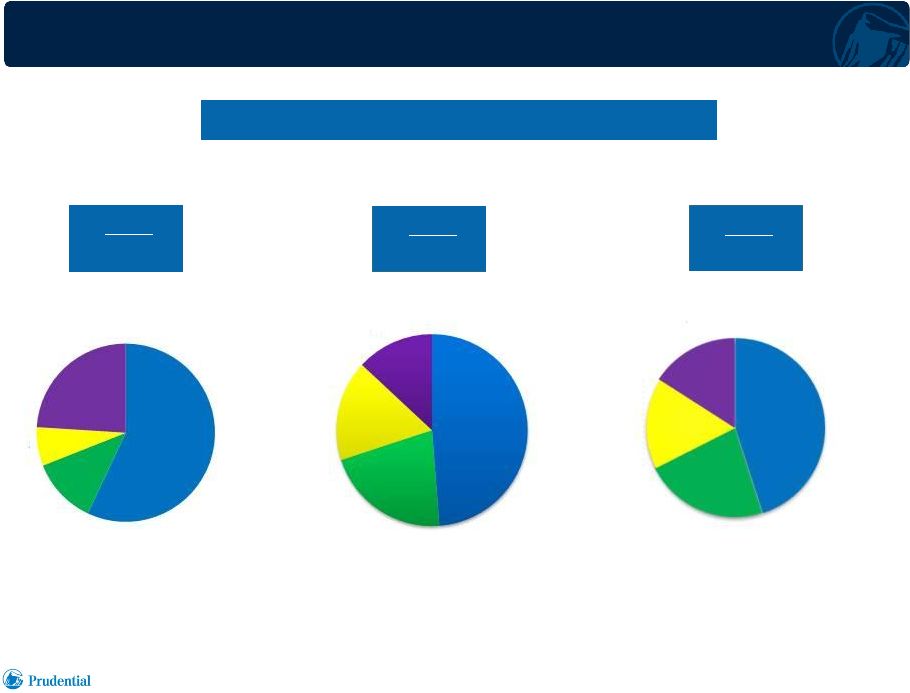 Building Multi-Channel Distribution Strength
Financial Strength Symposium 5.24.2012
6
Prudential Individual Annuity Gross Sales
(1)
1)
In millions; includes variable and fixed annuities.
2008
$10,329
2011
$20,293
2010
$21,754
Independent
45%
Wirehouse
22%
Bank
17%
Insurance
Agents
16%
Independent
49%
Wirehouse
21%
Bank
17%
Insurance
Agents
13%
Independent
57%
Wirehouse
12%
Bank
7%
Insurance
Agents
24% |
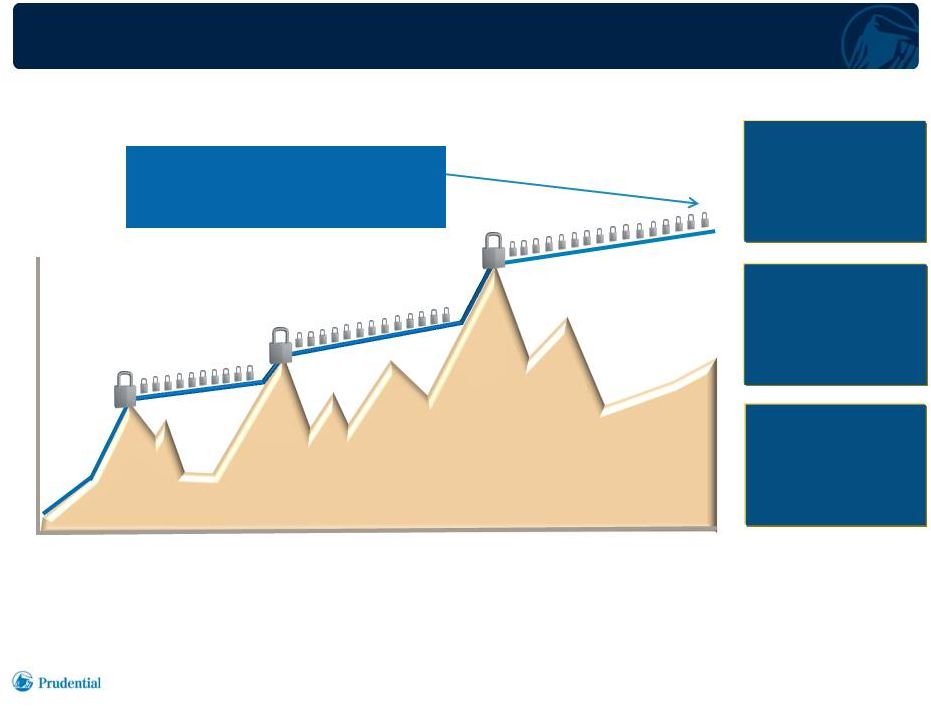 Differentiated Value Proposition
The
Highest
Daily
Lock-In
–
Protected
Value
Financial Strength Symposium 5.24.2012
Hypothetical for illustrative purposes only.
5
7
Hypothetical for illustrative purposes only.
Protected Withdrawal Value –
notional amount for calculation
of lifetime annual withdrawals
Account Value
What are the chances
of an annual lock-in
capturing the
best day?
1%
What are the chances
of a daily lock-in
capturing the
best day?
100%
What are the chances
of a quarterly lock-in
capturing the
best day?
4%
This is a hypothetical example for illustrative purposes only. It does not reflect
a specific annuity or the performance of any investment. The account value
has no guarantees, may fluctuate, can lose value, and is separate from the Protected Withdrawal
Value.
Source:
Standard
&
Poor’s,
Barclays
Capital.
For
the
period
from
January
3,
1989
through
March
31,
2011.
Represents the percentage of rolling ten-year periods where each step-up
frequency captured the highest market point in that ten-year period
(2,286 periods total). Assumes an 80% allocation to U.S. equities and 20% allocation to
U.S. bonds. All figures are rounded to the nearest percentage. Past performance is
not a guarantee of future results. |
 Differentiated Value Proposition
Contract Level Auto-Rebalancing
Recent Market Approaches
Recent Market Approaches
for Client Risk Sharing
for Client Risk Sharing
Prudential Auto-Rebalancing
Prudential Auto-Rebalancing
•
Fund-based approaches typically limit
investment choices to designated funds
•
Broad client group may be affected by
general fund level reallocations under
approaches not tailored to individual
contracts
•
New clients may encounter funds highly
weighted to fixed income due to earlier
market downturns
•
Most product-based risk management
strategies are recently introduced
•
Powerful algorithm mitigates risk by
protecting client account values in
market downturns
•
Algorithm specified in contract, providing
transparency for clients
•
Contract level approach tailored to each
client’s account value and guarantee
profile allows Prudential to offer a wide
range of investment choices
•
Proven track record of protecting
account values and returning funds to
client-selected investments when
appropriate, allowing participation
in market growth
Financial Strength Symposium 5.24.2012
8 |
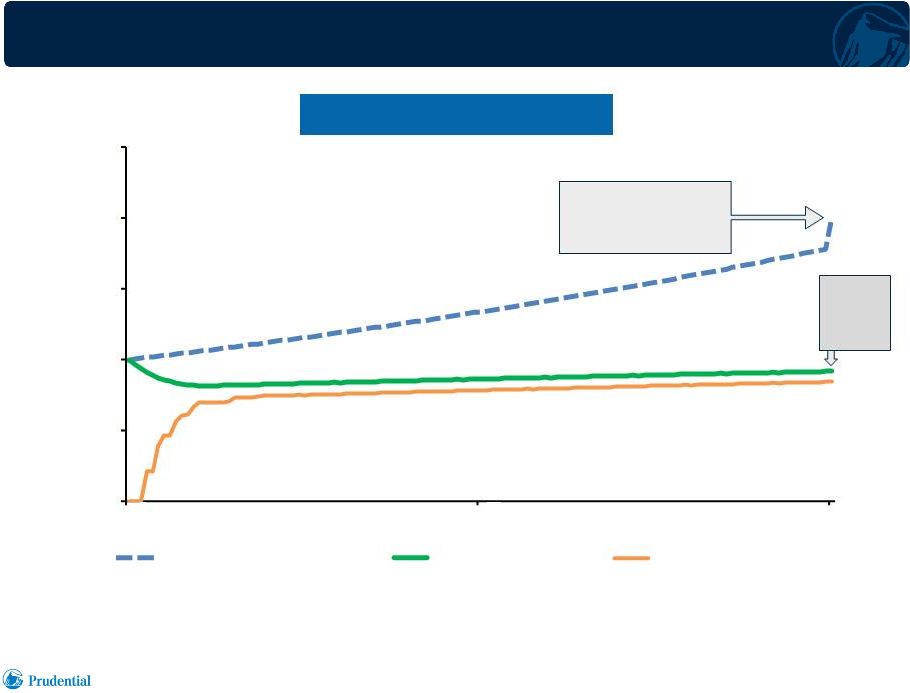 Account Value and
“Protected Withdrawal Value”
Financial Strength Symposium 5.24.2012
“PWV”: notional amount
for calculation of
lifetime annual withdrawals
Year
0
6
12
Account
value
available to
customer
Market Downturn Scenario
(1)
(“PWV”)
9
0
60
Protected Withdrawal Value
Total Account Value
Bond Fund Value
$0
$50,000
$100,000
$150,000
$200,000
$250,000
1)
Highest Daily Lifetime Income (HDI) – sub-accounts suffer 30% decline in year 1, followed by
0% sub-account return thereafter; bond fund assumed annual return of 3%. No withdrawals
through end of year 12. All quoted returns are net of fund management and base policy fees. The fee for HDI
was explicitly deducted from the account value on a quarterly basis. |
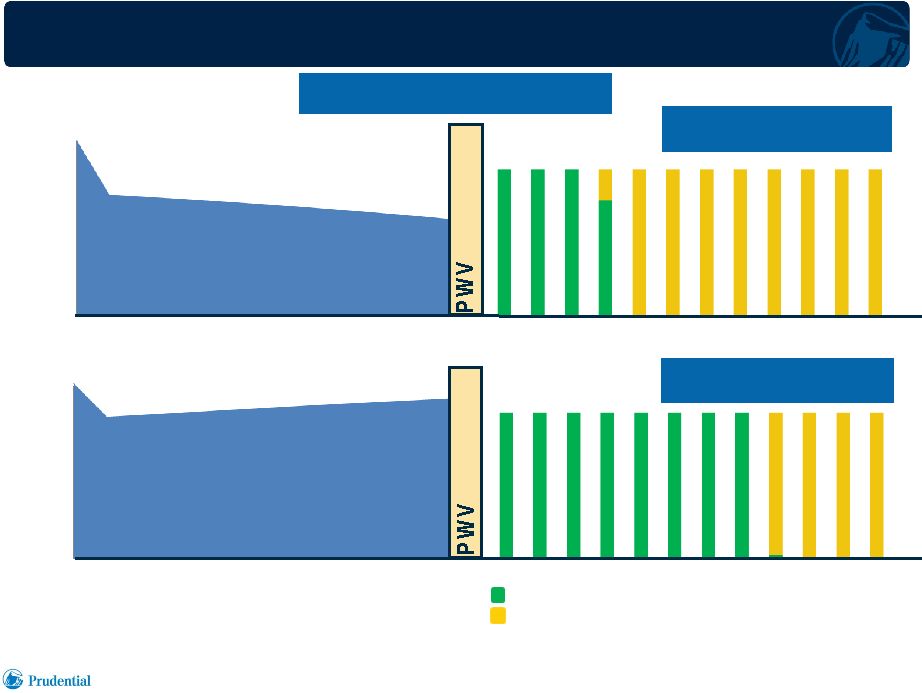 Auto-Rebalancing
Preserving Account Values to Fund Retirement Income
Financial Strength Symposium 5.24.2012
10
Market Downturn Scenario
Market Downturn Scenario
(1)
(1)
= Payments Funded by Customer Account Value
= Payments Funded by Prudential guarantee
81
AGE
82+
80
79
78
72
60
$100,000
77
76
75
74
73
Account Value
AGE
60
$100,000
81
82+
80
79
78
72
77
76
75
74
73
Income
Without Auto-Rebalancing
Income
With Auto-Rebalancing
Account Value
1)
Highest Daily Lifetime Income (HDI) – sub-accounts suffer 30% decline in year 1, followed by
0% sub-account return thereafter; bond fund assumed annual return of 3%. No withdrawals
through end of year 12. All quoted returns are net of fund management and base policy fees. The fee for HDI was explicitly
deducted from the account value on a quarterly basis. |
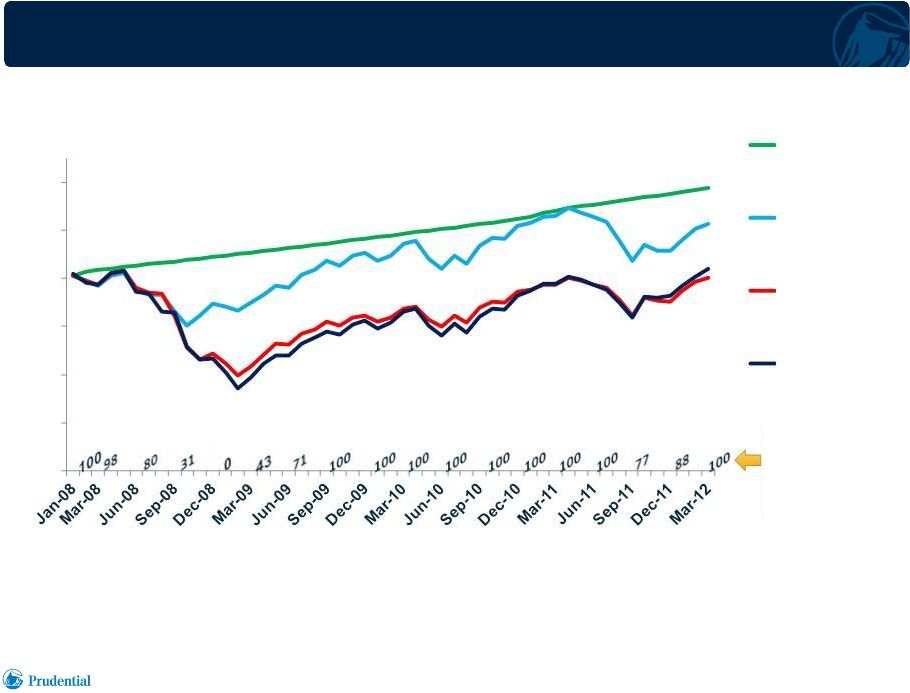 Financial Strength Symposium 5.24.2012
11
This illustration analysis for HD Lifetime Seven assumes a $500,000 initial
investment into the AST Capital Growth Portfolio & AST Investment Grade
Bond Portfolio and election on February 23, 2009 of the 90% limit on bond fund
allocation. 1)
Assumes investment of funds in S&P 500 index on launch date of HD Lifetime
Seven, January 28, 2008. (1)
Account Value
w/o Auto-
Rebalancing 0%
$100,000
$200,000
$300,000
$400,000
$500,000
$600,000
$700,000
Protected
Withdrawal Value
+38%
HD7 Account
Value +23%
S&P 500 +4%
Account Value
% of HD
Account Value
Invested in
Customer-
Selected Funds
Auto-Rebalancing
Proven Through Financial Market Crisis… and Beyond |
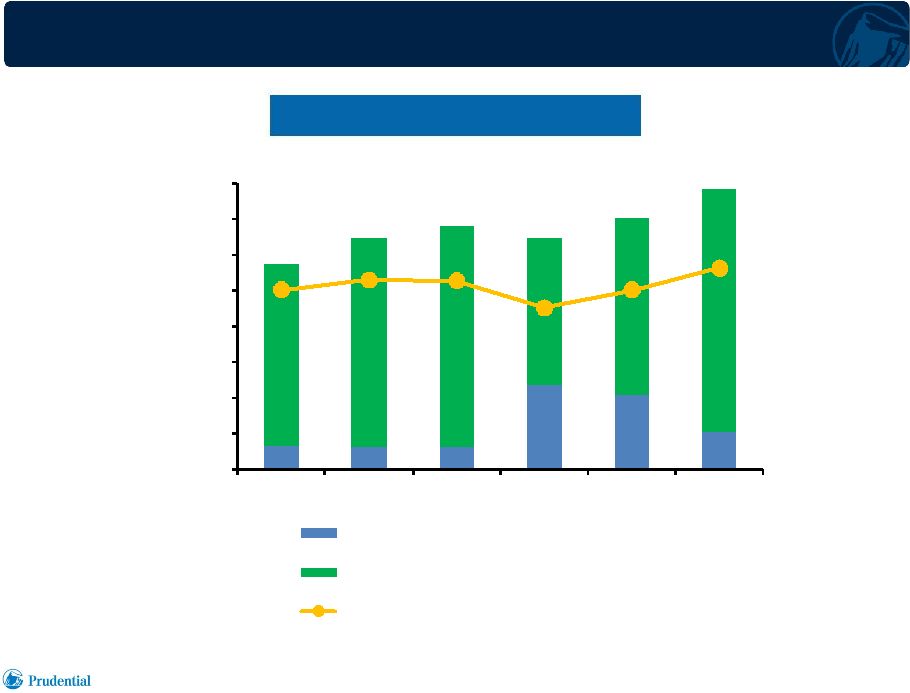 1,258
1,326
1,321
1,131
1,258
1,408
$0
$10,000
$20,000
$30,000
$40,000
$50,000
$60,000
$70,000
$80,000
4Q10
1Q11
2Q11
3Q11
4Q11
1Q12
Auto-Rebalancing Fixed Income Investments
Client-Selected Investments
S&P 500
Financial Strength Symposium 5.24.2012
12
Accounts with Auto-Rebalancing
(1)
$57,336
$64,786
$68,273
$64,769
$70,341
$78,622
($ millions)
1)
As of end of period.
Auto-Rebalancing
Protecting from Market Downturns – Returning Funds for Growth |
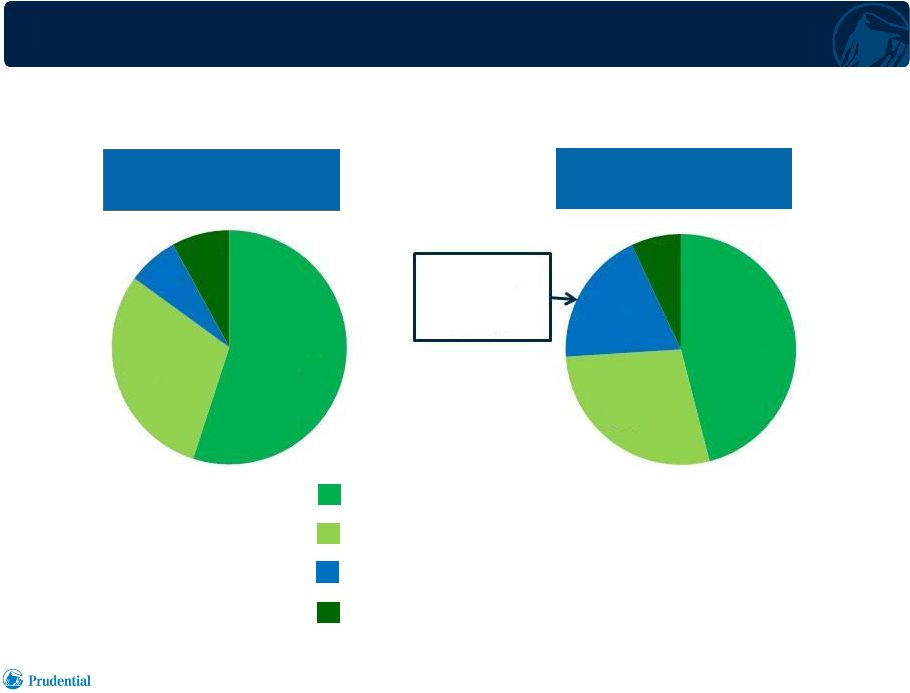 Variable Annuity Account Values
Balanced Market Exposure Mitigates Risk
Financial Strength Symposium 5.24.2012
13
December 31, 2010
December 31, 2010
$102 billion
$102 billion
December 31, 2011
December 31, 2011
$110 billion
$110 billion
Equity Funds –
Client selected
Bond
Funds
and
Fixed
Income
Investments
–
Client selected
Auto-rebalancing Fixed Income Investments
Other –
Client selected
55%
30%
7%
8%
Average
Duration
approximately
6 years
46%
28%
19%
7% |
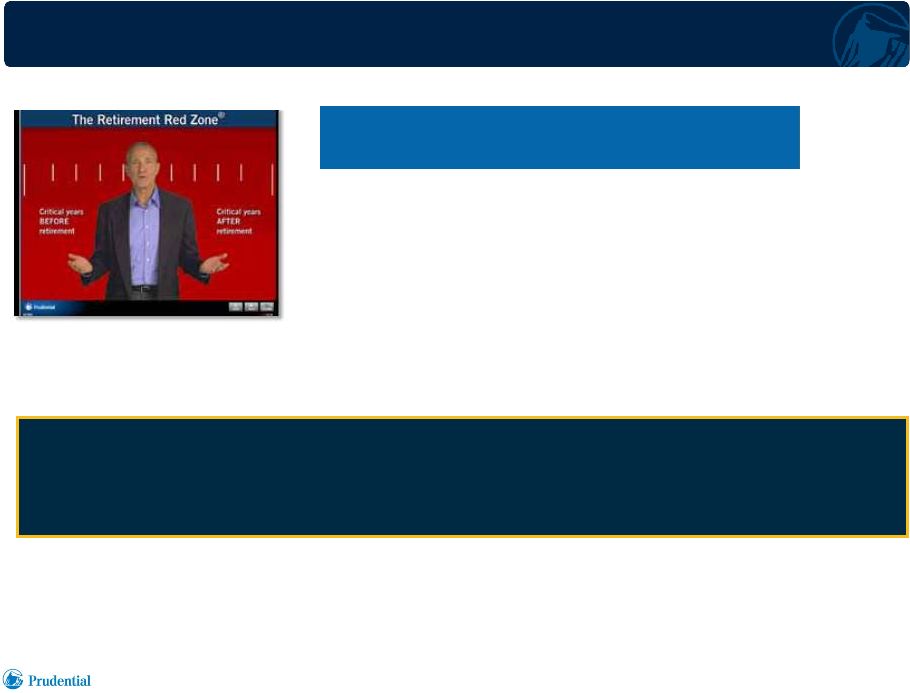 Retirement Income Security
A Continuing Market Opportunity
Financial Strength Symposium 5.24.2012
14
Profile of a Typical Prudential
Profile of a Typical Prudential
“HD”
“HD”
Variable Annuity Purchaser
Variable Annuity Purchaser
(1)
(1)
•
Average age at purchase: 60
•
Average ticket size: $102,000
•
Median
net
worth
(excluding
primary
residence):
$350,000
(2)
•
Objective: lifetime retirement income
•
77 million baby boomers born 1946
–
1964
(3)
•
Over 12,500 Americans turn 50 every day
(3)
•
Adults
50
and
older
own
65%
of
the
aggregate
net
worth
of
all
U.S.
households
(3)
)
1)
For the three months ended March 31, 2012.
2)
Source: LIMRA, May 2012.
3)
Source: U.S. census; U.S. consumer expenditure survey.
|
 Innovation Culture
Captures Market Opportunities
•
Partnered with Edward Jones to create the O Share variable annuity
•
O share evolves the A share business model and complements our HD
living benefit
(1)
•
Levelized recovery of policy acquisition costs results in less market sensitive
fee base
•
First to bring this product design to market in May 2011 and have since seen
broad adoption within the Edward Jones distribution network
Financial Strength Symposium 5.24.2012
15
1)
An A Share class variable annuity carries a front end charge whereas an O Share
class variable annuity has an annual premium-based charge. O
NGOING EVALUATION OF OPPORTUNITIES TO
EXPAND RETIREMENT INCOME SECURITY
|
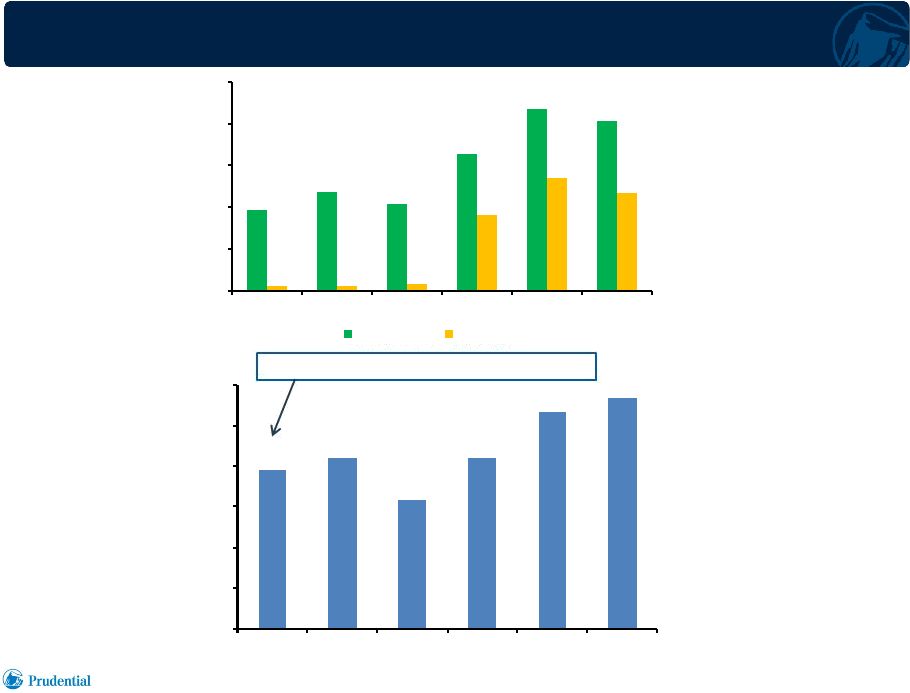 $78.3
$83.8
$63.3
$84.0
$106.2
$113.5
$0
$20
$40
$60
$80
$100
$120
2006
2007
2008
2009
2010
2011
$9.7
$11.8
$10.3
$16.3
$21.8
$20.3
$0.6
$0.6
$0.8
$9.1
$13.4
$11.7
$0
$5
$10
$15
$20
$25
2006
2007
2008
2009
2010
2011
Gross Sales
Net Flows
Value Proposition, Distribution Strength and
Market Commitment Drive Sales and Flows
Financial Strength Symposium 5.24.2012
16
($ billions)
Account Values
(1)
1)
As of end of period.
($ billions)
Sales and Flows
HD Lifetime Products introduced November 2006 |
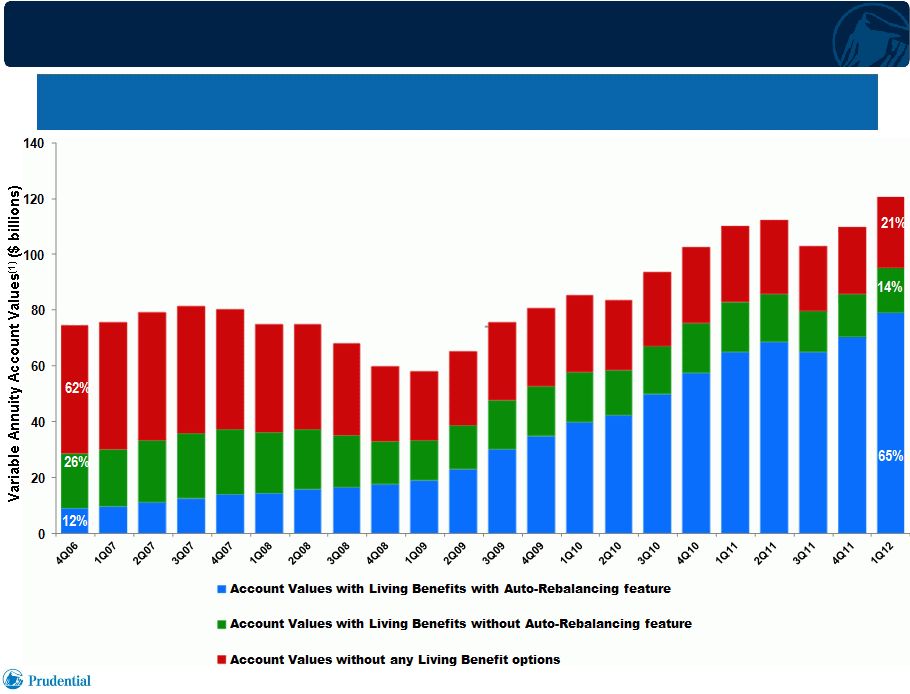 Improving Risk Profile
Financial Strength Symposium 5.24.2012
17
14
1)
As of end of period.
The accelerated growth in our overall block has increased the percentage of account
values with auto-rebalancing, which will continue to improve the level
and volatility of returns. |
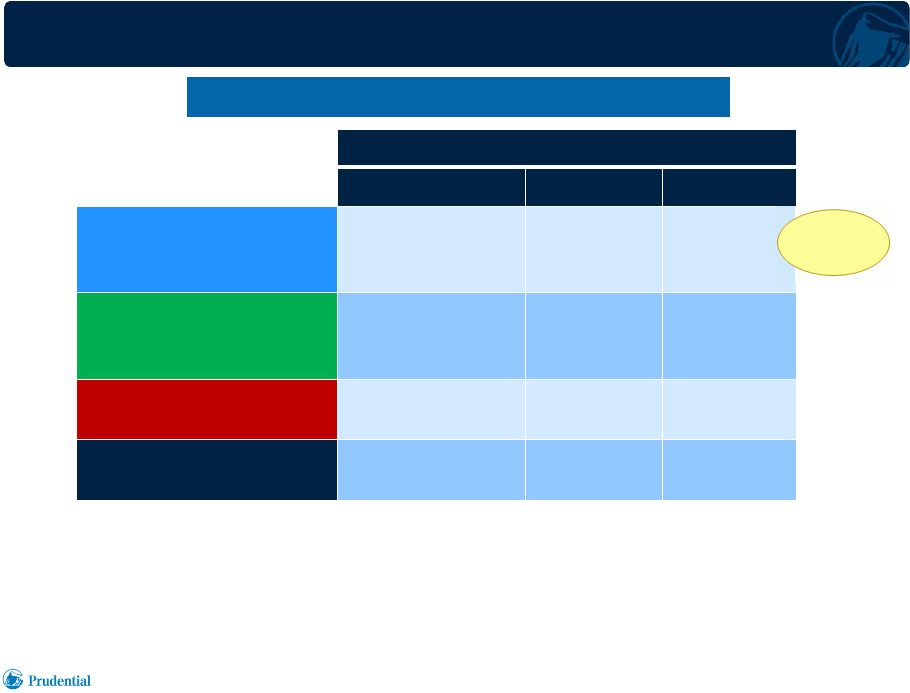 Well
Positioned to Retain Auto-Rebalancing Business In-Force
Financial Strength Symposium 5.24.2012
Surrender Charge
Surrender Charge
Less Than 1%
Less Than 1%
1% to 3%
1% to 3%
Over 3%
Over 3%
Living Benefits With
Auto-Rebalancing
$71 B
8%
2%
90%
Living Benefits Without
Auto-Rebalancing
$15 B
47%
9%
44%
No Living Benefits
$24 B
70%
8%
22%
Total
$110 B
27%
4%
69%
Surrender Charges Applicable to Account Values
Surrender Charges Applicable to Account Values
(1)
(1)
1)
For Variable Annuities; surrender charges as percentage of variable annuity account
values; as of December 31, 2011. 18
Average
surrender
charge
6.9% |
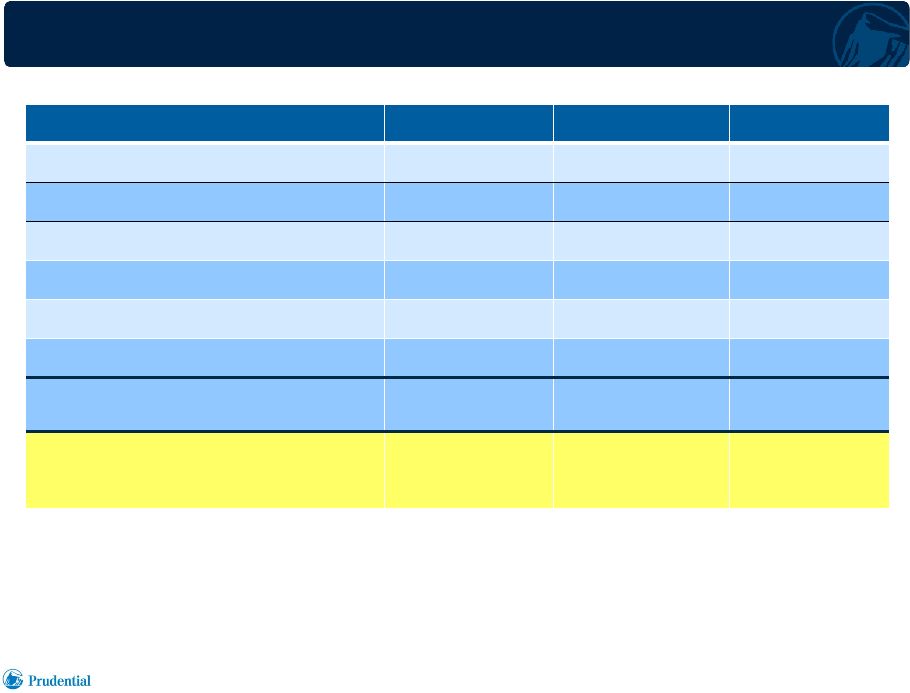 Growing Base of Profitable Business
Drives Underlying Earnings Growth
Individual Annuities
2009
2010
2011
End of period account values
$83,971
$106,185
$113,535
Pre-tax adjusted operating income
$672
$950
$662
Market performance unlocking
(1)
319
101
(280)
Assumption unlocking
(1)
(48)
167
24
Actual experience true-up
(1)
88
68
34
Reinsurance reserve adjustment
(2)
0
25
0
Pre-tax AOI, excluding disclosed
items indicated above
$313
$589
$884
“ROA”: Pretax AOI, excluding disclosed
items indicated above, as percentage of
average account values
0.44%
0.63%
0.79%
Financial Strength Symposium 5.24.2012
1)
Includes benefits (charges) from change in amortization of DAC and related items
and GMDB / GMIB reserve provisions due to market performance, actual-to-
expected result differences, and changes in assumptions used to project gross
profits and claims. 2)
Based on review and settlement of reinsurance contracts related to acquired
business. 19 |
 Key
Takeaways •
Market leadership driven by superior value proposition
•
Consistent approach and market commitment drive competitive
advantage in distribution
•
Product-based risk management based on auto-rebalancing
proven over track record of more than five years
•
Growing base of business with favorable return prospects and
improving risk profile
•
Commitment to sustainable, profitable growth
20
Financial Strength Symposium 5.24.2012 |
 Prudential International Insurance
Edward Baird
Executive Vice President and
Chief Operating Officer, International |
 2
Our Historical Strategy and
Business Model…
…Is the Foundation For Our
Evolving Strategy
•
Concentrate on a limited number of
attractive countries
•
Target the affluent and mass-
affluent consumer
•
Needs-based selling
•
Proprietary distribution based on
selective recruiting, professional
training, performance-based
variable compensation
•
Historical focus on death
protection insurance
•
Concentrate on a limited number of
attractive countries
•
Expand the breadth and depth of our
capabilities in those countries
-
Target middle to mass-affluent
consumer and small/medium
business market
-
Diversify distribution and products to
meet additional customer needs
•
Maintain our proven discipline,
quality, and execution in all markets,
channels, products, and customer
relationships
The Evolution of our International Strategy
Financial Strength Symposium 5.24.2012 |
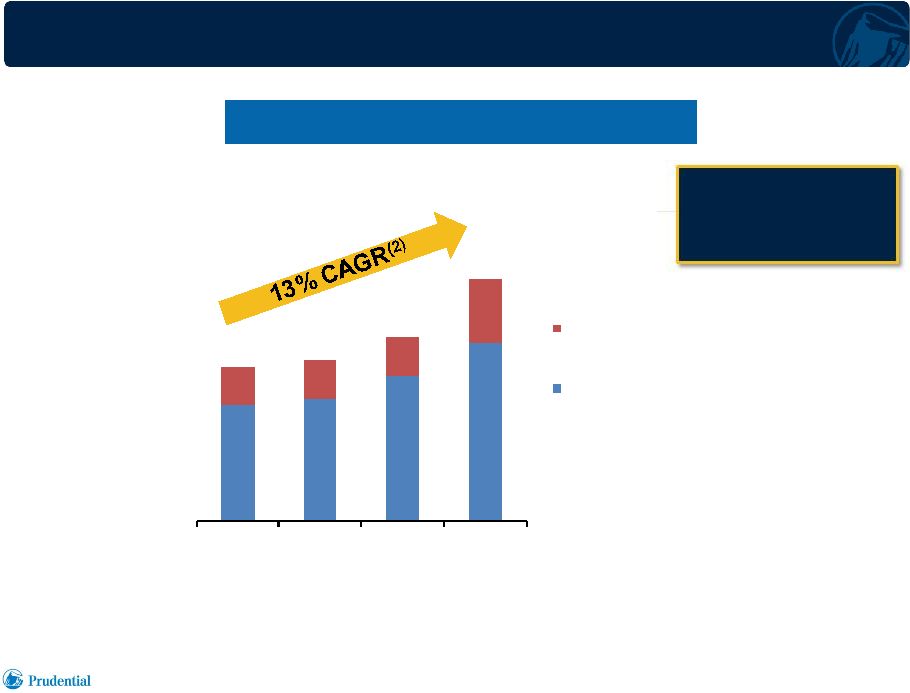 3
Investment Margin
Mortality Margin
and Expense &
Other Margin
Sustained Earnings Growth Through
Challenging Markets and Events
1)
Pre-tax adjusted operating income for International Insurance operations as
presented above excludes the results of our International Investments businesses
previously
included
in
the
International
Investments
segment
and
currently included within “Gibraltar Life and Other Operations”
for financial reporting
purposes, with pre-tax adjusted operating income (loss) of $(412)
million, $25 million, $28 million and $120 million in 2008, 2009, 2010, and 2011, respectively.
2)
CAGR based on 2008 –
2011.
Pre-Tax Adjusted Operating Income
Pre-Tax Adjusted Operating Income
(1)
(1)
($ millions)
2008
2009
2010
2011
$1,581
$1,651
$1,887
$2,263
Financial Strength Symposium 5.24.2012
Earnings are
primarily the result
of stable drivers
Earnings are
Earnings are
primarily the result
primarily the result
of stable drivers
of stable drivers |
 4
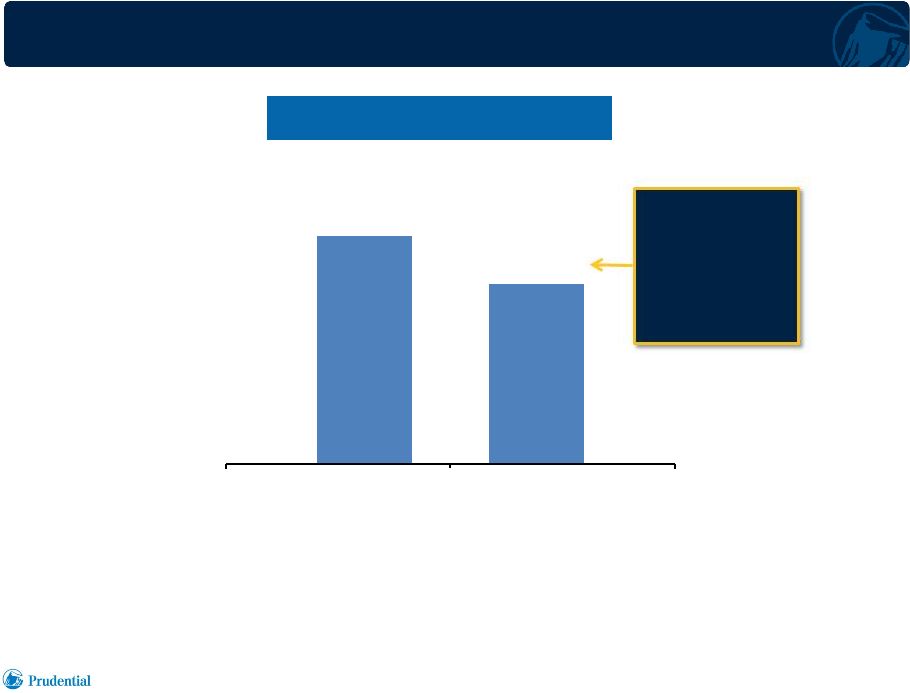
High Return on Equity Driven by Fundamentals
22.2%
17.5%
2010
2011
Return on Equity
Return on Equity
(1)
(1)
Reflects
Star / Edison
before
expense
synergies
Reflects
Reflects
Star / Edison
Star / Edison
before
before
expense
expense
synergies
synergies
Financial Strength Symposium 5.24.2012
1)
Based on after-tax adjusted operating income of our International Insurance operations excluding
the results of our International Investments businesses previously included in the
International investments segment and currently included within “Gibraltar Life and Other Operations” for financial reporting
purposes, using overall effective tax rate for the Financial Services Businesses and associated
attributed equity. Excludes transaction and integration costs relating to the Star / Edison
acquisition in 2011 of $213 million. |
 5
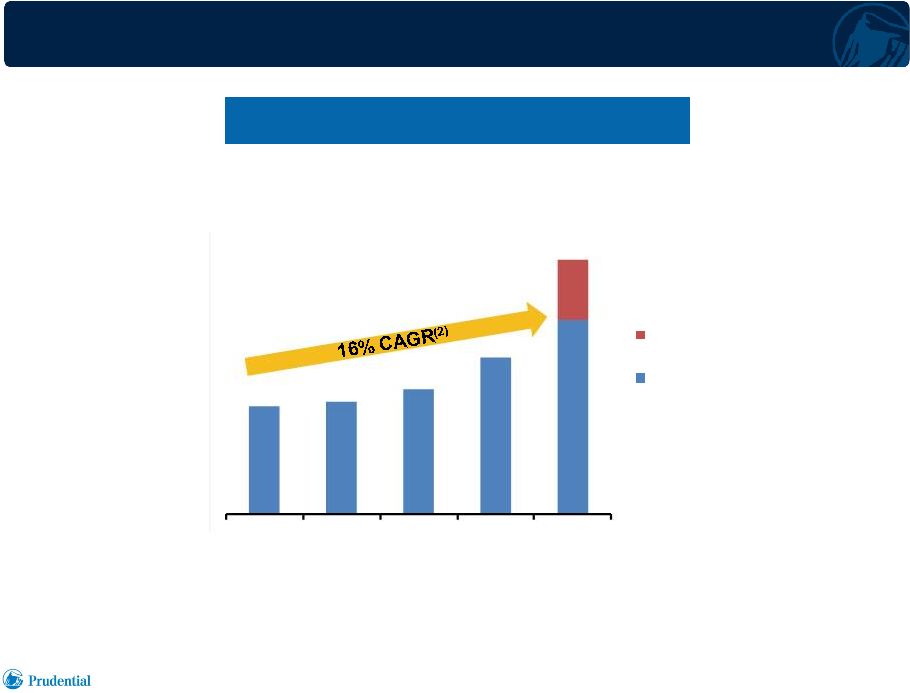
Sustained Business Momentum
Through Financial Crisis and Beyond
Annualized New Business Premiums
(1)
($ millions)
2007
2008
2009
2010
2011
$3,040
$1,870
$1,495
$1,345
$1,293
$2,312
Financial Strength Symposium 5.24.2012
1)
Foreign denominated activity translated to U.S. dollars at uniform exchange rates for all periods
presented; Japanese yen 85 per U.S.dollar; Korean won 1,180 per U.S. dollar. U.S. denominated
activity is included based on the amounts as transacted in U.S. dollars. 2011 includes contribution of
sales by Star / Edison distribution channels, totaling $728 million.
2)
CAGR based on 2007 – 2011, excluding Star / Edison contribution.
Star / Edison
Excluding
Star / Edison |
 6
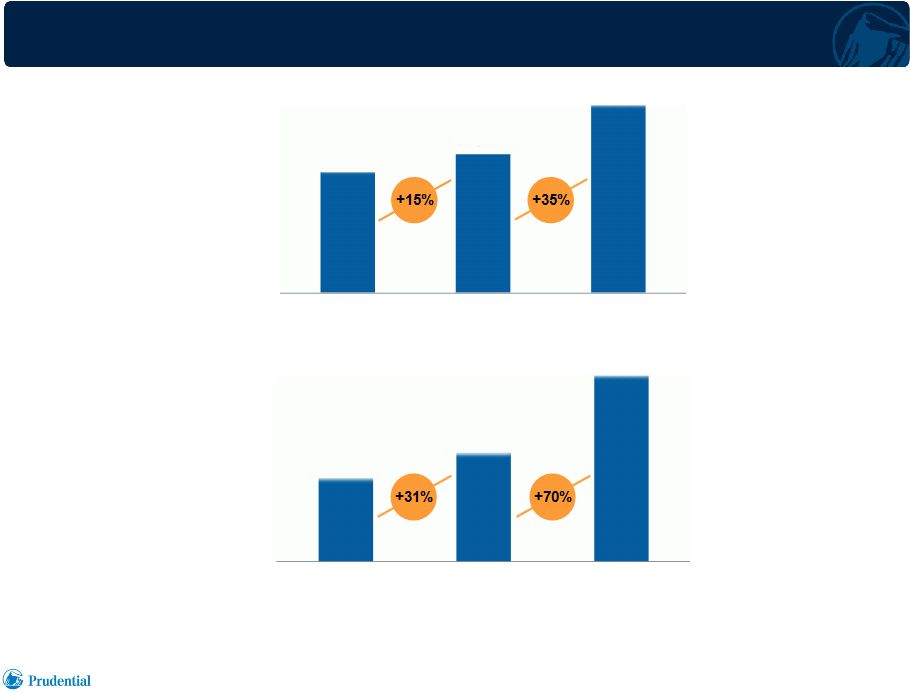
Japan: Track Record of Success
1)
Excludes corporate management and development expenses incurred in the U.S. related
to Japanese Insurance operations other than Gibraltar Life. Excludes results
of International Investments businesses previously included in International Investments segment and transaction and integration costs relating to the
Star / Edison acquisition in 2011 of $213 million.
2)
.
Pre-Tax Adjusted
Operating
Income
(1)
($ millions)
Annualized New
Business
Premiums
(2)
($ millions)
Financial Strength Symposium 5.24.2012
$1,224
$1,600
$2,724
2009
2010
2011
$1,497
$1,724
$2,321
2009
2010
2011
Foreign denominated activity translated to U.S. dollars at uniform exchange rates for all periods
presented; Japanese yen 85 per U.S. dollar. |
 7
Japan: Substantial Growth Opportunities
in an Attractive Market
•
World’s second largest life insurance market:
Life premiums $448 billion
(1)
•
Household sector wealth $19.3 trillion, similar to
U.S. on per-capita basis
(2)
•
$10.9 trillion household pool of currency and deposits
is world’s largest, ~50% higher than U.S.
(2)
•
Expanding retirement market driven by aging population, increased
emphasis on individual responsibility for financial security
•
Customers prefer insurance products to equities, for savings
and investments
•
Growing distribution opportunities include banks and independent
distributors
Financial Strength Symposium 5.24.2012
1)
Source: Swiss Re – statistical appendix, January 2012; based
on 2010 life insurance premiums.
2)
Based on December 31, 2011 data; Sources: Federal Reserve, Bank
of Japan, U.S. Census Bureau, Oanda.
Product
Trend
Distribution
Trend
Retirement
Market
Investable
Asset Pool
Household
Wealth
Market Size |
 8
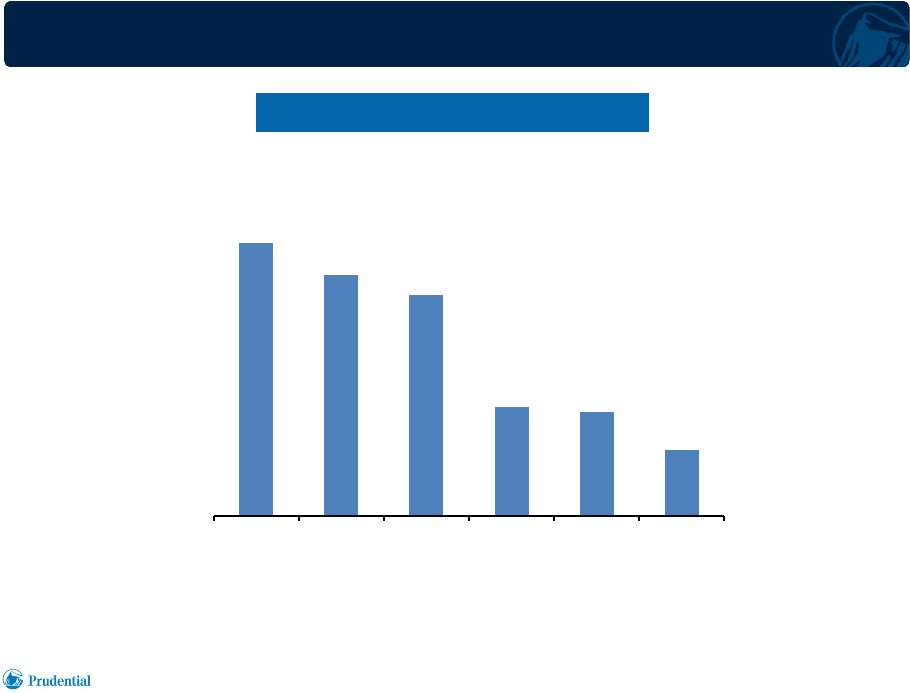
World’s Largest Life Insurance Markets
2010 Life Insurance Premiums
2010 Life Insurance Premiums
(1)
(1)
1)
Source: Swiss Re –
statistical appendix, January 2012.
($ billions)
507
448
410
201
193
122
United
States
Japan
Overall
Asian Market
excluding
Japan
United
Kingdom
France
Italy
Financial Strength Symposium 5.24.2012 |
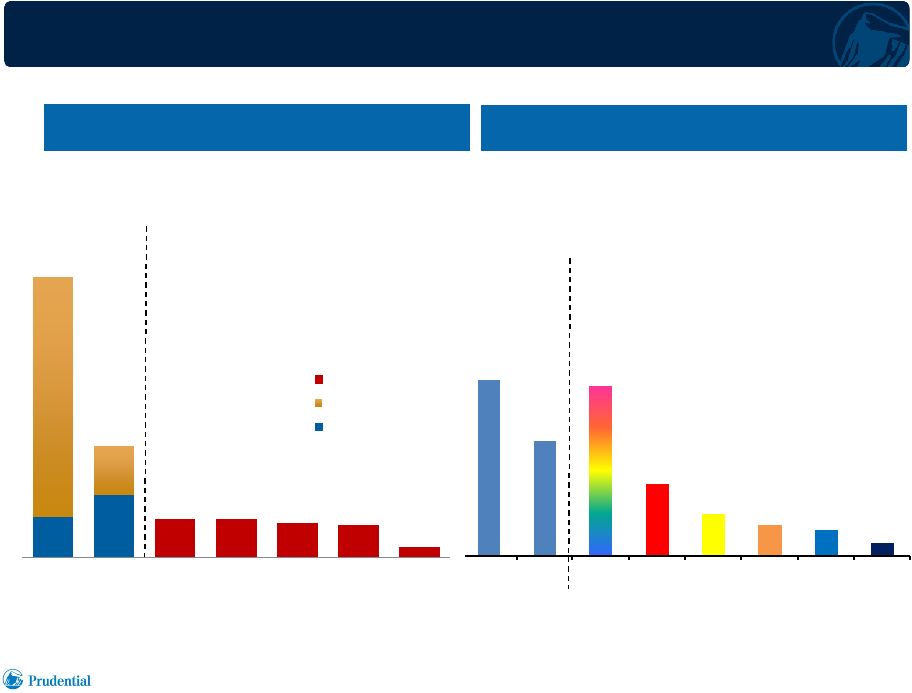 9
Japan has the Largest Pool of Household Assets
in Currency and Deposits
Source:
Federal
Reserve,
Bank
of
Japan,
Eurostat,
Central
Bureau
of
Statistics
of
China,
OECD,
U.S.
Census
Bureau,
Oanda.
Japan and U.S. data as of 12/31/2011; China as of 9/30/2009; other markets as of
12/31/2009. Financial Assets in Household Sector
Financial Assets in Household Sector
($ trillions)
Financial Assets in Currency & Deposits
Financial Assets in Currency & Deposits
($ trillions)
Financial Strength Symposium 5.24.2012
7.1
10.9
42.0
8.4
6.7
6.7
6.0
5.5
1.7
United
States
Japan
Germany
U.K.
China
France
Korea
Total
All others
Currency & deposits
49.1
19.3
10.9
7.1
10.5
4.4
2.6
1.9
1.6
0.8
Japan
U.S.
China
Germany
U.K.
France
China
Germany
U.K.
France
Korea |
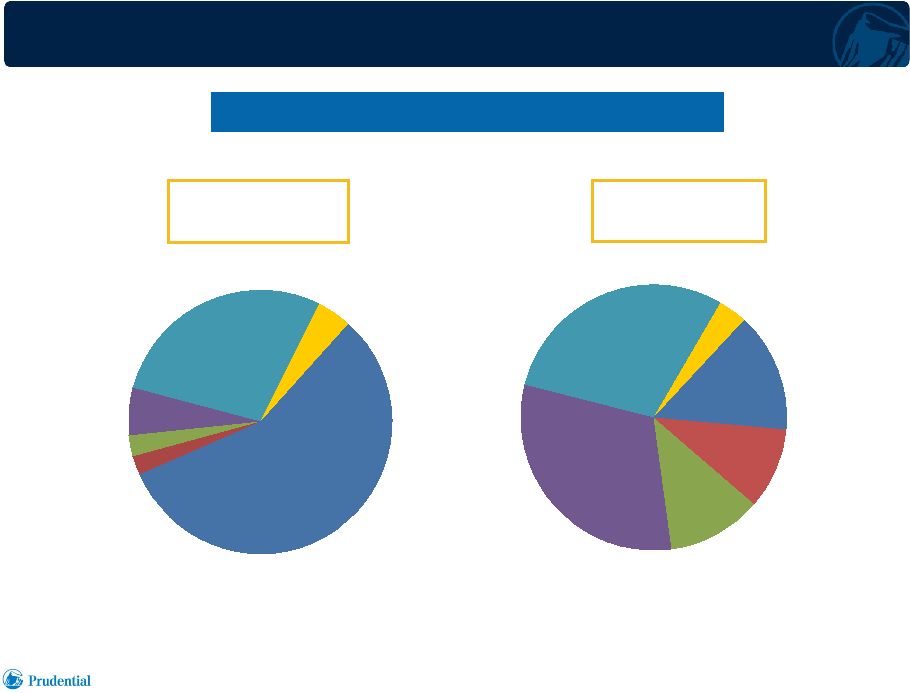 10
Household Sector Financial Assets –
Japan and the United States
Financial Assets of the Household Sector
Financial Assets of the Household Sector
Japan
$19.3 Trillion
United States
$49.1 Trillion
Source: Bank of Japan (data as of December 31, 2011).
Japan data translated to U.S. dollars at Japanese yen 77 per U.S. dollar (FX rate
as of December 31, 2011). Currency and
Deposits
57%
Bonds
2%
Investments
Trusts
3%
Shares and
Equities
6%
Insurance
and Pension
Reserves
28%
Other
4%
Currency and
Deposits
14%
Bonds
10%
Investment
Trusts
12%
Shares and
Equities
31%
Insurance
and Pension
Reserves
29%
Other
4%
Financial Strength Symposium 5.24.2012 |
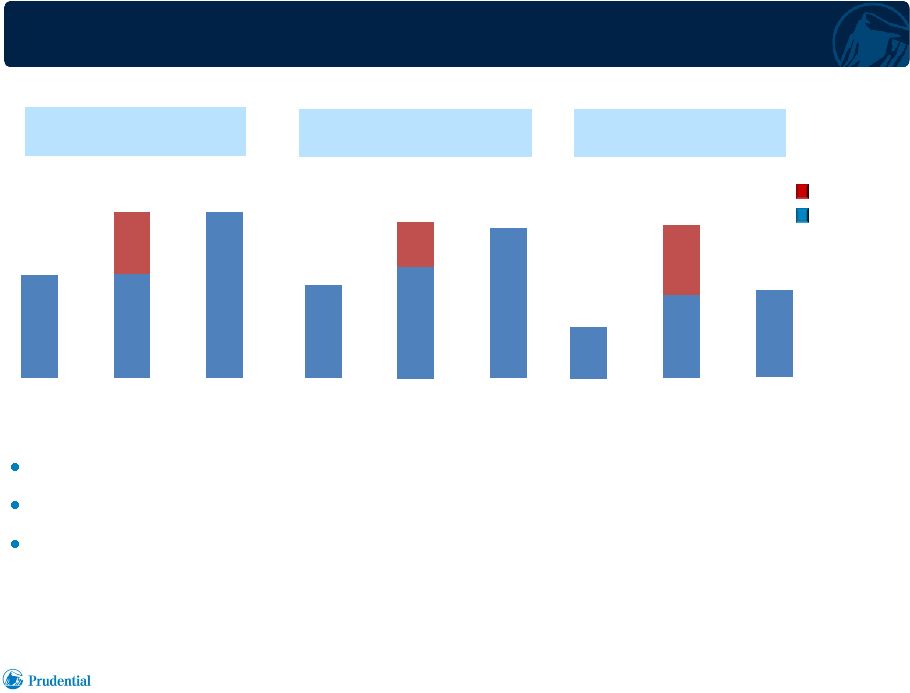 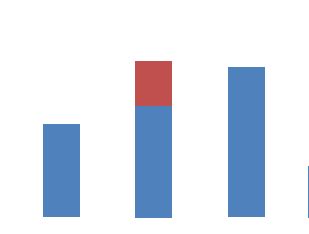 11
Star / Edison Acquisition
Enhances Client Base and Distribution in Japan
Acquisition adds 3.5 million in-force policies, bringing the total to more than
10 million Enhances distribution through captive agents, bank relationships,
and independent agencies Strengthens capital generation and cash flow
potential 1)
In thousands; direct business only; includes annuities.
2)
Prudential of Japan (“POJ”).
Number of
Policies In-force
(1)
Number of
Captive Agents
Number of
Bank Relationships
Star / Edison
Gibraltar / POJ
(2)
,
excluding
Star / Edison
prior to merger
6,452
10,155
12/31/10
12/31/11
10,178
3/31/12
12/31/10
12/31/11
3/31/12
9,403
15,928
15,384
31
12/31/10
12/31/11
3/31/12
98
58
Financial Strength Symposium 5.24.2012 |
 12
Star / Edison Integration On Track
•
Business integration proceeding on schedule
•
Successful merger of Star and Edison into Gibraltar in January 2012,
a major milestone
•
Systems integration well underway
•
“Prudentializing”
sales force: implementing training programs, variable
compensation and productivity requirements
•
Integrated product portfolio
•
Adaptation of acquired investment portfolio to Prudential risk management
standards essentially complete
•
Expect approximately $500 million pre-tax integration costs
over 5 year period, including approximately $175 million
incurred in 2011 and roughly $200 million expected in 2012
•
Targeting annual cost savings of $250 million, with about
65% realized by 2012, 80% by 2013
Financial Strength Symposium 5.24.2012 |
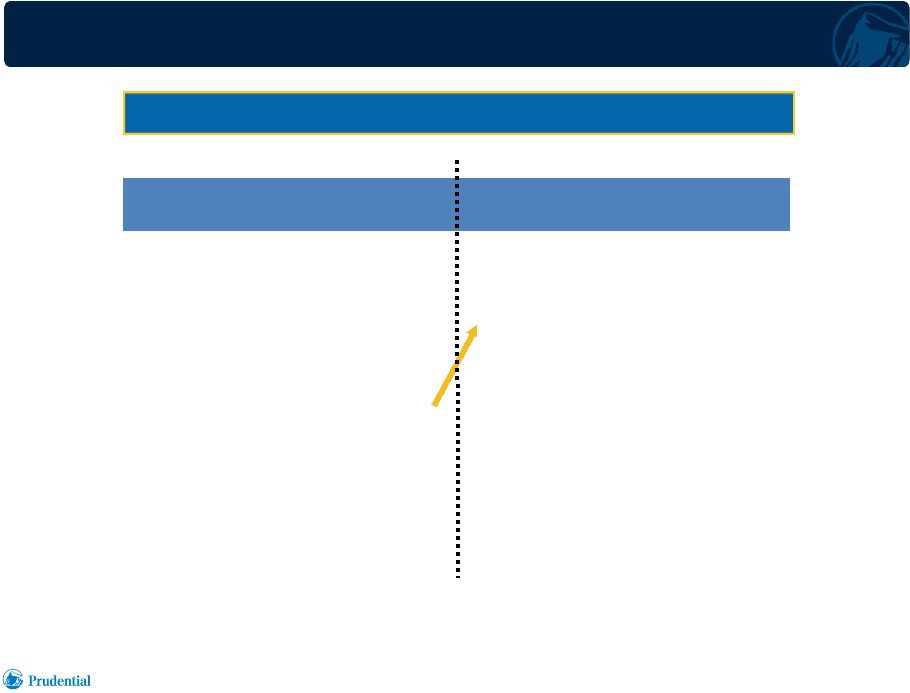 13
Overall Position –
New Business (Face Amount)
(1)
Market Share Improvement of 3.1 Percentage Points
Market Share Improvement of 3.1 Percentage Points
Financial Strength Symposium 5.24.2012
Share
1. Dai-ichi
13.3%
1. Nippon
12.7%
2. Sumitomo
11.1%
2. Dai-ichi
10.9%
3. Nippon
9.7%
3. Prudential
10.4%
4. T&D Financial
9.3%
4. T&D Financial
10.3%
5. AIG Group
7.8%
5. Meiji-Yasuda
9.6%
6.
Prudential
7.3%
6. Sony
6.5%
7. Meiji-Yasuda
6.7%
7. Sumitomo
6.1%
8. Sony
5.7%
8. MetLife Alico
5.5%
9. Millea
3.9%
9. NKSJ
4.6%
10.
Fukoku
3.5%
10. MS & AD Group
3.8%
4 Years Ago
FY 2007
Share
Nine
Months ended
December 31, 2011
1)
Industry data from Life Insurance Association of Japan. Data shown are based on companies’
Japanese statutory results for nine months ended December 31, 2011 and fiscal year ended March
31, 2008. New business amounts are individual life and annuity contracts including net increase by conversion. Excludes
Japan Post Insurance. Prudential’s share for the nine months ended December 31, 2011 includes
Star / Edison, which contributed 2.3% of share. |
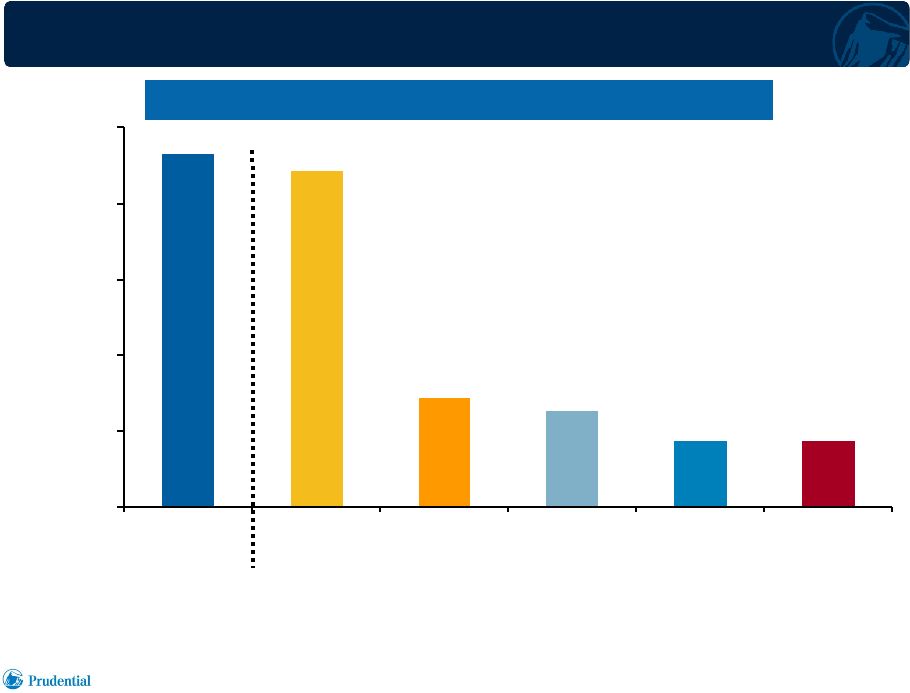 14
Prudential Sales in Japan
Compared to U.S. Life Insurance Companies
1)
Source: LIMRA U.S. individual life insurance sales except Prudential
International Insurance (“PII”) data; life sales only, annuities excluded; Prudential
foreign denominated activity translated to U.S. dollars at uniform exchange rates;
Japanese yen 85 per U.S. dollar. 2011 Annualized New Business Premiums
2011 Annualized New Business Premiums
(1)
(1)
($ millions)
Financial Strength Symposium 5.24.2012
$-
$500
$1,000
$1,500
$2,000
$2,500
PII Japan
Total of 4
Largest U.S.
Companies
Northwestern
Mutual
New York Life
MetLife
Lincoln National |
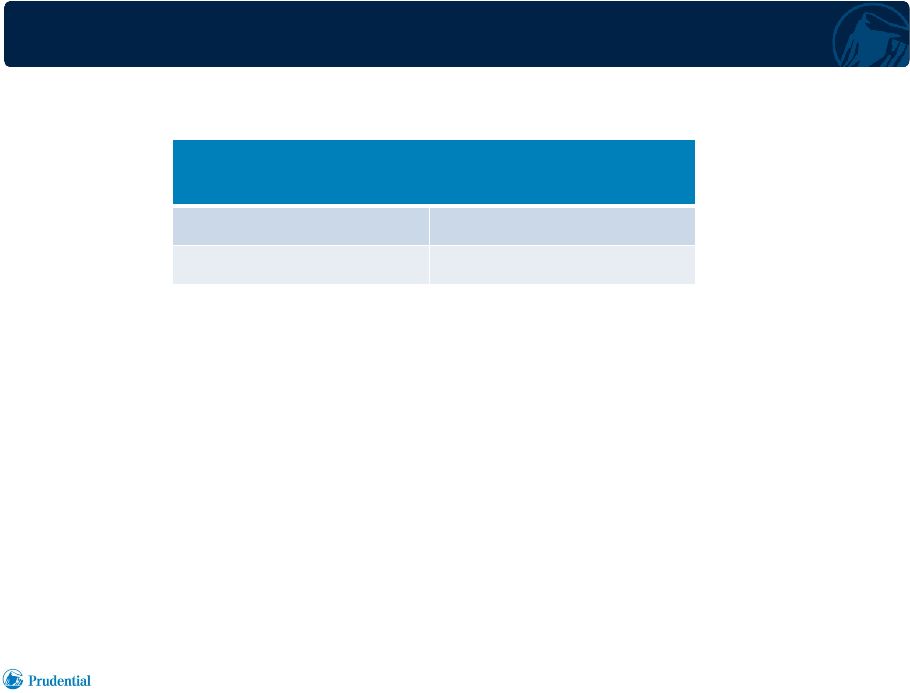 15
Solvency Margins Position Prudential’s Japanese Companies
As Well Capitalized and Financially Secure
Financial Strength Symposium 5.24.2012
1)
Based on Japanese statutory accounting and risk measurement standards applicable to regulatory filings
for fiscal year ended March 31, 2012.
2)
Reflects inclusion of Star and Edison entities which were merged into Gibraltar Life effective January
1, 2012.
“New Method”
Estimated Solvency Margins
as of March 31, 2012
(1)
Prudential of Japan
Over 700%
Gibraltar Life
(2)
Over 700% |
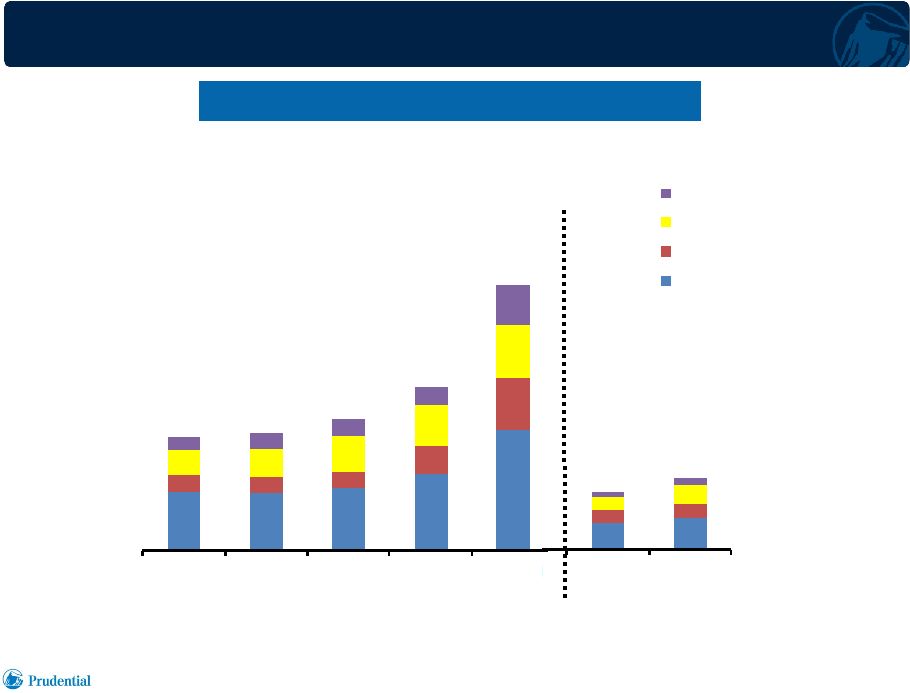 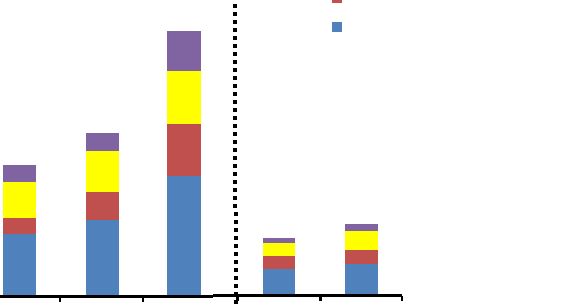 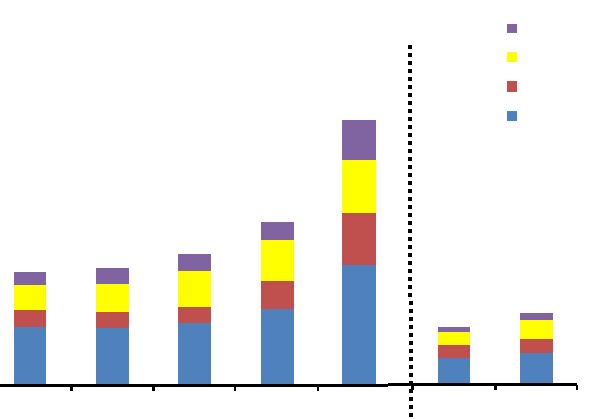 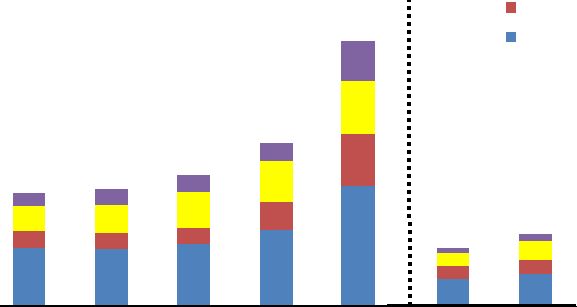 16
New Business Product Trend
Driven by Evolving Financial Security Needs
Annualized New Business Premiums
Annualized New Business Premiums
(1)
(1)
($ millions)
2007
2008
2009
2010
2011
Annuity
Retirement
Accident & Health
Death Protection
$1,293
$1,345
$1,495
$1,870
$3,040
1Q11
1Q12
$660
$819
Financial Strength Symposium 5.24.2012
1)
Foreign denominated activity translated to U.S. dollars at uniform exchange rates for all periods
presented; 85 Japanese yen per U.S. dollar; 1,180 Korean won per U.S. dollar. |
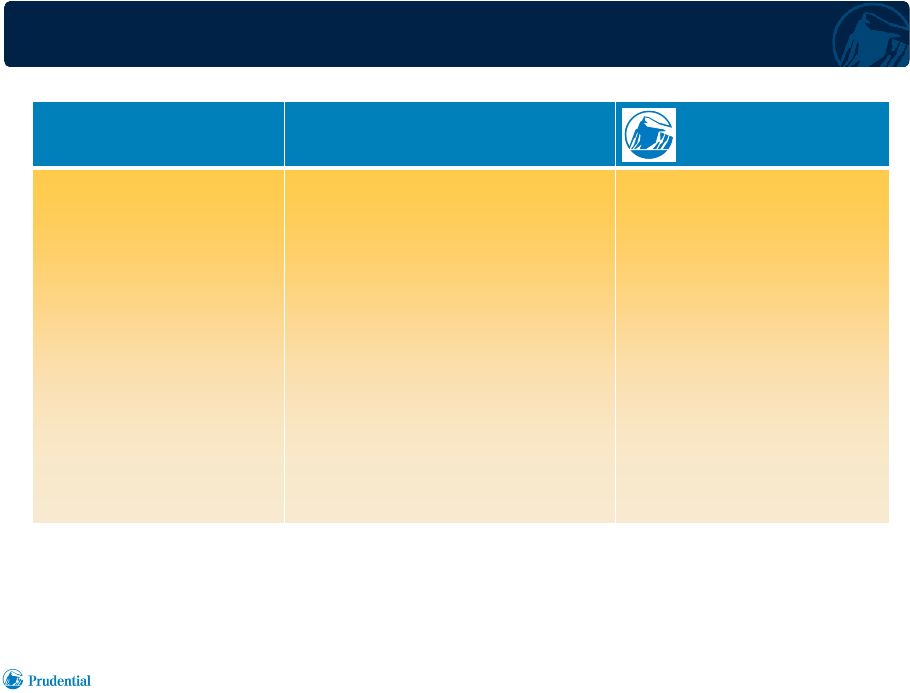 17
Needs-Based Selling over a Lifetime
Client Life Cycle
Client Life Cycle
Financial Risk
Financial Risk
Protection Needs
Protection Needs
Prudential
Prudential
Solutions
Solutions
Young household,
early professional
career
Mid career,
pre-retirement
Retirement
Premature death
income replacement
Income loss and expenses
due to accident or sickness
Accumulation of funds
for retirement
Lifetime retirement income
Term insurance
Accident and health
policies and riders
Whole life insurance
Fixed annuities
Life insurance based
retirement income
products
Financial Strength Symposium 5.24.2012 |
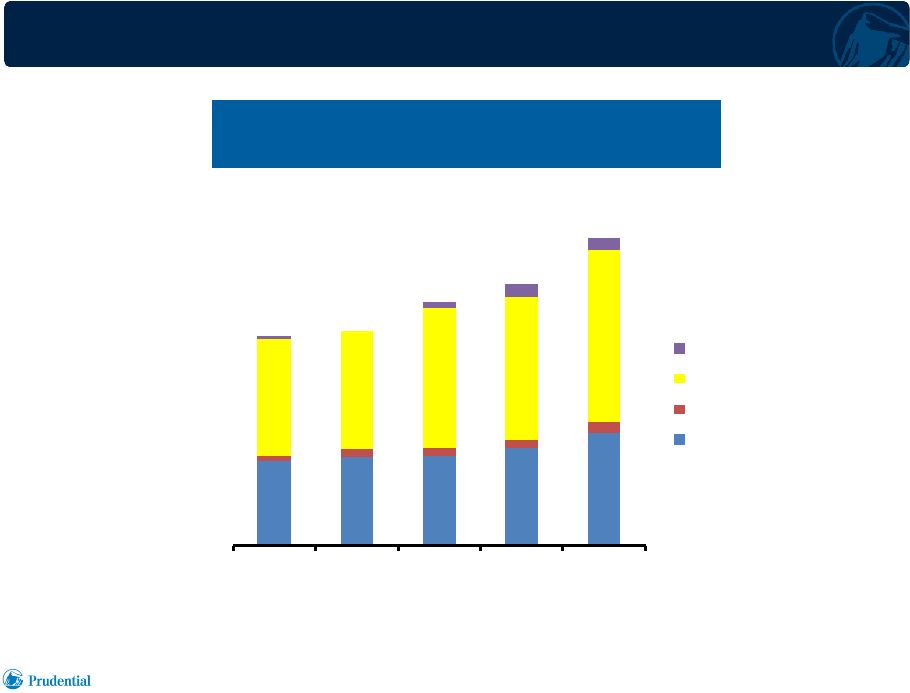 18
41
43
44
48
55
3
4
4
4
5
57
58
68
69
84
1
3
7
6
2007
2008
2009
2010
2011
Annuity
Retirement
Accident & Health
Death Protection
Current Customers are Excellent Prospects
for Additional Coverages to Meet Needs
Annualized New Business Premiums
Annualized New Business Premiums
(1)
(1)
Second Sales to Existing Customers
Second Sales to Existing Customers
($ millions)
1)
Data based on Prudential of Japan; individual market only; foreign denominated
activity translated to U.S. dollars at uniform exchange rates; Japanese yen 85 per
U.S. dollar.
102
105
119
128
150
Financial Strength Symposium 5.24.2012 |
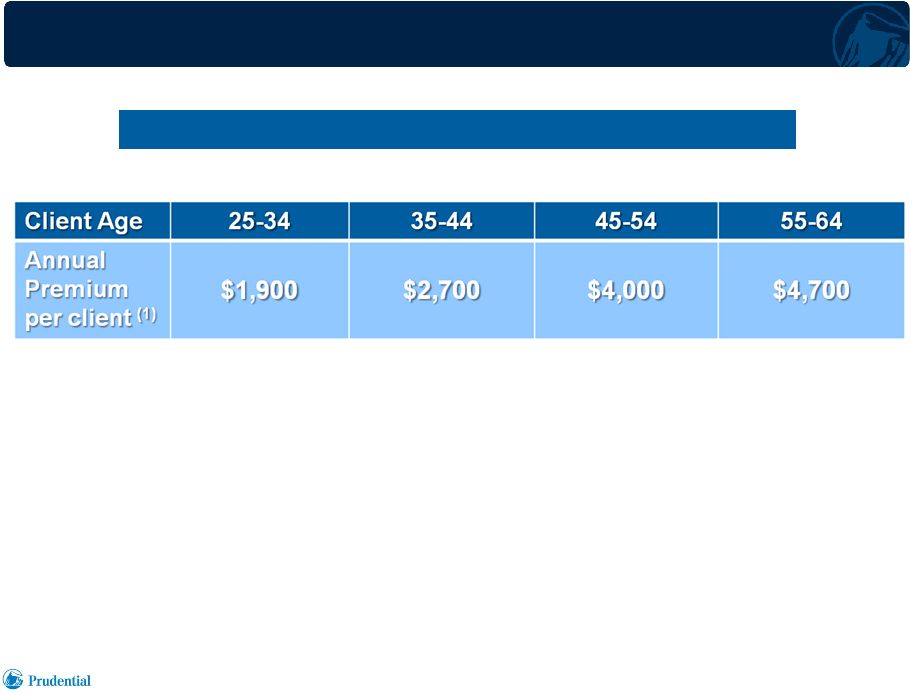 19
Protecting Financial Security For a Lifetime
Aging population leads to demand for larger policy size
Aging population leads to demand for larger policy size
1)
Based on average annual premium for Prudential of Japan individual life and annuity
policies newly issued during 2011; foreign-denominated activity
translated to U.S. dollars at uniform exchange rates, Japanese yen 85 per U.S.
dollar. Financial Strength Symposium 5.24.2012
|
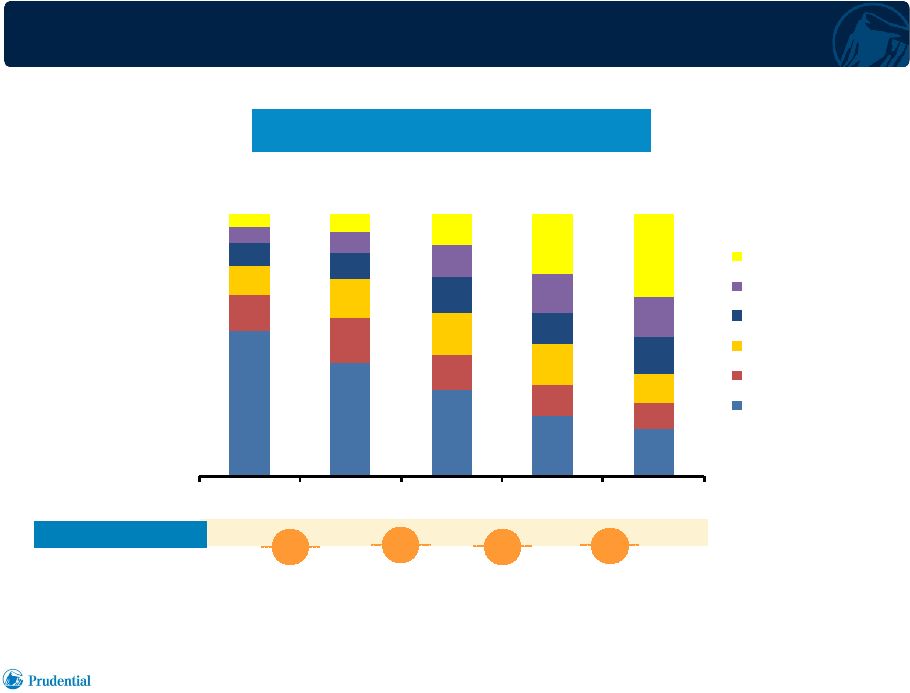  20
Growing Retirement Market Complements
Substantial Premature Death Protection Market
Source: National Institute of Population and Social Security Research, Japanese
Journal of Population. Japan Demographic Trend
Japan Demographic Trend
Population (millions)
89
105
124
128
115
+16
+19
+4
-13
55%
43%
33%
23%
18%
14%
17%
13%
12%
10%
11%
15%
16%
15%
11%
9%
10%
14%
12%
14%
6%
8%
12%
15%
15%
5%
7%
12%
23%
32%
1950
1970
1990
2010
2030
65+
55-64
45-54
35-44
25-34
0-24
Financial Strength Symposium 5.24.2012 |
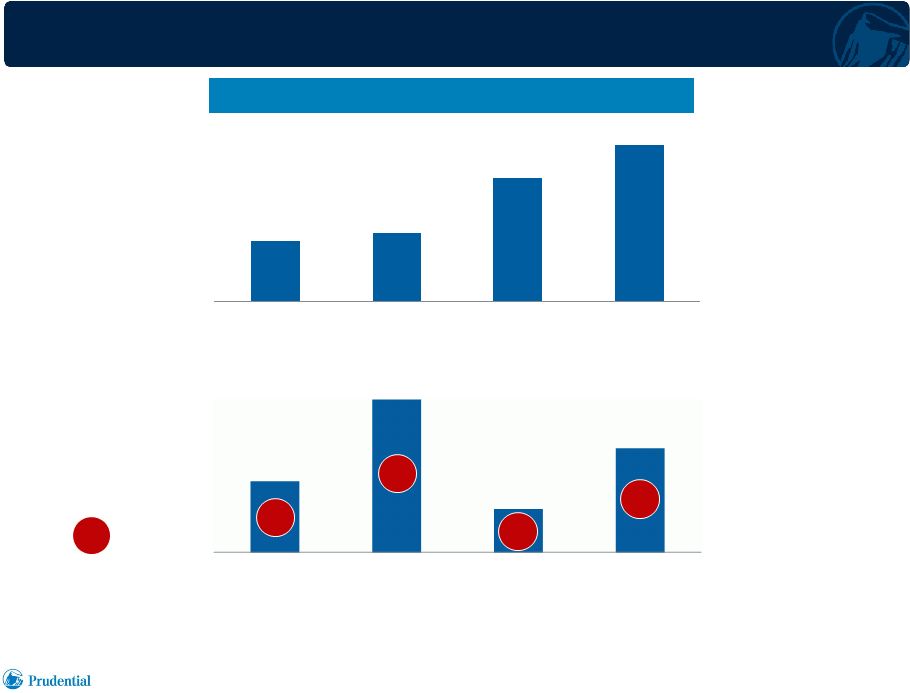 21
Well Diversified Products Meeting Evolving Client Needs
1)
Foreign denominated activity translated to U.S. dollars at uniform exchange rates;
Japanese yen 85 per U.S. dollar. $1,725
$1,939
$3,547
$4,503
Accident &
Health
Death
Protection
Annuity
Retirement
19%
19%
41%
41%
12%
12%
28%
28%
($ millions)
2011
Annualized
New Business
Premiums by
Product
(1)
= $1,709 million
100%
100%
($ whole amount)
Average
Premium per
New Policy by
Product
(1)
Overall
Average
Premium = $2,387
Financial Strength Symposium 5.24.2012
$330
$703
$198
$478
Accident &
Health
Death
Protection
Annuity
Retirement
Japanese Life Planner/Life Consultant Sales
Japanese Life Planner/Life Consultant Sales |
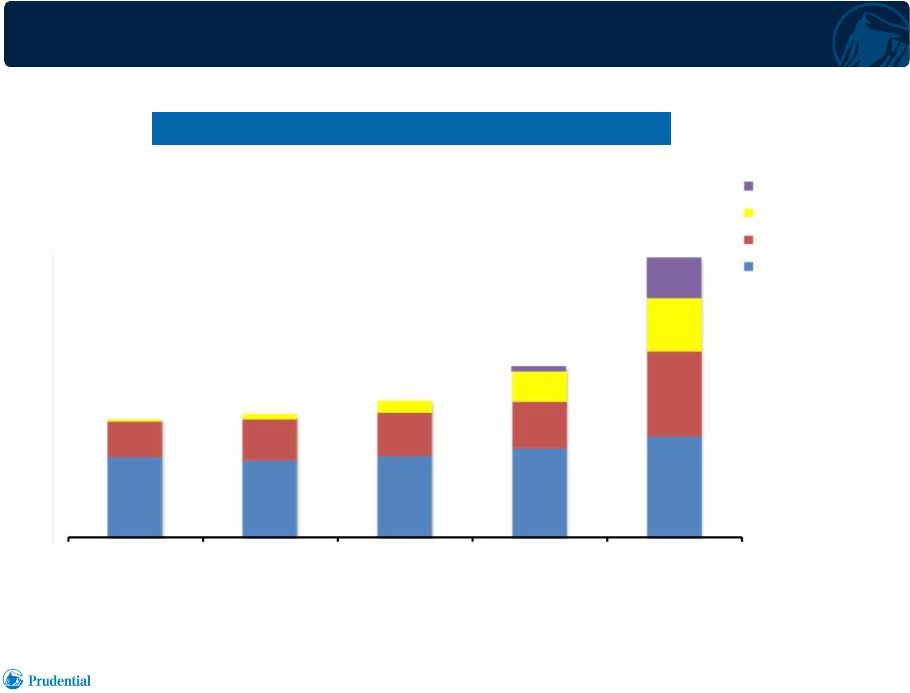 22
International Insurance
Growing Sales Throughout Multiple Channels
1)
Foreign
denominated
activity
translated
to
U.S.
dollars
at
uniform
exchange
rates
for
all
periods
presented;
Japanese
yen
85
per
U.S.
dollar; Korean won
1,180 per U.S. dollar.
($ millions)
Annualized New Business Premiums
(1)
$ 1,293
$ 1,345
$ 1,495
$ 1,870
$ 3,040
Financial Strength Symposium 5.24.2012
2007
2008
2009
2010
2011
Independent Agency
Bank Channel
Life Consultants
Life Planners |
 23
Life Planner Distribution
•
Life Planner –
a selective, high quality sales force
–
Hire about 3 out of 100 candidates
–
Well trained and professional
–
Customer focused
–
Disciplined, and demonstrate “missionary zeal”
•
Emphasize protection products requiring analysis of client needs
•
Significant sales to small business/executive/professional market
•
Exceptional sales productivity and persistency
Financial Strength Symposium 5.24.2012 |
 24
Teachers Association
Core Relationship Contributes to Life Consultant Distribution
•
Relationship since 1952
•
Approximately 600,000 members
(1)
•
Access to approximately 950,000 teachers and school personnel through 47
prefectural (local) associations and 36,000 schools
(1)
•
Annualized new business premiums in 2011, $209 million
(2)
Japanese Educational Mutual Aid
Japanese Educational Mutual Aid
Association of Welfare Foundation
Association of Welfare Foundation
(Teachers Association)
(Teachers Association)
1)
As of March 31, 2012.
2)
Foreign denominated activity translated to U.S. dollars at uniform exchange rates;
Japanese yen 85 per U.S. dollar. Financial Strength Symposium
5.24.2012 |
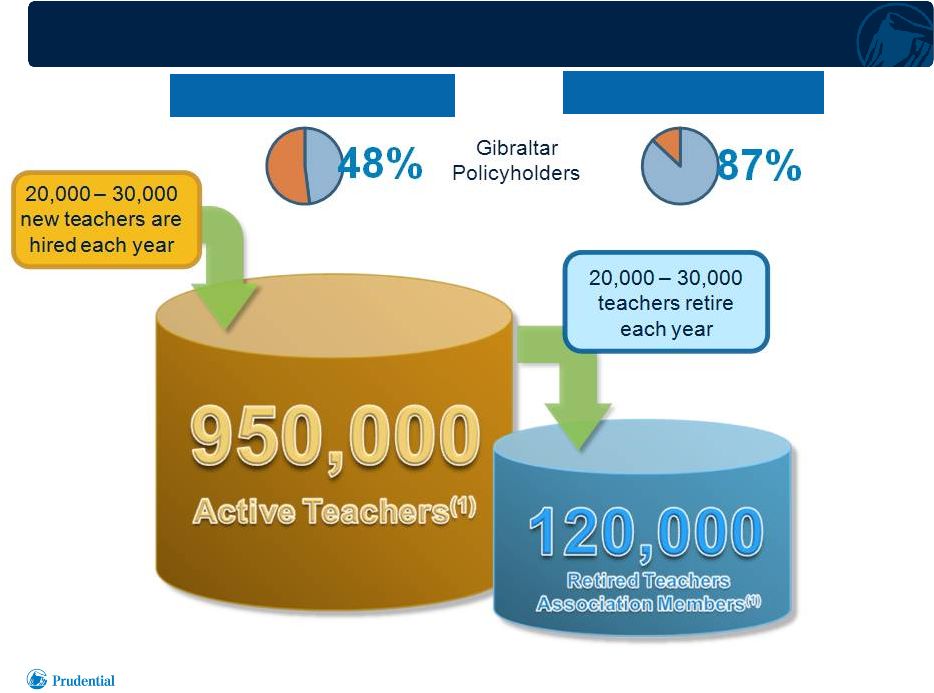 25
Teachers Association: Perennial Sales Opportunities
1)
Numbers approximate as of March 31, 2012.
Active Market
Active Market
Retiree Market
Retiree Market
Financial Strength Symposium 5.24.2012 |
 26
Bancassurance Powered by Prudential
Typical Bank Channel Approach
in Japanese Market
Prudential’s Distinctive
Bank Channel Strategy
•
Foreign carriers drove high bank
channel sales through
aggressive variable annuity
strategies
•
Value propositions dependent on
market performance
1)
At certain banks.
Financial Strength Symposium 5.24.2012
•
Focus on underserved death
protection needs and
complementary products
with favorable margins and
risk profiles
•
Insurance education and training
backed by proven distribution
model
•
Access to expertise of
“seconded”
former Prudential of
Japan Life Planners
(1)
•
Expand successful model to
other banks including regionals |
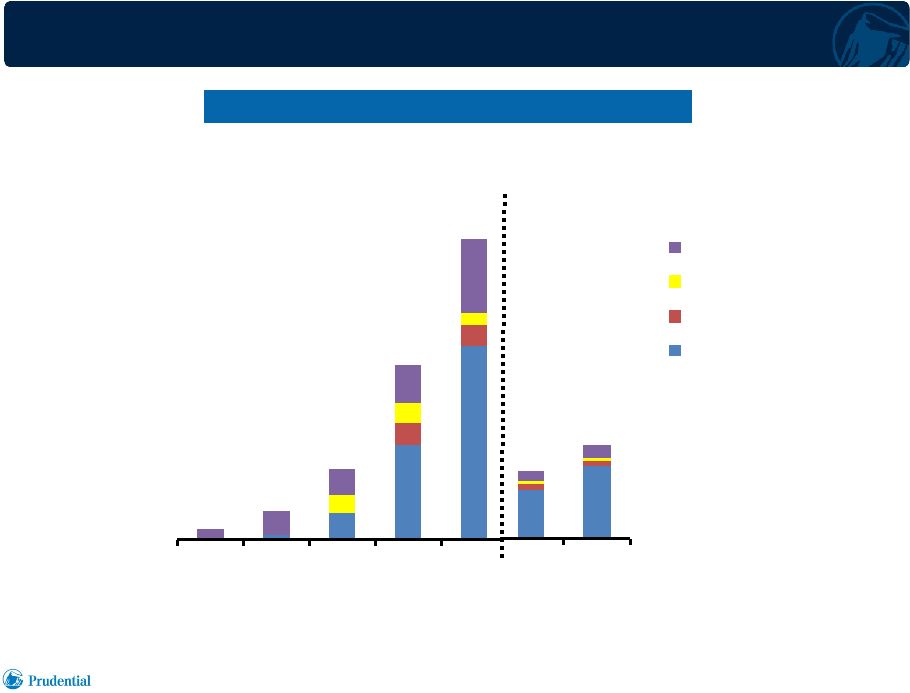    27
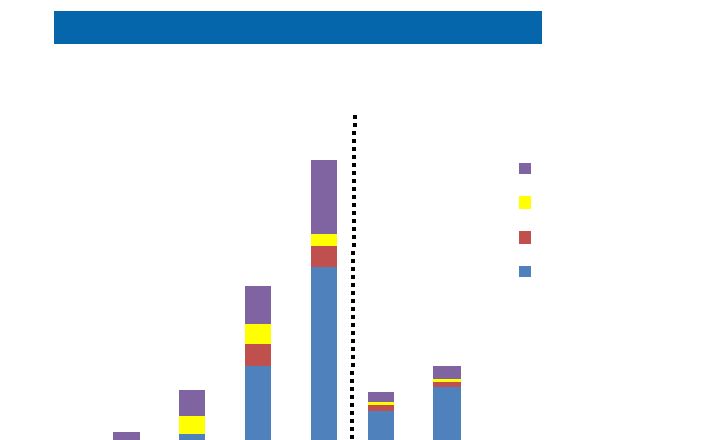
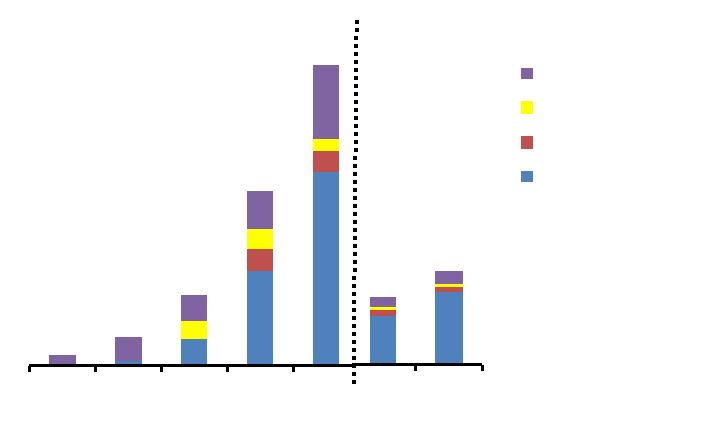
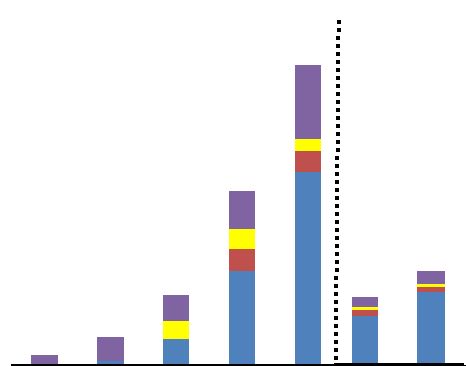
Bank Channel Sales Growth
Driven By Protection Products
Annualized New Business Premiums
(1)
($ millions)
2007
2008
2009
2010
2011
$56
$22
$137
$336
$580
Annuity
Retirement
Accident & Health
Death Protection
1Q11
1Q12
$132
$182
Financial Strength Symposium 5.24.2012
1)
Foreign denominated activity translated to U.S. dollars at uniform exchange rates for all periods
presented; Japanese yen 85 per U.S. dollar. |
 28
Bancassurance Enhances Access to
Substantial Japanese Household Investable Wealth
Japanese
Japanese
household
household
wealth
wealth
held
held
in
in
currency
currency
and
and
deposits
deposits
(1)
(1)
$10.9 Trillion
$10.9 Trillion
Prudential policies typically purchased in bank channel
•
Limited-pay whole life
(2)
•
Retirement income
•
U.S. dollar and other non-yen
fixed annuities
Average
premium
per
policy
from
bank
channel
sales
(3)
$8,500
Former
Life
Planners
“seconded”
to
selected
banks
(4)
180
1)
Based on December 31, 2011 data; source: Bank of Japan.
2)
Primarily 3-
and 5-
year payment contracts, and single premium contracts.
3)
uniform exchange rates; Japanese yen 85 per U.S. dollar.
4)
Active as of March 31, 2012.
Financial Strength Symposium 5.24.2012
For the year ended December 31, 2011; based on annualized new business premiums; foreign denominated
activity translated to U.S. dollars at |
 29
Bank Channel
Building Relationships for Continued Growth
•
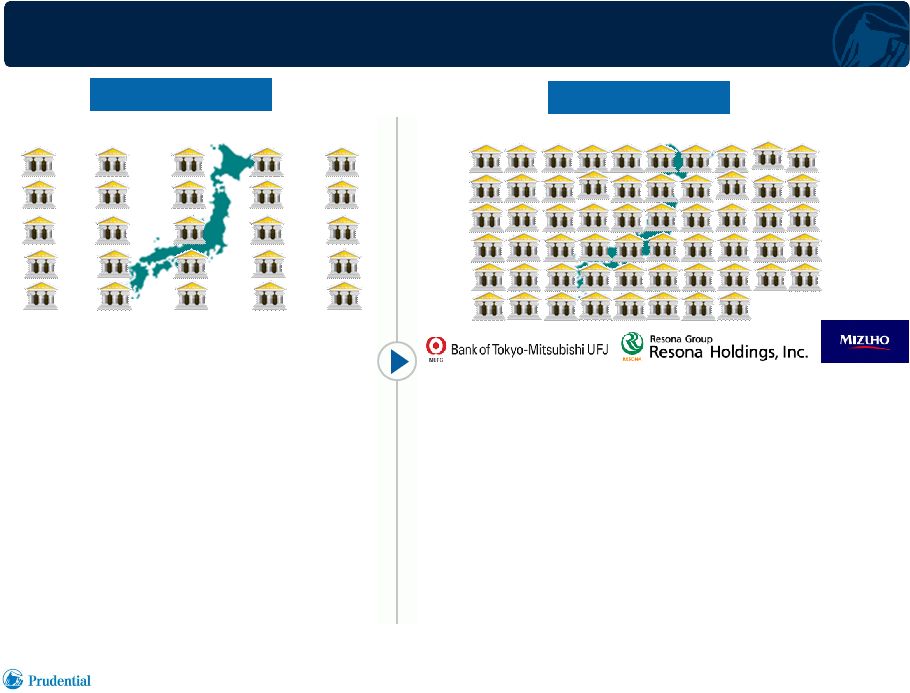
Total of 58 bank sales relationships established,
including three of Japan’s four largest banks
•
Active relationships offer approximately
6,000+ potential points of sale
(3)
covering the
majority of the Japanese prefectures
2009
(1)
2012
(2)
Financial Strength Symposium 5.24.2012
1)
As of December 31, 2009.
2)
As of March 31, 2012.
3)
Potential points of sale represent an aggregated total number of branches of the bank partners as of
March 2011. •
Sales through 25 banks, primarily
fixed annuities |
 30
Independent Agency Channel
•
Commenced distribution of selected products in 2010; contributed
$435 million
(1)
to annualized new business premiums for 2011 including
$298 million from Star / Edison distribution
•
Star / Edison acquisition provided over 4,000 independent
agent relationships
(2)
•
Broadens geographical coverage, enhances access to attractive
markets including small businesses
Financial Strength Symposium 5.24.2012
1)
Foreign denominated activity translated to U.S. dollars at uniform exchange rates; Japanese yen 85 per
U.S. dollar. 2)
Approximately 3,500 independent agency relationships as of March 31, 2012. |
 31
Key Takeaways
•
Solid business model with sustained track record of success
•
High ROE, strong AOI growth, low volatility: returns and earnings
primarily the result of stable drivers
•
Leading position in attractive Japanese market, strengthened by
Star / Edison acquisition
•
Competitive advantages in distribution, coupled with financial strength
and reputation, driving growth across multiple channels
•
Strong growth prospects enhanced by product portfolio serving lifetime
financial security needs
Financial Strength Symposium 5.24.2012 |
 Investment Portfolio
Scott Sleyster
Senior Vice President
Chief Investment Officer, U.S. |
 Well
Positioned Investment Portfolio 2
Financial Strength Symposium 5.24.2012
Investment Management is a core competency for Prudential
Our General Account investment portfolio is well diversified to support our
insurance liabilities
We underwrite much of our own credit risk through direct originations of Private
Placements and Commercial Mortgages
Acquisition of Star & Edison increased Japanese Insurance operations to almost
50% of the Financial Services Businesses’
General Account (“FSB General
Account”) investment portfolio |
 Broad
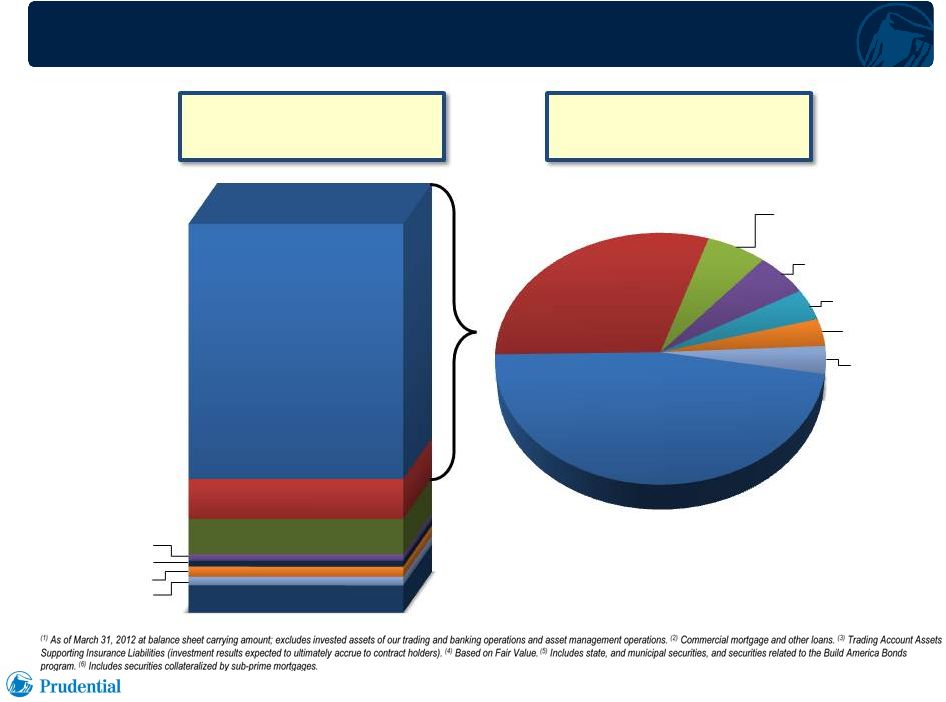
Investment Expertise Supports Risk Diversification 3
Financial Strength Symposium 5.24.2012
Public Fixed Maturities
66%
Private Fixed Maturities
10%
Commercial Loans
(2)
9%
Equities, 2%
Other Long Term, 1%
Short Term & Other, 3%
Policy Loans, 2%
TAASIL
(3)
7%
Japanese
Government Bonds
23%
Other Foreign Government
Bonds, 5%
U.S. Government
(5)
4%
CMBS, 3%
ABS
(6)
, 3%
RMBS, 3%
Corporates
35%
FSB General Account
Investment Portfolio
$278.3 Billion
(1)
FSB General Account
Fixed Maturities
$211.4 Billion
(4) |
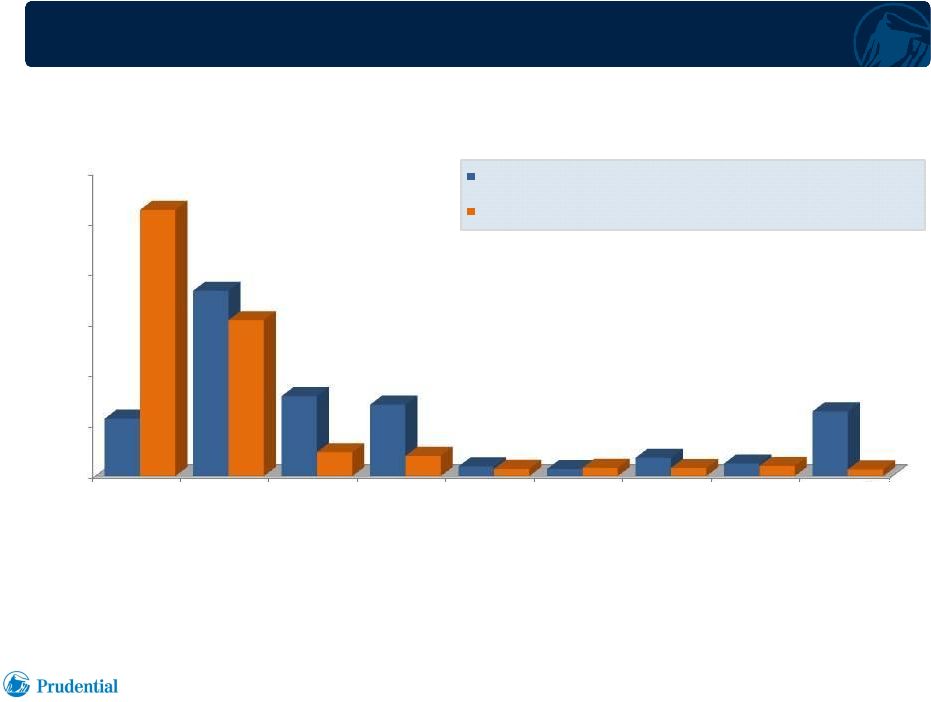 Japanese Portfolio Almost 50% of FSB General Account
(1)
4
Financial Strength Symposium 5.24.2012
(1)
As
of
March
31,
2012
at
balance
sheet
carrying
amount;
excludes
invested
assets
of
our
trading
and
banking
operations
and
asset
management
operations.
(2)
Commercial
mortgage
and
other
loans.
(3)
Trading
Account
Assets
Supporting
Insurance
Liabilities
(investment
results
expected
to
ultimately
accrue
to
contract
holders).
(2)
(3)
0%
10%
20%
30%
40%
50%
60%
Governments
Public
Fixed
Maturities
Private
Fixed
Maturities
Commercial
Loans
Equities
Other
Long-term
Short-term
& Other
Policy
Loans
TAASIL
11%
37%
16%
14%
2%
1%
4%
2%
13%
52%
31%
5%
4%
1%
2%
2%
2%
1%
FSB General Account, ex. Japanese Operations: $140.0 Billion
FSB General Account, Japanese Operations: $138.3 Billion
|
 Asset
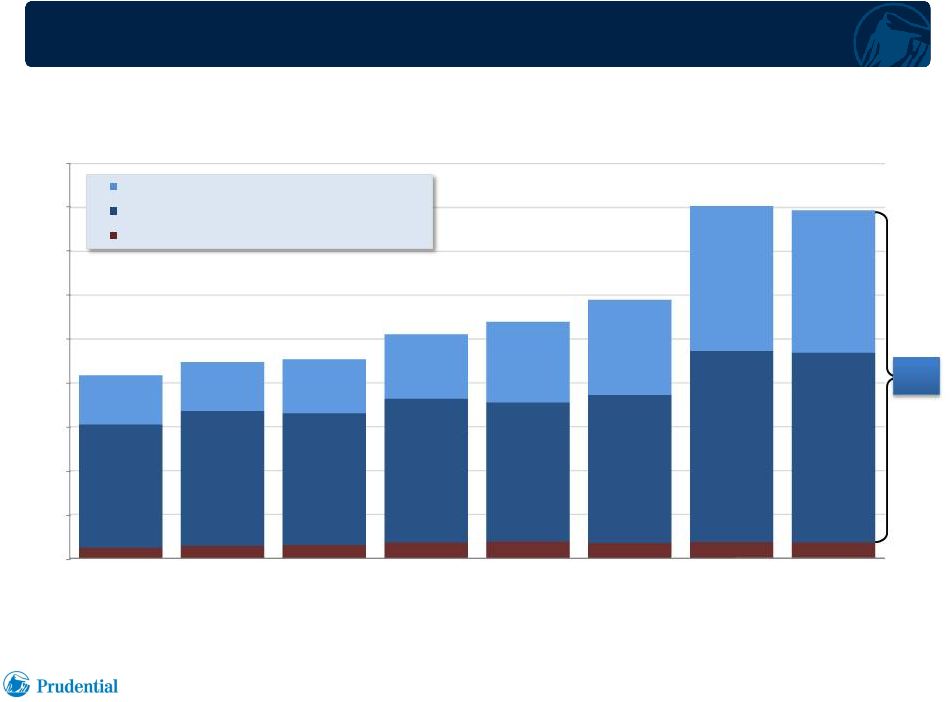
Selection Focus on Quality 5
Financial Strength Symposium 5.24.2012
FSB General Account
Fixed Maturity Portfolio
(1)
($ billions)
$104.4
$111.9
$113.5
$127.7
$134.9
$147.4
$200.9
$198.4
(1)
Amortized Cost. Reflects equivalent ratings for investments of the International
Insurance operations. (2)
NAIC 1-2
(3)
NAIC 3-6
$0
$25
$50
$75
$100
$125
$150
$175
$200
$225
2005
2006
2007
2008
2009
2010
2011
1Q 2012
$6.0 6%
7.1 6%
$7.5
7%
$9.0
7%
9.5 7%
$8.7
6%
$9.3
5%
$9.0
$70.3
67%
$76.8
69%
$75.2
66%
$81.9
64%
$79.3
59%
$84.3
57%
$108.8
54%
$108.1
54%
$
$
5%
$28.1
27%
$28.0
25%
$30.8
27%
$36.8
29%
$46.1
34%
$54.4
37%
$82.8
41%
$81.3
41%
High
or
Highest
Quality:
Governments
(2)
High
or
Highest
Quality:
Non-Governments
(2)
Other
Securities
(3)
95% |
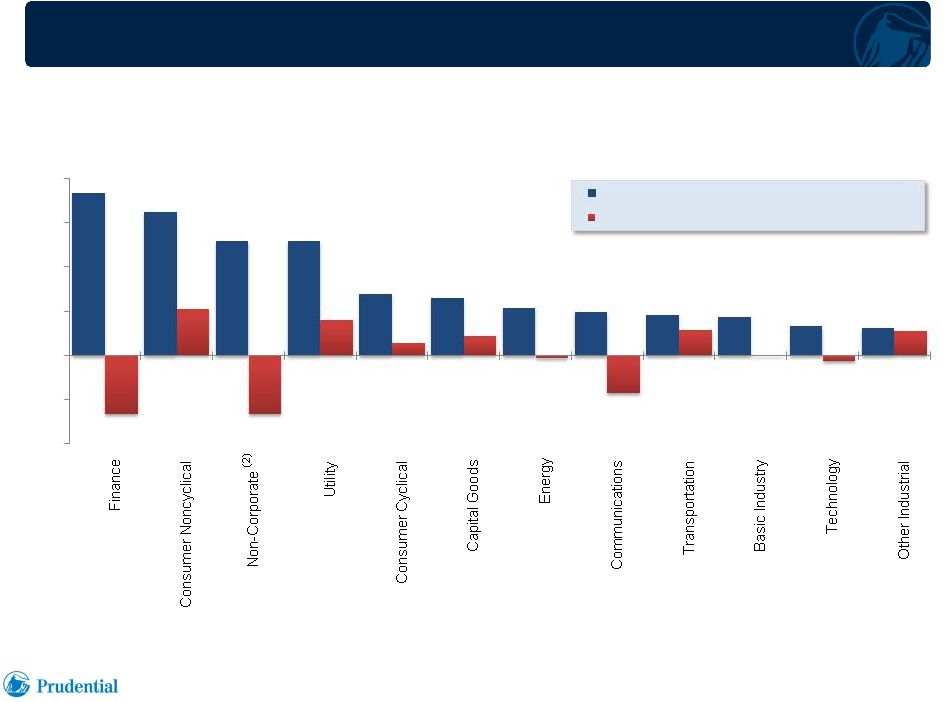 Defensively Positioned Corporate Bond Portfolio
6
Financial Strength Symposium 5.24.2012
Corporate
Bond
Holdings
by
Sector
(1)
Financial Services Businesses vs. Barclays Index
March 31, 2012
(1)
Market Value
(2)
Non-Corporate includes Sovereigns, Supranationals, State and Municipals
10%
-5%
0%
5%
10%
15%
20%
Financial Services Businesses Exposure
Over/Under Weight vs Barclays Capital Indices
- |
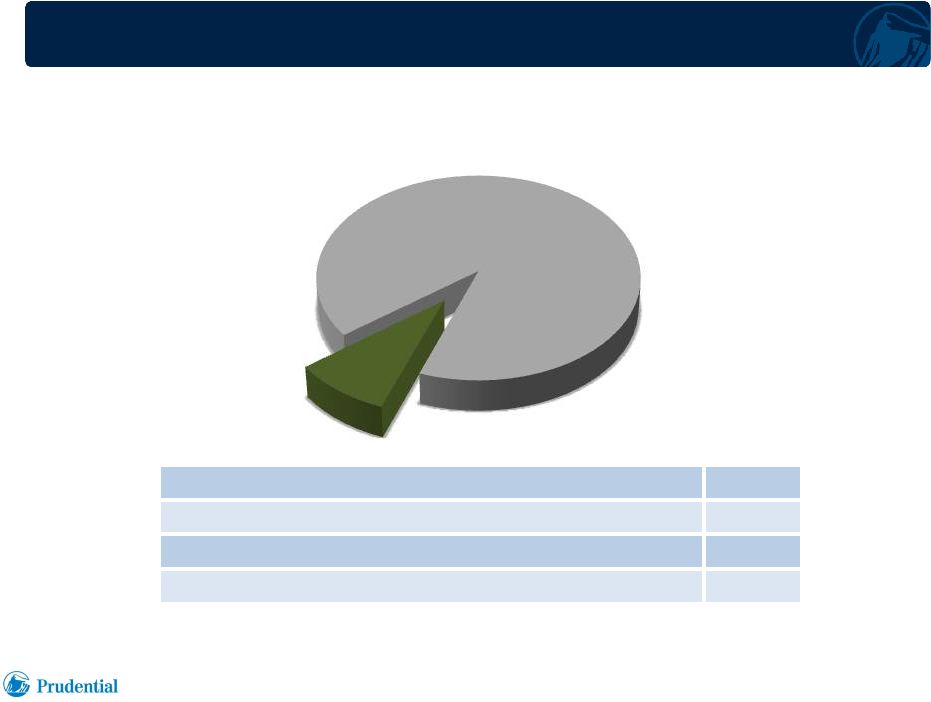 Strong Commercial Loan Portfolio
7
Financial Strength Symposium 5.24.2012
FSB
General
Account
Portfolio
(1)
(100% = $278.3 billion)
$25,231
9.1 %
Commercial Mortgage
and Other Loans
($ millions)
(1)
As of March 31, 2012 at balance sheet carrying amount.
Weighted Average Debt Service Coverage Ratio (DSCR)
1.9x
Weighted Average Loan to Value Ratio (LTV)
58%
Agricultural and Commercial Loans at a Fixed Rate
98%
Over 30 Days Past Due
0.4% |
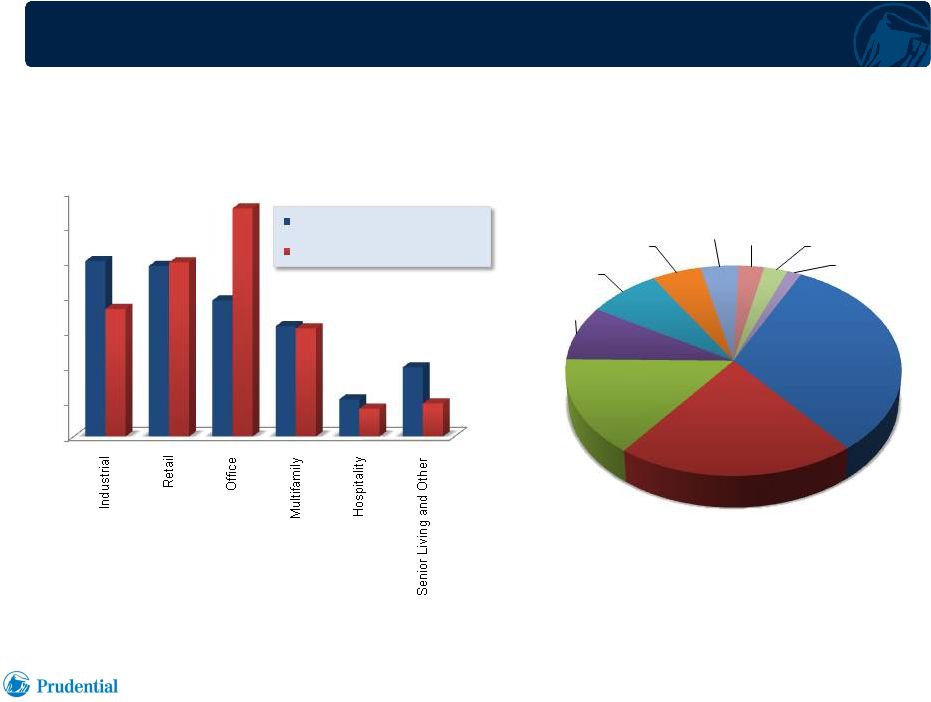 Broadly Diversified Commercial Loan Portfolio
8
Financial Strength Symposium 5.24.2012
Commercial and Agricultural Loans
by Region
(1,3)
Commercial Loans
by
Major
Property
Type
(1,2)
(1)
For the FSB General Account. As of March 31, 2012, at gross carrying value.
(2)
Commercial Mortgages Only ($21.0 Billion). Other consists of golf courses, ski resorts,
parking garages, self-storage, hospital and ground leases. (3)
Commercial and Agricultural Loans only ($22.4 Billion).
0%
5%
10%
15%
20%
25%
30%
35%
25%
24%
20%
16%
5%
10%
18%
25%
33%
15%
4%
5%
Prudential (03/31/12)
ACLI ex. Prudential (12/31/11)
Pacific
31.9%
South
Atlantic
21.2%
Middle
Atlantic
14.9%
West South
Central
8.4%
East North
Central
7.7%
Mountain
5.2%
Non
US
4.0%
New
England
2.7%
West North
Central
2.5%
East South
Central
1.5%
- |
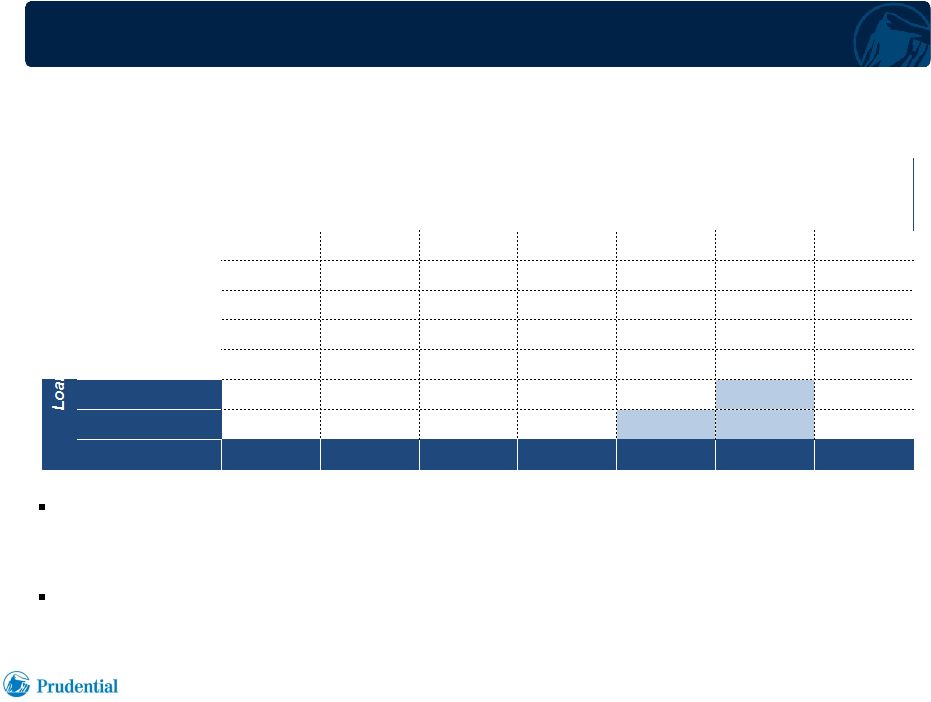   Commercial & Agricultural Mortgage Loan Portfolio
9
Financial Strength Symposium 5.24.2012
$25,474
9.2 %
FSB
General
Account
(1)
($ millions)
As
of
March
31,
2012,
the
valuation
allowance
for
our
commercial
mortgage
and
other
loan
portfolio
was
$243 million, a decrease of $7 million from year-end 2011 and a decrease of $82
million from the year ago quarter
We regularly revalue the portfolio using conservative up-to-date cap
rates (1)
As of March 31, 2012 at gross carrying value.
Greater
than 2.0x
1.8x
to 2.0x
1.5x
to < 1.8x
1.2x
to < 1.5x
1.0x
to < 1.2x
Less
than 1.0x
Totals
0%-49.99%
3,467
$
1,033
$
1,129
$
703
$
331
$
76
$
6,739
$
50%-59.99%
1,555
723
1,023
412
218
74
4,005
$
60%-69.99%
2,277
763
1,591
1,520
352
133
6,636
$
70%-79.99%
524
202
621
1,312
761
33
3,453
$
80%-89.99%
19
-
55
277
208
340
899
$
90%-100%
-
-
-
-
132
174
306
$
Greater than 100%
-
-
35
17
40
310
402
$
Totals
7,842
$
2,721
$
4,454
$
4,241
$
2,042
$
1,140
$
22,440
$
Debt Service Coverage Ratio (DSCR) |
 Commercial Mortgage-Backed Securities
(1)
10
Financial Strength Symposium 5.24.2012
FSB General Account
Amortized Cost at Lowest Rating Agency Rating
($ millions)
(1)
As
of
March
31,
2012.
(2)
Percentage
of
Super
Senior
AAA
securities
which
are
shorter
duration
tranches
Focus on Super Senior AAA rated tranches
99% rated A or better; 91% rated AAA
AAA
AA
A
BBB
BB and Below
Total
Fair Value
7,212
$
494
$
199
$
24
$
37
$
7,966
$
8,550
$
6,589
$
Super Senior AAA Total
60.2%
Super
Senior
AAA
Shorter
Duration
Tranches
(2) |
 Limited Exposure to NAIC 3 –
6
11
Financial Strength Symposium 5.24.2012
$5,951
$1,938
$910
$221
(1)
As of March 31, 2012 at Amortized Cost. Reflects equivalent ratings for investments of
the International Insurance operations. FSB General Account
(1)
Fixed Maturity Securities
($ millions)
$0
$1,000
$2,000
$3,000
$4,000
$5,000
$6,000
NAIC
3
NAIC
4
NAIC
5
NAIC
6
58%
63%
41%
48%
42%
37%
59%
52%
-
-
-
-
Private Fixed Maturities: $3,876 million
Public Fixed Maturities: $5,144 million |
 Investment Portfolio Yield
12
Financial Strength Symposium 5.24.2012
Strong Private Placement and Commercial Mortgage production by our investment
staff over the past few years has helped to lessen the decline in portfolio yield due
to lower reinvestment rates
•
Our investment staff has originated the majority of our annual private placement
originations through direct borrower relationships
o
Opportunity for better terms, including covenants and call protection, and to take
advantage of innovative deal structures
•
Within our domestic portfolios, we maintain a private fixed income portfolio that
is larger than the industry average as a percentage of total fixed income
holdings Many of our competitors supplement their Private Placement
originations using the secondary 144A market |
 Fixed
Maturities and Commercial Mortgage Yields 13
Financial Strength Symposium 5.24.2012
FSB
General
Account,
ex.
Japanese
Operations
(1)
FSB
General
Account
(1)
(1)
Excludes realized investment gains/(losses) and non-hedge accounting derivative
results. Yields for interim periods are annualized, and exclude investment income on assets other than those included in invested assets.
Yields for commercial mortgages are based on quarterly average carrying values. Yields
for fixed maturities are based on amortized cost, and are calculated net of liabilities and rebate expenses corresponding to securities
lending activity. Commercial mortgage yields include investment income related to
commercial loans that support insurance liabilities for which the investment results generally accrue to contract holders.
(2)
Yields for 1Q 2011 are weighted for one month of income and assets related to the Star
and Edison Businesses. (2)
5.64%
5.70%
5.78%
5.31%
4.62%
4.27%
4.02%
3.74%
0.0%
1.0%
2.0%
3.0%
4.0%
5.0%
6.0%
7.0%
1Q 2009
1Q 2010
1Q 2011
1Q 2012
5.77%
5.95%
6.16%
5.69%
5.68%
5.46%
5.38%
5.27%
0.0%
1.0%
2.0%
3.0%
4.0%
5.0%
6.0%
7.0%
1Q 2009
1Q 2010
1Q 2011
1Q 2012
Commercial Mortgages
Fixed Maturities
Commercial Mortgages
Fixed Maturities |
 Key
Takeaways 14
Financial Strength Symposium 5.24.2012
High quality, well diversified portfolio
Continue to prefer to underwrite and manage our credit risk directly
•
High priority on private asset classes, both Corporates and Mortgages
•
Disciplined approach to Commercial Mortgage Loan underwriting and
diversification Current High Yield asset mix is based on:
•
Experience in private sector
•
Commitment to managing credit risk directly
Minimal sovereign exposure in Eurozone nations
Our CMBS portfolio is well constructed
While low reinvestment rates have put downward pressure on our portfolio yield,
strong Private Placement and Commercial Mortgage production by our investment
staff over the past several years has helped to lessen the decline
|
 Approach to Capital Management
Rich Carbone
Executive Vice President
Chief Financial Officer
Prudential Financial, Inc. |
 2
Financial Strength Symposium 5.24.2012
Superior Value
Proposition for
Customers,
Creditors &
Investors
Delivering Superior Value
Appropriate
ROE
Strong
Ratings
Financial
Strength |
 Key
Measures of Financial Strength 3
Financial Strength Symposium 5.24.2012
•
Excess Liquidity
•
Appropriate Leverage
•
Adequate Coverage
•
Strong Regulatory Ratios
–
Risk Based Capital
–
Solvency Margin
•
Financial Flexibility
“AA”
Rating |
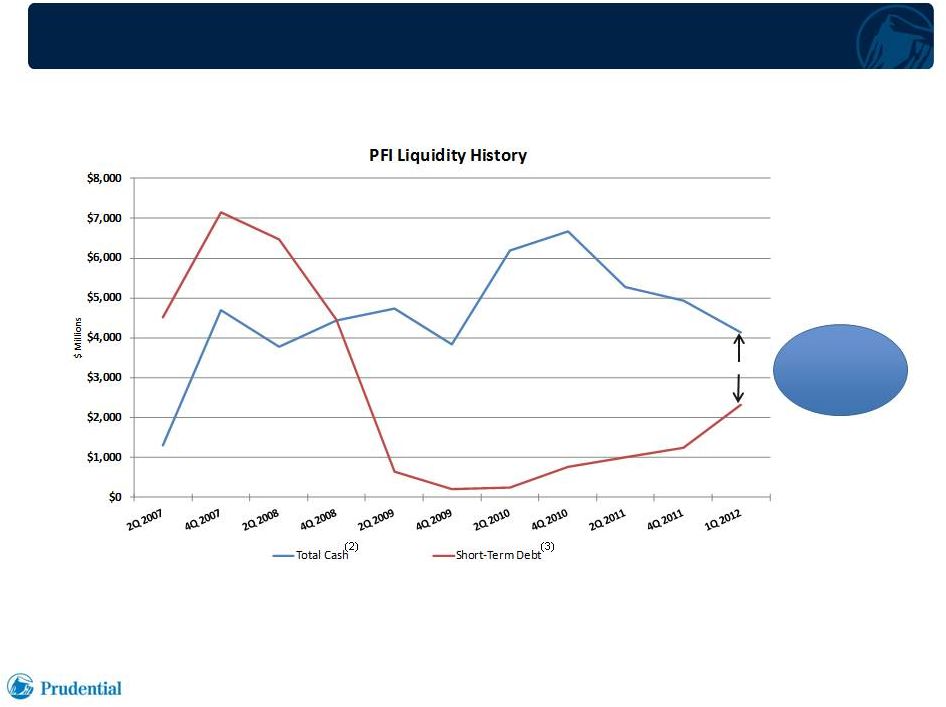 Holding Company Liquidity Profile
4
Financial Strength Symposium 5.24.2012
1)
The Finance Committee of the Board of Directors approved increasing the targeted
cash cushion to $1.2 billion on May 8, 2012. 2)
PFI cash, cash equivalents and short-term investments.
3)
Includes current portion of long-term debt.
$1.8B
Targeted
Cash
Cushion
(1)
$1.2B |
 ROE Target of
13%-14% in 2013
13%-14% in 2013
(1)
(1)
Key Drivers of ROE
5
Financial Strength Symposium 5.24.2012
Organic
Growth
from
Superior
Business
Mix
Synergies
from
Star &
Edison
Capital
Management
(1)
For the Financial Services Businesses (“FSB”)
|
 Superior Business Mix Drives Organic Growth
6
Financial Strength Symposium 5.24.2012
Organic
Growth from
Superior
Business Mix
Key Considerations:
Credible diversification of risks
High value added business models
Fit with proven execution and risk
management capabilities
•
Solid cash flows and ROE potential
•
•
• |
 Opportunities for Strong Organic Growth
7
Financial Strength Symposium 5.24.2012
Business Unit
% of 2011
Attributed Equity
(1)
% of 2011
Pre-Tax AOI
(2)
2013 ROE
Potential
(3)
International
Insurance
43%
48%
~18% -
19%
Annuities,
Retirement &
Asset Management
44%
38%
~14% -
15%
Individual Life &
Group Insurance
13%
14%
~11% –
12%
1)
Attributed equity of the FSB excluding accumulated other comprehensive income;
excludes Corporate & Other operations; at December 31, 2011. 2)
Excludes Corporate & Other operations.
3)
Business unit ROE’s are unlevered and are based on FSB effective tax rate
applicable to adjusted operating income and the attributed equity of each
business unit. |
 Capital Management Philosophy
8
Financial Strength Symposium 5.24.2012
Adequate capital &
excess liquidity in
stress
Appropriate financial
leverage
Organic Growth
Opportunistic M&A
Stable dividend payout
ratio
Share repurchases
Protect
Downside
Deploy Capital
for Growth
Distribute to
Shareholders |
 Capital and Liquidity Management
Robert Falzon
Senior Vice President
Treasurer
Prudential Financial, Inc. |
 Financial Strength Symposium 5.24.2012
Approach to Capital and Liquidity Management
2
Financial Strength Symposium 5.24.2012
Capital Protection
Framework
Liquidity
Diverse sources result in significant
financial flexibility
Provides for competitive levels of
capital under stress
Financial Strength
AA standards for capital, leverage
and liquidity |
 Regulatory Capital Ratios
3
Financial Strength Symposium 5.24.2012
Risk Based Capital Ratio (“RBC”)
(1)
Target
December 31, 2011
Prudential Insurance
400%
491%
1)
The
inclusion
of
RBC
measures
is
intended
solely
for
the
information
of
investors
and
is
not
intended
for
the
purpose
of
ranking
any
insurance
company
or
for
use
in
connection with any marketing, advertising or promotional activities.
2)
Based on Japanese statutory accounting and risk measurement standards applicable to
regulatory filings for fiscal year ended March 31, 2012. 3)
Reflects
inclusion
of
Star
and
Edison
entities
which
were
merged
into
Gibraltar
Life
Insurance
Company,
Ltd.
effective
January
1,
2012.
Solvency Margin Ratio -
“New Method”
Target
Estimated as of
March 31, 2012
Prudential
of
Japan
(2)
600 -
700%
Over 700%
Gibraltar Life
(2)(3)
600 -
700%
Over 700% |
 4
Financial Strength Symposium 5.24.2012
1)
Required
Capital
represents
the
amount
of
GAAP
capital
necessary
to
support
business
risk
based
on
AA
rating
targets
in
the
insurance
operating
entities.
2)
Excludes total accumulated other comprehensive income.
3)
Based on targeted Risk Based Capital (“RBC”) ratio of 400% for Prudential
Insurance and equivalent levels of capital at other insurance operating entities.
December 31, 2011
$ in Billions
Required Capital
(1)
~$34.3 -
$34.8
Attributed Equity
(2)
$27.6
Capital Debt and Hybrids Outstanding
$11.2
Total Capital Outstanding
$38.8
Total
Available
On
Balance
Sheet
Capital
(3)
~$4.0 -
$4.5
Estimated “Readily Deployable”
Capital
~$2.0 -
$2.25
On Balance Sheet Capital
Financial Services Businesses (“FSB”) |
 Key
Leverage Metrics - FSB
5
Financial Strength Symposium 5.24.2012
Ratio
Target
Actual
Total Leverage
< 40%
43.5%
(1)
Fixed Charge Coverage Ratio
> 2x
2.4x
(2)
1)
PFI debt divided by PFI debt plus equity. Calculated as of March 31,
2012. Reflects the retrospective adoption of amended accounting guidance for deferred policy
acquisition costs effective January 1, 2012, which reduced equity by $2.8
billion. 2)
PFI cash sources, net of shareholder dividend divided by PFI fixed expenses.
Calculated as of December 31, 2011. |
 Cash
Flows
from
Subsidiaries
(1)
6
Financial Strength Symposium 5.24.2012
1)
Reflects dividends and returns of capital to PFI.
75%
$3.2
$3.3
$1.3
$4.0
$3.2
$0.0
$0.5
$1.0
$1.5
$2.5
$3.0
$3.5
$4.0
$4.5
2007
2008
2009
2010
2011
Prudential Insurance
International
Asset Management
Other
$2.0 |
 Holding Company Liquidity
7
Financial Strength Symposium 5.24.2012
1)
(2)
Targeted Cash Cushion
$1.2
Targeted Cash Cushion
$1.2
$1.8
$7.2
$0.2
$3.8
$1.4
$-
$1.0
$2.0
$3.0
$4.0
$5.0
$6.0
$7.0
$8.0
$9.0
Net Cash
Additional Commercial Paper
Capacity
Committed Credit Lines
Internal Sources
Total Liquidity Resources
Diverse Sources of Alternate Liquidity
As of March 31, 2012
($ in Billions)
$3.0
$8.4
(3)
(4)
(1)
PFI cash, cash equivalents and short-term investments, less net short-term intercompany
borrowings, commercial paper and tax sharing receipts.
Based on estimated incremental market capacity. $283 million of Prudential Financial, Inc.
commercial paper was outstanding as of March 31, 2012.
$1.75 billion shared with Prudential Funding, LLC (“PFLLC”). Primarily includes Retail Notes
and Enterprise Liquidity Account, among other items. 2)
3)
4) |
 Prudential Insurance Liquidity
8
Financial Strength Symposium 5.24.2012
(2)
(4)
•
In addition, PICA has substantial available liquid assets for securities
lending (3)
(1)
$13.3
$3.9
$1.8
$2.0
Cash
Additional FHLBNY Capacity
Committed Credit Lines
Additional Commercial Paper
Capacity
Total Liquidity Resources
Diverse Sources of Alternate
Liquidity
As of March 31, 2012
($ in Billions)
$-
$2
$4
$6
$8
$10
$12
$14
$5.6
Represents cash, cash equivalents and short-term investments for FSB and Closed Block Business on
a statutory basis as of March 31, 2012.
$2.4 billion of capacity from the Federal Home Loan Bank of New York was used as of March 31, 2012 in
the form of advances and funding agreements. Borrowings are subject to the availability of
qualifying assets at Prudential Insurance.
Shared with PFI.
Based on estimated incremental market capacity. $1.0 billion of PFLLC commercial paper was
outstanding as of March 31, 2012.
1)
2)
3)
4) |
 Capital Protection Framework
9
Financial Strength Symposium 5.24.2012
On Balance
Sheet Capital
Capacity
Derivatives
Reinsurance
Contingent
Capital
Our Toolbox
Equity Market
Decline
Interest Rate
Shock
Credit Shock
Currency Shock
Stress Parameters |
 Dynamic Capital Protection
10
Financial Strength Symposium 5.24.2012
Cyclical
Less
Severe
Most
Severe
High
Med
Low
Worst in
History
Modest
Severe
Severity of Shocks
Illustrative |
 Summary
•
Financial Strength is the foundation for commercial success and informs
our views regarding:
–
Appropriate ROE target
–
Deployment of capital
•
We manage capital to AA standards and provide for adequate protection
under stress.
•
We rely on diverse sources of liquidity to ensure financial flexibility.
11
Financial Strength Symposium 5.24.2012 |