EX-99.1
Published on
 Prudential Financial, Inc.
Investor Day
June 18, 2013
Exhibit 99.1 |
 Forward-Looking Statements
2
Investor Day 6.18.2013
Certain of the statements included in this presentation constitute forward-looking statements
within the meaning of the U. S. Private Securities Litigation Reform Act of 1995. Words such as
“expects,” “believes,” “anticipates,” “includes,” “plans,” “assumes,” “estimates,” “projects,” “intends,”
“should,” “will,” “shall,” or variations of such words are generally
part of forward-looking statements. Forward-looking statements are made based on
management’s current expectations and beliefs concerning future developments and their potential effects upon Prudential Financial, Inc. and
its subsidiaries. There can be no assurance that future developments affecting Prudential
Financial, Inc. and its subsidiaries will be those anticipated by management. These
forward-looking statements are not a guarantee of future performance and involve risks and uncertainties, and
there are certain important factors that could cause actual results to differ, possibly materially,
from expectations or estimates reflected in such forward-looking statements, including,
among others: (1) general economic, market and political conditions, including the performance and
fluctuations of fixed income, equity, real estate and other financial markets; (2) the availability
and cost of additional debt or equity capital or external financing for our operations; (3)
interest rate fluctuations or prolonged periods of low interest rates; (4) the degree to which we choose not
to hedge risks, or the potential ineffectiveness or insufficiency of hedging or risk management
strategies we do implement, with regard to variable annuity or other product guarantees; (5)
any inability to access our credit facilities; (6) reestimates of our reserves for future policy benefits and
claims; (7) differences between actual experience regarding mortality, longevity, morbidity,
persistency, surrender experience, interest rates or market returns and the assumptions we use
in pricing our products, establishing liabilities and reserves or for other purposes; (8) changes in our
assumptions related to deferred policy acquisition costs, value of business acquired or goodwill; (9)
changes in assumptions for retirement expense; (10) changes in our financial strength or credit
ratings; (11) statutory reserve requirements associated with term and universal life insurance
policies under Regulation XXX and Guideline AXXX; (12) investment losses, defaults and counterparty non-performance;
(13) competition in our product lines and for personnel; (14) difficulties in marketing and
distributing products through current or future distribution channels; (15) changes in tax law;
(16) economic, political, currency and other risks relating to our international operations; (17) fluctuations in
foreign currency exchange rates and foreign securities markets; (18) regulatory or legislative
changes, including the Dodd-Frank Wall Street Reform and Consumer Protection Act; (19)
inability to protect our intellectual property rights or claims of infringement of the intellectual property
rights of others; (20) adverse determinations in litigation or regulatory matters and our exposure to
contingent liabilities, including in connection with our divestiture or winding down of
businesses; (21) domestic or international military actions, natural or man-made disasters including terrorist
activities or pandemic disease, or other events resulting in catastrophic loss of life; (22)
ineffectiveness of risk management policies and procedures in identifying, monitoring and
managing risks; (23) effects of acquisitions, divestitures and restructurings; (24) interruption in
telecommunication, information technology or other operational systems or failure to maintain the
security, confidentiality or privacy of sensitive data on such systems; (25) changes in
statutory or U.S. GAAP accounting principles, practices or policies; (26) Prudential Financial, Inc.’s primary
reliance, as a holding company, on dividends or distributions from its subsidiaries to meet debt
payment obligations and the ability of the subsidiaries to pay such dividends or distributions
in light of our ratings objectives and/or applicable regulatory restrictions; and (27) risks due to
the lack of legal separation between our Financial Services Businesses and our Closed Block Business.
Prudential Financial, Inc. does not intend, and is under no obligation, to update any particular
forward-looking statement included in this presentation. See “Risk Factors” included in Prudential Financial, Inc.’s Annual Report on
Form 10-K for the year ended December 31, 2012 for discussion of certain risks relating to
our businesses and investment in our securities. Prudential Financial, Inc. of the United States is not affiliated with Prudential PLC which is
headquartered in the United Kingdom. |
 Non–GAAP Measures
3
Investor Day 6.18.2013
This presentation includes references to “adjusted operating income.” Adjusted operating
income is a non-GAAP measure of performance of our Financial Services Businesses.
Adjusted operating income excludes “Realized investment gains (losses), net,” as adjusted, and related charges and adjustments. A
significant element of realized investment gains and losses are impairments and credit-related and
interest rate-related gains and losses. Impairments and losses from sales of
credit-impaired securities, the timing of which depends largely on market credit cycles, can vary considerably across periods. The timing
of other sales that would result in gains or losses, such as interest rate-related gains or
losses, is largely subject to our discretion and influenced by market opportunities as well as
our tax and capital profile.
Realized investment gains (losses) within certain of our businesses for which such gains (losses) are
a principal source of earnings, and those associated with terminating hedges of foreign
currency earnings and current period yield adjustments are included in adjusted operating income. Adjusted operating
income excludes realized investment gains and losses from products that contain embedded derivatives,
and from associated derivative portfolios that are part of a hedging program related to the
risk of those products. Adjusted operating income also excludes gains and losses from changes in value of certain
assets and liabilities relating to foreign currency exchange movements that have been economically
hedged or considered part of our capital funding strategies for our international
subsidiaries, as well as gains and losses on certain investments that are classified as other trading account assets.
Adjusted operating income also excludes investment gains and losses on trading account assets
supporting insurance liabilities and changes in experience- rated contractholder liabilities
due to asset value changes, because these recorded changes in asset and liability values are expected to ultimately accrue to
contractholders. Trends in the underlying profitability of our businesses can be more clearly
identified without the fluctuating effects of these transactions. In addition, adjusted
operating income excludes the results of divested businesses, which are not relevant to our ongoing operations. Discontinued operations,
which is presented as a separate component of net income under GAAP, is also excluded from adjusted
operating income. We believe that the presentation of adjusted operating income as we measure it for management
purposes enhances understanding of the results of operations of the Financial Services
Businesses by highlighting the results from ongoing operations and the underlying profitability of our businesses.
However, adjusted operating income is not a substitute for income determined in accordance with GAAP,
and the adjustments made to derive adjusted operating income are important to an understanding
of our overall results of operations. Return on equity (“ROE”) based on adjusted operating income is determined by dividing
adjusted operating income after-tax (giving effect to the direct equity adjustment for
earnings per share calculation) by average attributed equity for the Financial Services Businesses excluding accumulated other
comprehensive income.
Our expectations of ROE potential are based on after-tax adjusted operating income. Because we do
not predict future realized investment gains / losses or recorded changes in asset and
liability values that are expected to ultimately accrue to contractholders, we cannot provide a measure of our ROE
expectations based on income from continuing operations of the Financial Services Businesses, which is
the GAAP measure most comparable to adjusted operating income.
The information referred to above, as well as the risks of our businesses described in our Annual
Report on Form 10-K for the year ended December 31, 2012, should be considered by readers
when reviewing forward-looking statements contained in this presentation. Additional historical information relating to
our financial performance is located on our Web site at
www.investor.prudential.com. |
 Reconciliation for Individual Annuities Pre-Tax Adjusted
Operating Income excluding Indicated Disclosed Items
4
2007
2008
2009
2010
2011
2012
Individual Annuities pre-tax adjusted operating income
652
$
(955)
$
672
$
950
$
662
$
1,039
$
Reconciling items:
Unlockings and experience true-ups
(1)
80
(1,320)
359
336
(222)
81
Write off of Allstate goodwill
-
(97)
-
-
-
-
Reinsurance contract refinement
(2)
-
-
-
25
-
-
Expenses estimated in excess of baseline level
-
-
-
-
-
(17)
Impairment of capitalized software
-
-
-
-
-
(9)
Sub-total
80
(1,417)
359
361
(222)
55
Individual Annuities pre-tax adjusted operating income
excluding disclosed items indicated above
572
$
462
$
313
$
589
$
884
$
984
$
1) included adjustments of amortization of deferred policy acquisition costs and
other amortization items, and reserves for guaranteed minimum death and
income benefits 2) represents refinements based on a review and settlement of
reinsurance contracts related to acquired business |
 Reconciliation for International Insurance Pre-Tax Adjusted
Operating Income excluding Indicated Disclosed Items
5
2008
2009
2010
2011
2012
International Insurance pre-tax adjusted operating income
1,581
$
1,651
$
1,887
$
2,263
$
2,704
$
Reconciling items:
China Pacific gains
-
-
66
237
60
Star / Edison transaction and integration costs
-
-
-
(213)
(138)
Sub-total
-
-
66
24
(78)
International Insurance pre-tax adjusted operating income excluding
disclosed items indicated above
1,581
$
1,651
$
1,821
$
2,239
$
2,782
$ |
 John
Strangfeld Chairman and CEO
Prudential Financial, Inc. |
 2
Investor Day 6.18.2013
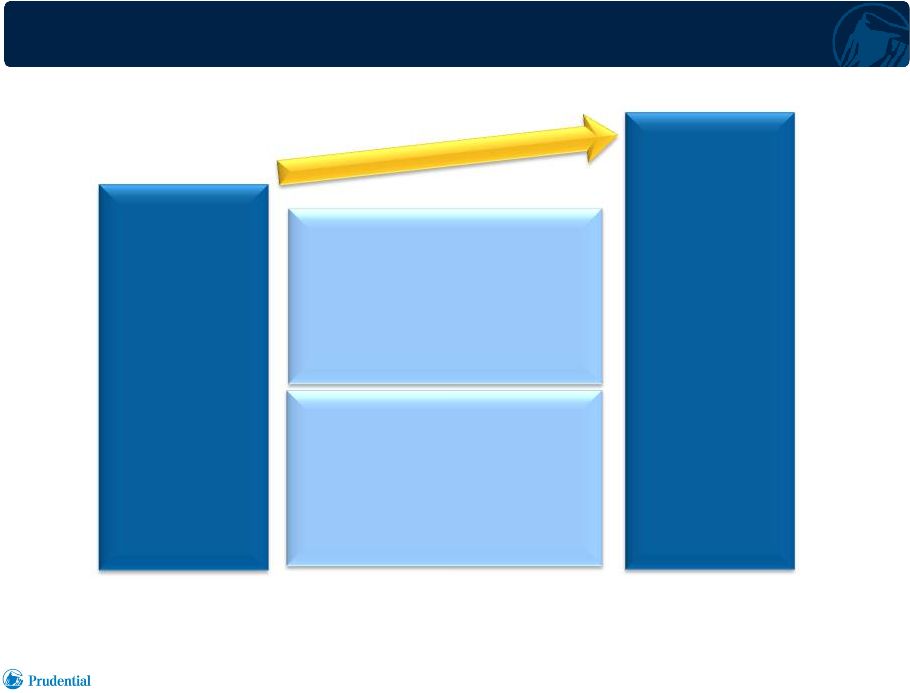
Roadmap to Sustainable and Appropriate ROE
(1)
2011
BASELINE
(2)
11%
2013
TARGET
13-14%
CAPITAL DEPLOYMENT
BUSINESS ROE EXPANSION
1)
For
Financial
Services
Businesses
(FSB).
Based
on
average
attributed
equity
excluding
total
accumulated
other
comprehensive
income.
2) Represents Return on Equity (ROE) for the FSB excluding market driven and
discrete items disclosed in the Company’s earnings press releases. Reflects
the adoption of amended accounting guidance for deferred policy acquisition costs
effective January 1, 2012, and the discretionary change in accounting
principle related to the Company's pension plans.
•
Higher Margins
•
Business Growth
•
Star/Edison Integration
•
PRT
•
Hartford
•
Shareholder Distributions |
 3
Investor Day 6.18.2013
Prudential’s Investor Value Proposition
SUPERIOR
PERFORMANCE
TALENT
CAPITAL
MANAGEMENT
PORTFOLIO OF
BUSINESSES
QUALITY
BUSINESSES
•
Well Diversified
•
Life, Retirement,
Asset Management
•
US & International
•
Balance of Risks
•
Financial Strength
•
Disciplined Balance of:
Organic Growth
M&A
Return to Shareholders
•
Proven Acquisition &
Integration Track Record
•
Strategic Imperative
•
Quality, Depth &
Diversity
•
Culture of:
Collaboration
Innovation
Execution
•
Market Leader in
Chosen Markets
•
Premium Brand
•
Strong Fundamentals |
 Mark
Grier Vice
Chairman
Prudential Financial, Inc. |
 Prudential’s U.S. Businesses
Charles Lowrey
Charles Lowrey
Executive Vice President and
Executive Vice President and
Chief Operating Officer, U.S.
Chief Operating Officer, U.S. |
 Agenda
2
Investor Day 6.18.2013
•
Executive Summary
•
Overall U.S. Strategy
•
Review of U.S. Businesses
•
Conclusion |
 •
Our U.S. businesses are positioned to benefit from a cyclical recovery, as well as
from favorable secular growth trends, and to achieve appropriate
returns –
Retirement
–
Pension plan de-risking
–
Longevity
–
Individual asset accumulation
•
Our primary focus is on profitable growth rather than on market share
–
Expected returns drive decisions
–
Sales volume is an outcome
•
We have taken steps to reduce volatility
–
Significantly scaled back Asset Management’s strategic investing
–
Modified variable annuity benefits
•
We are pursuing opportunities that capitalize on our combined set of business
capabilities –
Pension Risk Transfer solutions
–
Other platforms for asset management flows
3
Executive Summary
Investor Day 6.18.2013 |
   Agenda
4
•
Executive Summary
•
Overall U.S. Strategy
•
Review of U.S. Businesses
•
Conclusion
Investor Day 6.18.2013 |
 There
are Three Elements to our U.S. Strategy •
Consistently focus on execution
–
Manage profitability through pricing discipline and operational efficiency
–
Carefully manage distribution systems
•
Within each business, identify and pursue additional profitable growth
opportunities –
Focus
on
secular
growth
trends
within
broader
set
of
addressable
markets
•
Enhance our competitive advantage by leveraging the distinctive combination of
capabilities across our businesses
–
Product capabilities with respect to Insurance, Asset Management, and
Retirement and Annuities
–
Capital and Risk Management capabilities
5
Investor Day 6.18.2013 |
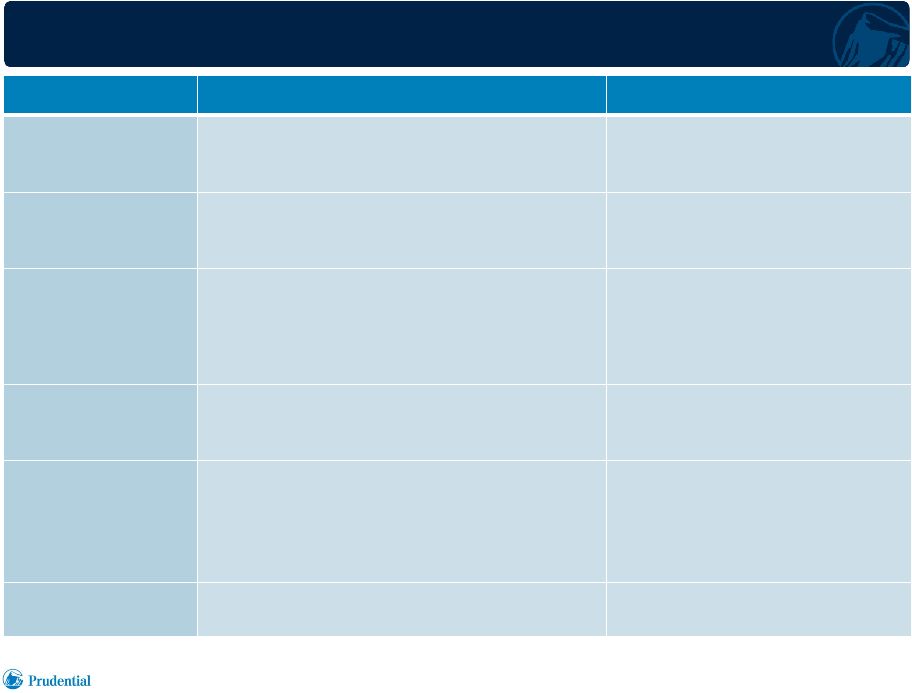 Trends
Opportunities
Opportunities
Prudential Solutions
Prudential Solutions
Retirement Wave
•
10,000 retirees every day through 2030
•
Retirees and near-retirees control vast
majority of investable assets
•
Outcome-oriented products
•
Retirement income
Retirement Savings
Adequacy Gap
•
Generations X and Y need to increase
retirement savings
•
Innovative solutions to drive
higher savings, both in and out of
retirement plans
Changing U.S.
Retirement System
•
Fundamental change in how corporate
defined benefit (DB) plans are managed
•
Increased reliance on defined contribution
(DC) plans
•
Liability-driven investing
•
Pension Risk Transfer
•
Stable Value
•
DB-like outcomes
Longevity
•
A 65 year-old has a 26% chance of living to
90, and an 11% chance of living to 100
•
Retirement income
•
Living benefits
•
Longevity insurance
Investment
Strategies
•
Shift from focus on relative benchmark
returns to solutions that offer guarantees,
risk control, upside participation
•
Institutional and retail outcome-
oriented solutions that leverage
asset management, risk
management, and insurance
capabilities
Collateral Effects of
Healthcare Reform
•
Employers are revisiting overall employee
benefits strategy
•
Group voluntary products
Several Trends are Creating Opportunities
Across our Markets
6
Investor Day 6.18.2013 |
 Our
Businesses are Positioned to Capitalize on Market Opportunities
•
We like our business mix
–
Divested non-core businesses
–
Discontinued sales of non-core products
–
Increased scale and capabilities in insurance through acquisition
–
Expanded our retirement presence through Investment Only Stable Value
and Pension Risk Transfer
•
Our portfolio of businesses provides diversification of risk exposure
–
Equity markets
–
Interest rate levels
–
Mortality and longevity
•
We serve a broad set of institutional and retail customers through multiple
distribution channels
–
Cross-business management of key client, distribution, and consultant
relationships 7
Investor Day 6.18.2013 |
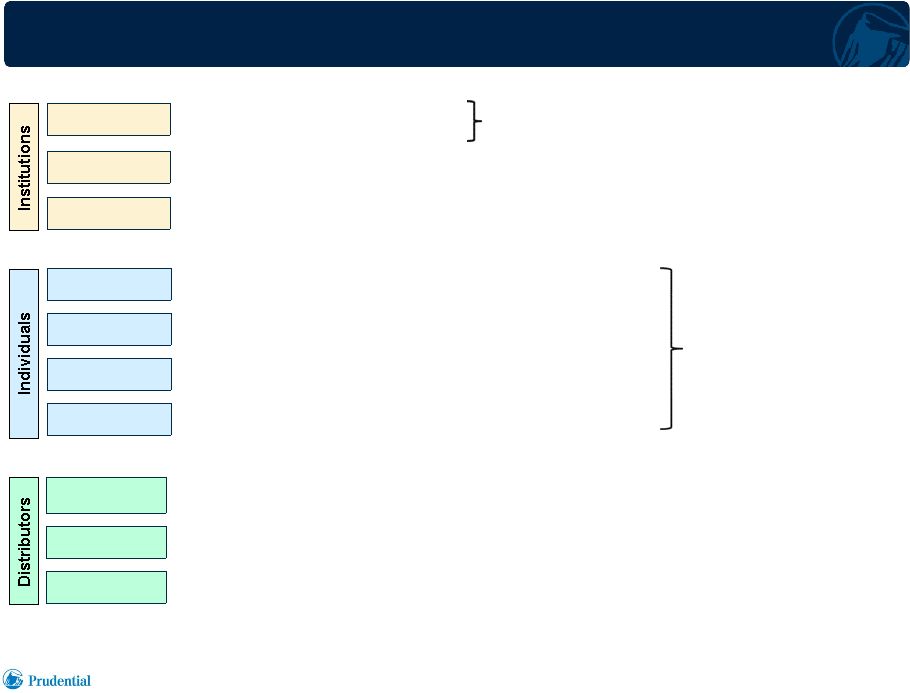 1,500
Asset
Management
clients
(1)
7,900
Retirement DB and DC plans
22,500
Group institutional clients
We have an Extensive Presence across the
Institutional and Retail Marketplace
8
Numbers reflect rounding
1)
As of 3/31/13. Other data shown is as of 12/31/12.
2)
Third party financial professionals counted on a product-by-product
basis. 3.8
million
DB
and
DC
participants
and
annuitants
(1)
28 million
Individuals covered by group insurance contracts
7 million
Individual
Life
policyholders
(1)
1.3 million
Individual
Annuity
contract
holders
(1)
120,000
Third
party
financial
professionals
selling
our
products
(2)
2,700
Prudential
agents
(1)
500
Prudential
wholesalers
(1)
140 of Fortune 500 companies
78 of largest 100 U.S. retirement plans
Over 6 million retiree and
near-retiree customers
Investor Day 6.18.2013 |
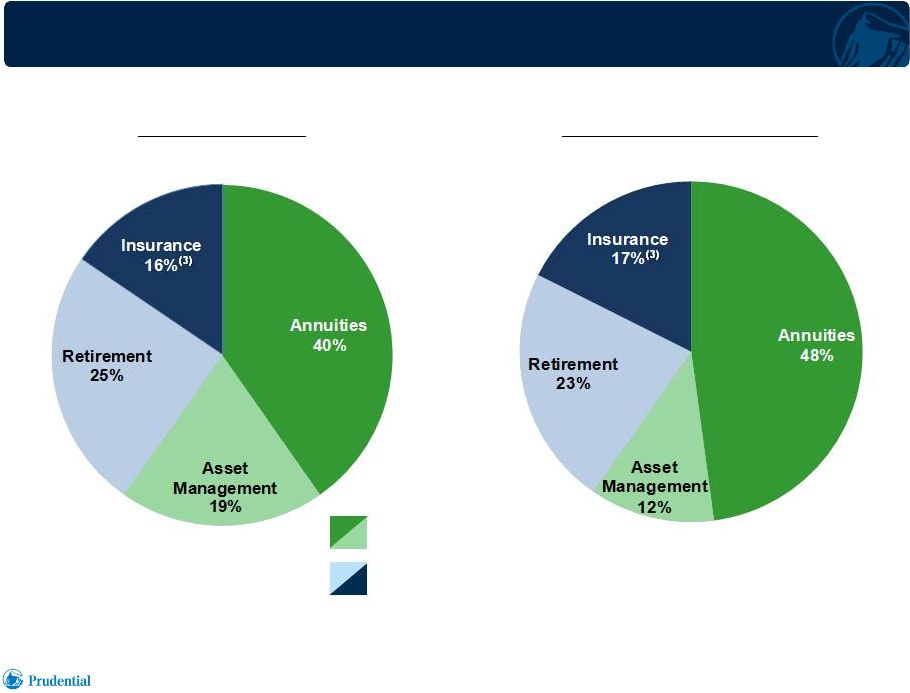 We
Benefit from a Diversified Business Mix Less market sensitive businesses:
Retirement, Insurance
More market sensitive businesses:
Annuities, Asset Management
2012
Pre-Tax
AOI
(1)
$2,580 million
1Q13
EOP
Attributed
Equity
(2)
$16.8 billion
1)
Pre-tax Adjusted Operating Income (AOI) of the U.S. Businesses.
2)
Attributed equity of the U.S. Businesses as of 3/31/13, excluding accumulated other
comprehensive income. 3)
Represents the U.S. Individual Life and Group Insurance Division.
Investor Day 6.18.2013
9 |
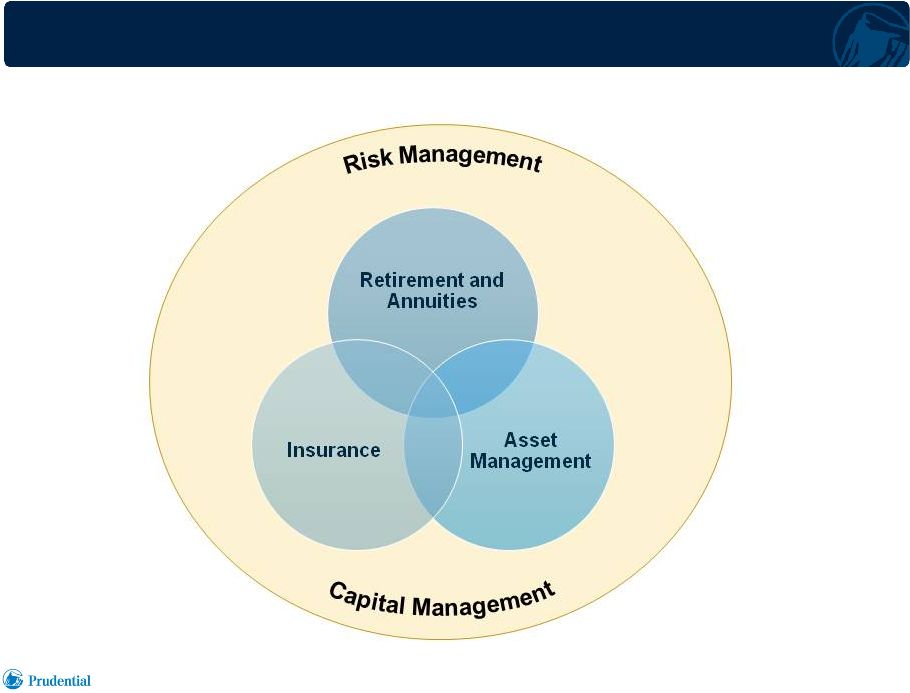 Our
Differentiated Product Capabilities are Wrapped in Strong Risk and Capital
Management Capabilities Investor Day 6.18.2013
10 |
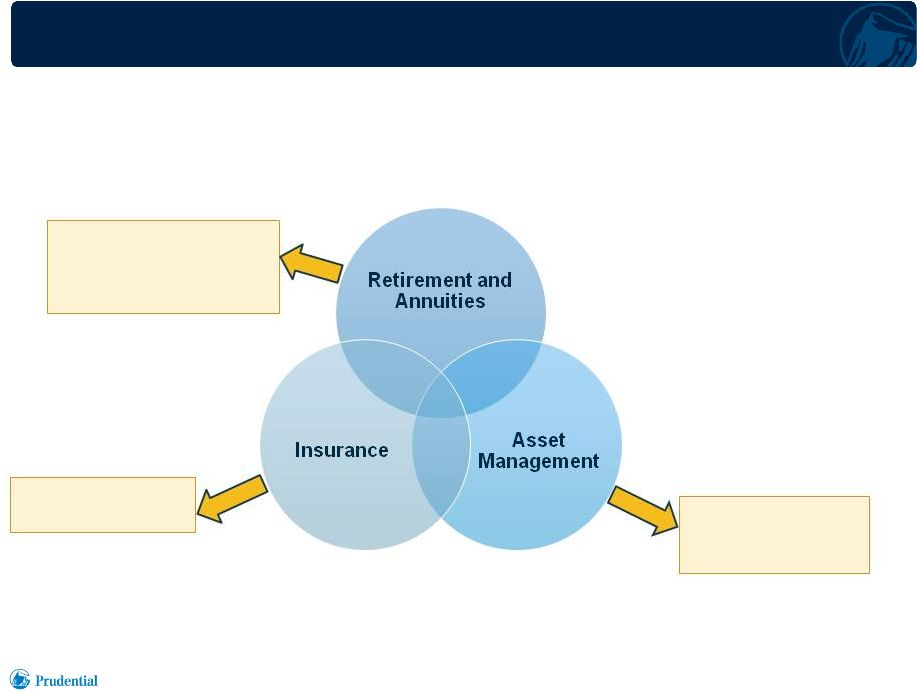 With
these Product Capabilities, We Provide a Diverse Set of Solutions to
Individuals and Institutions Retail Funds
and Institutional
Solutions
Protection and
Savings Solutions
Asset Accumulation
and Income Solutions
Risk Transfer Solutions
Investor Day 6.18.2013
11 |
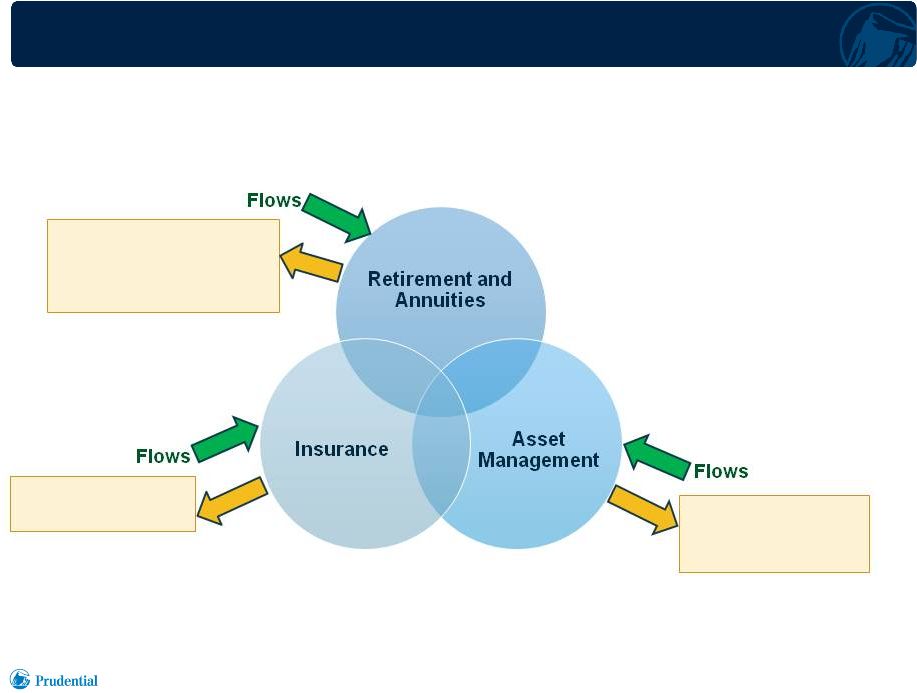 12
These Solutions Generate a Broad Set of Customer Flows
Retail Funds
and Institutional
Solutions
Protection and
Savings Solutions
Asset Accumulation
and Income Solutions
Risk Transfer Solutions
Investor Day 6.18.2013 |
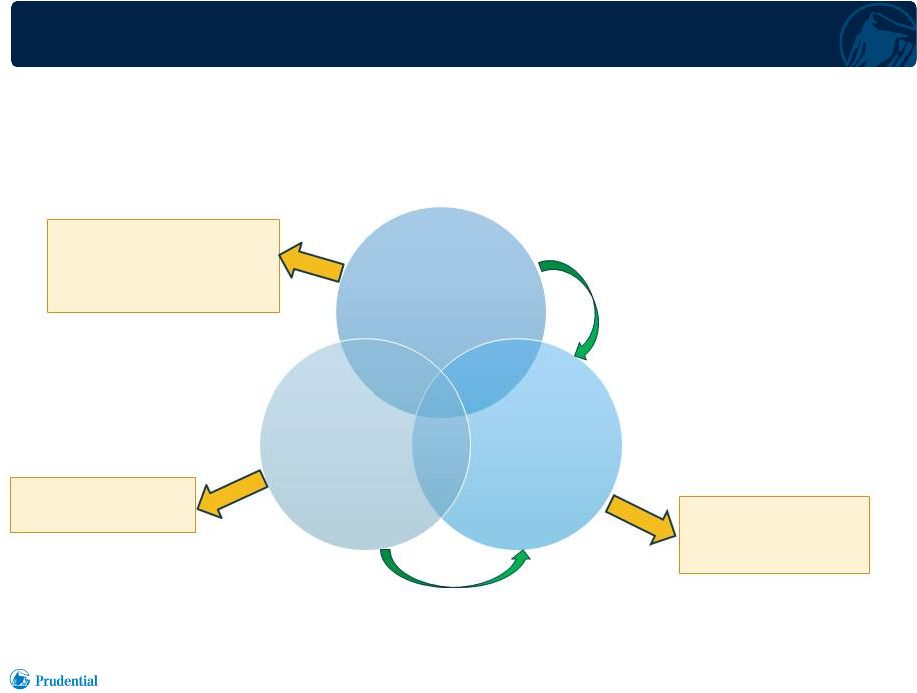 13
Our Product Capabilities also Create Additional
Asset Management Opportunities
Retail Funds
and Institutional
Solutions
Protection and
Savings Solutions
Asset Accumulation
and Income Solutions
Risk Transfer Solutions
Investor Day 6.18.2013
Proprietary
Flows
Proprietary
Flows
Retirement and
Annuities
Insurance
Asset
Management |
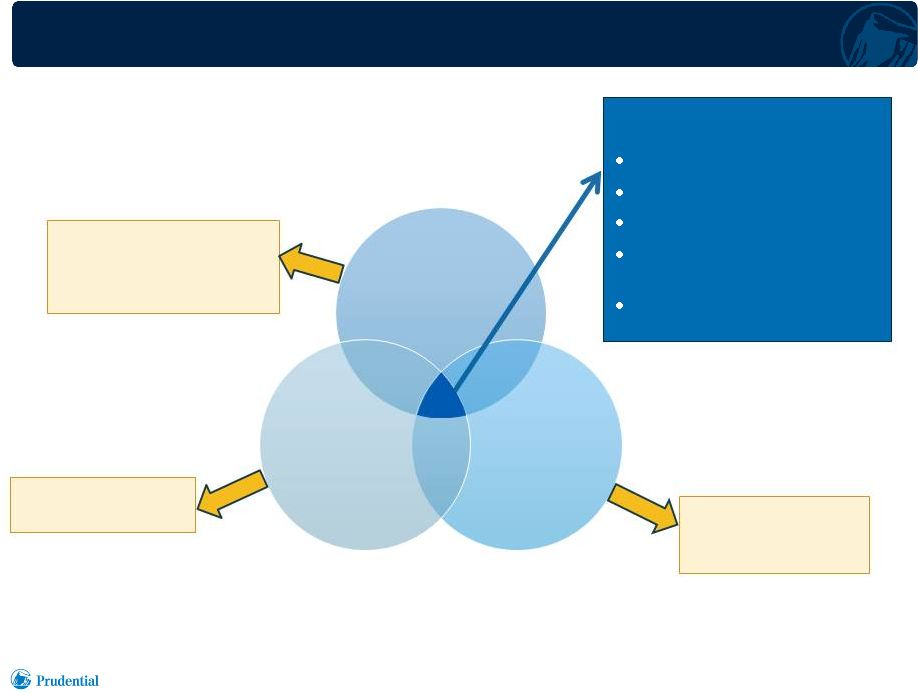 Our
Capabilities are Mutually Supportive and, When Combined, Address a Broader Set
of Customer Needs Retail Funds
and Institutional
Solutions
Protection and
Savings Solutions
Asset Accumulation
and Income Solutions
Risk Transfer Solutions
Investor Day 6.18.2013
14
Solutions leveraging our
combined capabilities:
Pension
Risk
Transfer
Target
Date
Solutions
Income
Solutions
Outcome-oriented
Investment
Solutions
Group/Individual
Life
Combination
Products
Retirement and
Annuities
Insurance
Asset
Management |
 As
an Example, Pension Risk Transfer Draws Upon Our Full Set of Combined
Capabilities 15
•
Rising need for de-risking solutions for U.S. plan sponsors
–
Stricter pension funding rules
–
Shift from DB to DC plans
–
Increasing accounting transparency
–
Asset risk and longevity risk awareness
•
Prudential is exceptionally well positioned by virtue of its:
•
Prudential emerged as the U.S. Pension Risk Transfer market
leader with two industry-shaping transactions in 2012
Investor Day 6.18.2013
–
Investment management skills
–
Risk management skills
–
Actuarial capabilities
–
Strong balance sheet
–
Respected brand
–
Retiree client service platform
–
Industry-leading talent
–
General Motors: $25 billion group annuity contract; 110,000 retirees
–
Verizon: $8 billion group annuity contract; 41,000 retirees
Catalysts
Unique
Capabilities
World-Class
Counterparties |
 Agenda
Investor Day 6.18.2013
16
•
Executive Summary
•
Overall U.S. Strategy
•
Review of U.S. Businesses
•
Conclusion |
 Annuities
•
Market leading position across multiple distribution channels
•
Disciplined approach to managing profitability and exposure
–
Pricing discipline to ensure we meet our hurdle rates
–
Sales discipline to ensure appropriate overall earnings mix
•
Several product changes and introductions within the last year to reduce risk and
volatility •
Source of proprietary investment management opportunities
•
Additional profitable growth opportunities
–
New
products
to
meet
market
demand
for
a
broad
set
of
retirement
income
solutions
Investor Day 6.18.2013
17 |
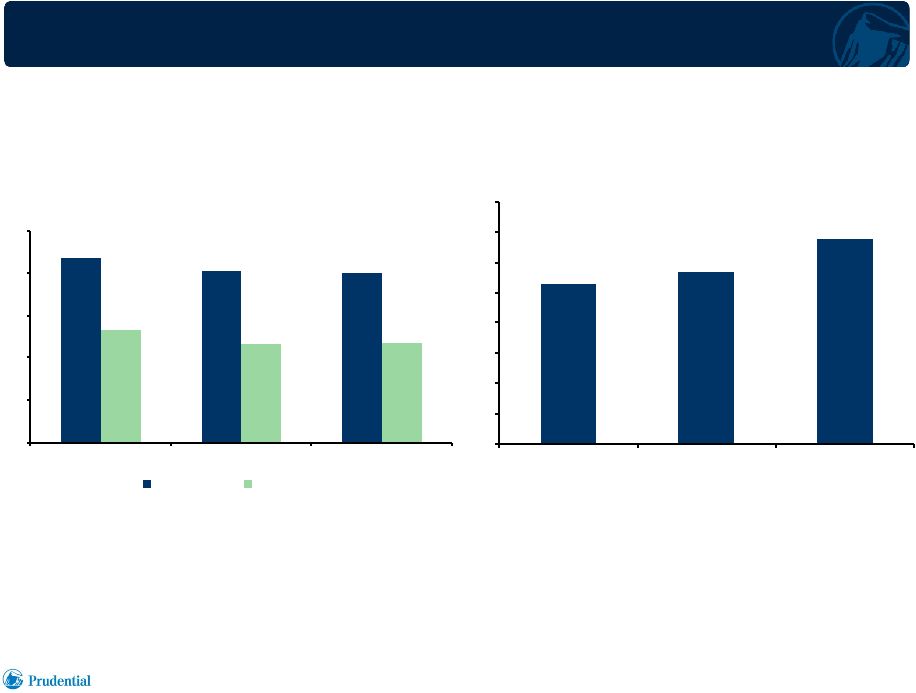 Annuities: Sales, Flows, and Account Values
18
Account
Values
(1)
($ billions)
Sales and Net Flows
($ billions)
1)
As of end of period.
$21.8
$20.3
$20.0
$13.4
$11.7
$11.8
$0
$5
$10
$15
$20
$25
2010
2011
2012
Gross Sales
Net Flows
$106.2
$113.5
$135.3
$0
$20
$40
$60
$80
$100
$120
$140
$160
2010
2011
2012
Investor Day 6.18.2013 |
 •
Market leader in Institutional Investment Products
–
Pension Risk Transfer
–
Investment Only Stable Value
–
Improves operational efficiency and customer experience
–
Strengthens this platform for stable value and other investment products
•
Balanced earnings mix between these two platforms
–
Institutional
Investment
Products
now
contributes
more
than
half
of
segment
earnings
–
Mix of fee and spread income
•
Source of proprietary investment management opportunities
•
Additional profitable growth opportunities:
–
U.S.
and
International
Pension
Risk
Transfer
expansion
–
pace
of
transactions
will
be
lumpy
–
Additional markets for Investment Only Stable Value
–
Addressing marketplace gaps in retirement plan coverage, retirement savings
adequacy, and longevity protection
Retirement
19
Investor Day 6.18.2013
•
Significantly enhancing our recordkeeping capabilities in Full Service, a fully
integrated platform for DB, DC, and non-qualified plans
|
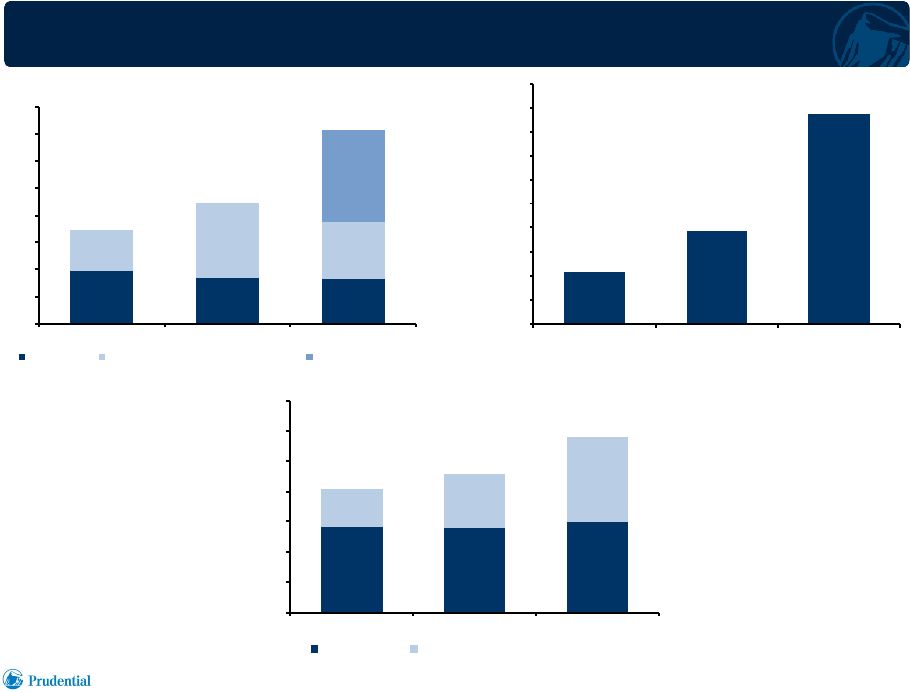 $34.6
$44.6
$71.4
$0
$10
$20
$30
$40
$50
$60
$70
$80
2010
2011
2012
Full Service
Other Institutional Investment Products
Pension Risk Transfer
$10.8
$19.3
$43.7
$0
$5
$10
$15
$20
$25
$30
$35
$40
$45
$50
2010
2011
2012
$205
$230
$290
$0
$50
$100
$150
$200
$250
$300
$350
2010
2011
2012
Full Service
Institutional Investment Products
Retirement: Sales, Flows, and Account Values
20
1)
As of end of period.
Sales
($ billions)
Account
Values
(1)
($ billions)
Net Flows
($ billions)
Investor Day 6.18.2013 |
 Asset Management
•
$827 billion in assets under management as of December 31, 2012
•
Robust organic growth through the financial crisis
–
22
consecutive
quarters
of
positive
third
party
institutional
net
flows
(1)
–
Successful entry to the closed-end fund market
–
Asset Management fees have grown at 12% annually since 2010
•
Strong investment returns
–
74% of assets exceeded benchmarks over the past three years
•
Continuing to reduce volatility from Other Related Revenue
•
Additional profitable growth opportunities:
–
Proprietary target date solutions, and other outcome-oriented solutions
–
Further pension plan de-risking (Pension Risk Transfer,
Liability-driven investing) –
Increased proprietary flows from other business platforms
–
Increasing globalization of asset management
21
1)
Excluding money market flows.
Investor Day 6.18.2013 |
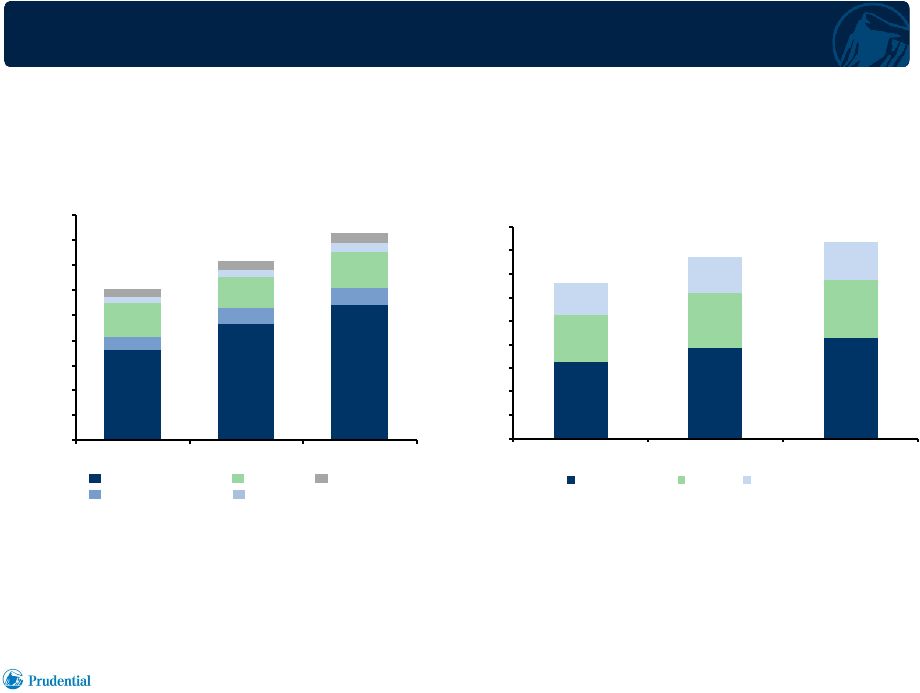 $606
$718
$827
2010
2011
2012
$0
$100
$200
$300
$400
$500
$600
$700
$800
$900
Asset Management: AUM and Fees
22
Asset Management Fees
by Asset Type
($ millions)
AUM
by
Asset
Type
(1)
($ billions)
Public Fixed Income
Private Fixed Income
Equity
Real Estate
Commercial
Mortgages
1)
As of end of period.
2)
Includes Commercial Mortgages.
$1,326
$1,541
$1,667
$0
$200
$400
$600
$800
$1,000
$1,200
$1,400
$1,600
$1,800
2010
2011
2012
Fixed Income
Equity
Real Estate
Investor Day 6.18.2013
(2) |
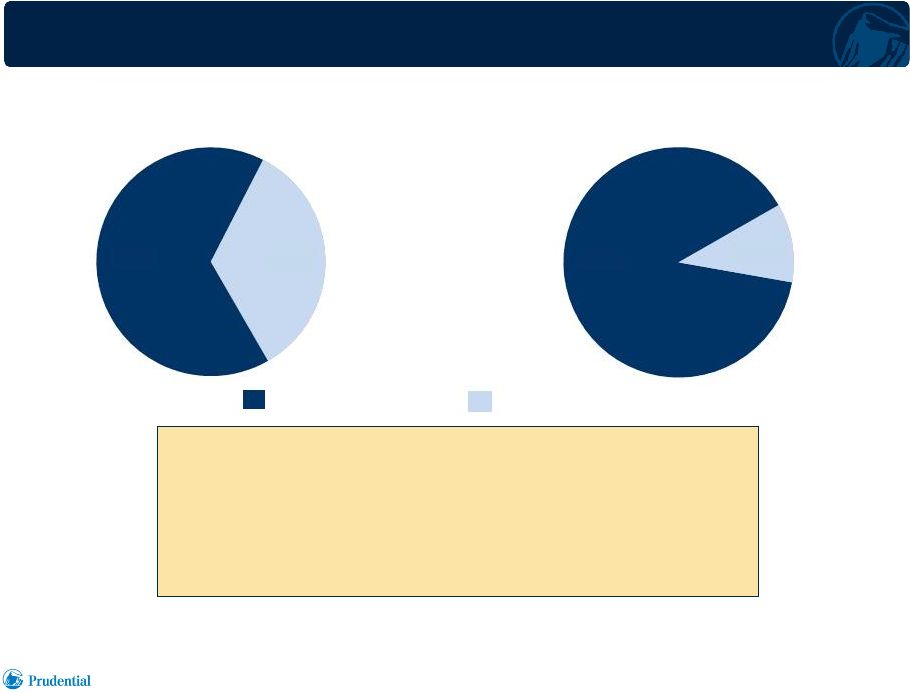 Asset Management: Revenue Mix
23
1)
Excludes Service, Distribution and Other Revenues.
2)
Not restated for International Investments.
3)
Includes CDOs.
2007
(1)(2)
$1.6 billion
2012
(1)
$1.9 billion
Key developments since 2007:
•
Growth in asset management fees
•
Reduced strategic investing exposure from 2008 peak levels
–
Interim
portfolio
reduced
from
$1.9
to
$0.3
billion
(3)
–
Total strategic investing portfolio reduced from $2.7 to $1.0 billion
–
Strategic investments per fund reduced from $44 to $19 million
•
Exited commercial mortgage securitization conduit
Asset Management Fees
Other Related
Revenue
Investor Day 6.18.2013
66%
34%
89%
11% |
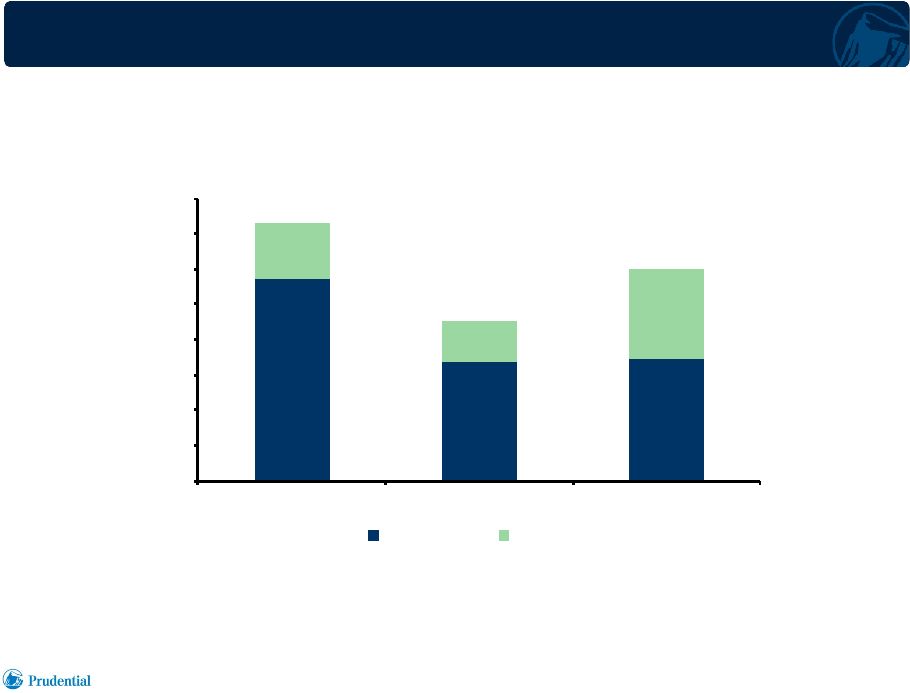 Asset Management: Flows
24
1)
Third Party, excluding Money Market activity.
($ billions)
Net Flows
(1)
$28.7
$16.9
$17.2
$7.8
$5.7
$12.8
$36.5
$22.6
$30.0
$0
$5
$10
$15
$20
$25
$30
$35
$40
2010
2011
2012
Institutional
Retail
Investor Day 6.18.2013 |
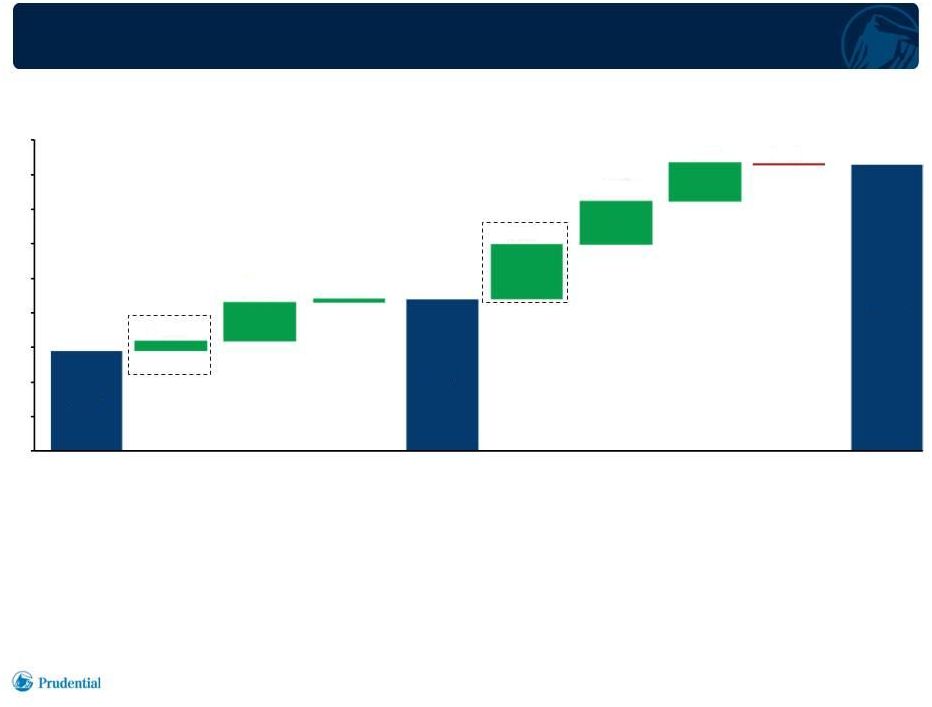 Asset Management: AUM Growth Attribution
25
($ billions)
Investor Day 6.18.2013
$28
$114
$9
$159
$124
$111
($6)
$288
$439
$827
2002 AUM
Net Flows
2007 AUM
Net Flows
Market /
Asset
Appreciation
Other
International
Investment
Management
(1)
Market / Asset
Appreciation
Other
(2)
$0
$100
$200
$300
$400
$500
$600
$700
$800
$900
2012 AUM
1)
International Investment Management represents 12/31/12 EOP AUM. Results of the majority of the
company's international investments operations, formerly included in the International Insurance
segment, have been reclassified and included in the Asset Management segment as of 12/31/2012.
This reflects the Company's decision to align the management of these businesses. Other includes Money Market
flows, foreign exchange rate and other activity. 2) |
 Individual Life Insurance
•
Market leader with strong profitability
–
Maintaining pricing discipline
–
Focusing on most profitable distribution partners
•
Inherently stable business and important source of cash flow
•
Product mix limits overall interest rate and equity market sensitivity
•
Additional profitable growth opportunities
–
Integration of Hartford Life acquisition
•
Expands scale
•
Provides complementary distribution
•
Enhances product innovation capabilities
•
Generates appropriate returns over time
–
Underserved markets
26
Investor Day 6.18.2013 |
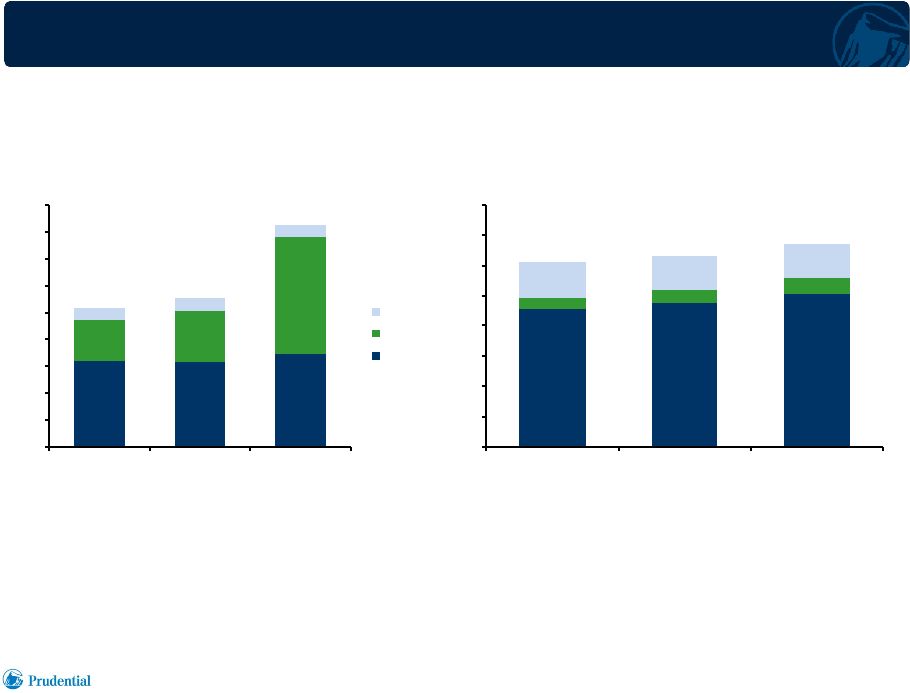 Individual Life: New Business Premiums and In-force
27
1)
Excludes corporate-owned life insurance.
2)
As of end of period, before reinsurance ceded.
Annualized
New
Business
Premiums
(1)
($ millions)
Face
Amount
In
Force
(2)
($ billions)
$260
$278
$412
$0
$50
$100
$150
$200
$250
$300
$350
$400
$450
2010
2011
2012
Variable
Universal
Term
$613
$631
$670
$0
$100
$200
$300
$400
$500
$600
$700
$800
2010
2011
2012
Investor Day 6.18.2013 |
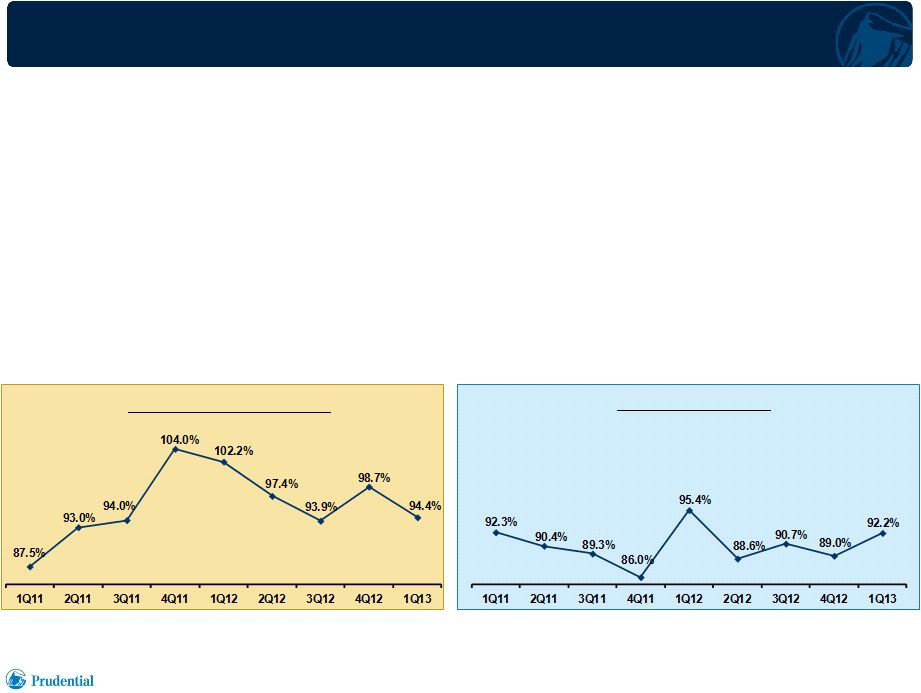 Group Insurance
•
New senior management team
•
Making progress with respect to profitability in Disability
–
One-third of the book has been repriced or lapsed over the past year
–
Investing heavily in claims management
–
Improving benefit ratio
•
Group Life benefiting from strong demand for voluntary products
–
Approximately 70% of sales in 2012
•
Additional
profitable
growth
opportunities
from
new
and
existing
voluntary
products
28
Investor Day 6.18.2013
Disability Benefit Ratio
Life Benefit Ratio |
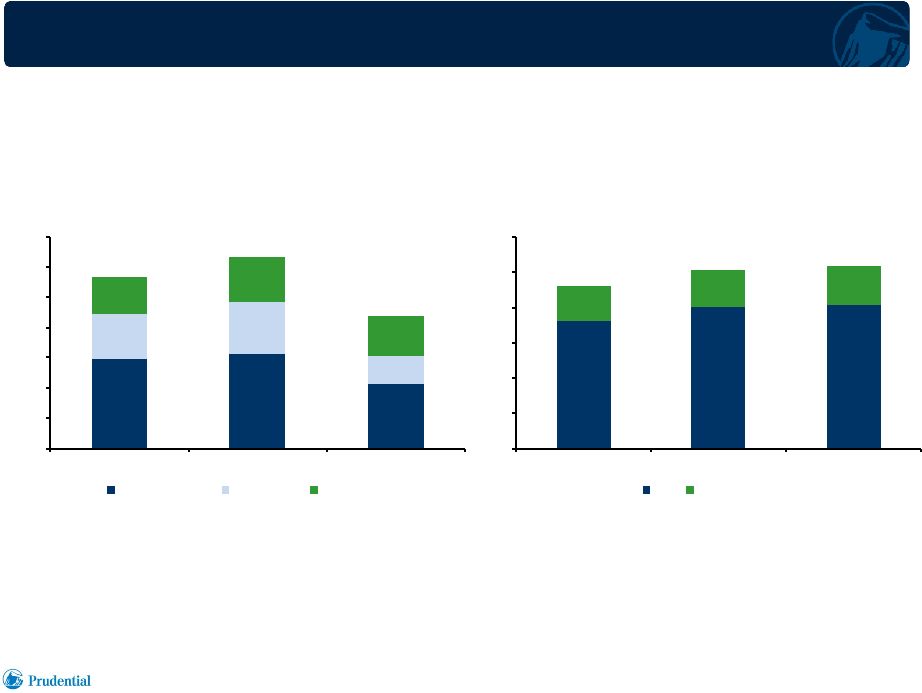 Group Insurance: Premiums
29
Annualized New Business Premiums
($ millions)
In
Force
Premiums
(1)
($ millions)
1)
As of end of period; net of reinsurance.
$4,612
$5,071
$5,172
$0
$1,000
$2,000
$3,000
$4,000
$5,000
$6,000
2010
2011
2012
Life
Disability
$568
$635
$439
$0
$100
$200
$300
$400
$500
$600
$700
2010
2011
2012
Voluntary Life
Basic Life
Disability
Investor Day 6.18.2013 |
   Agenda
30
•
Executive Summary
•
Overall U.S. Strategy
•
Review of U.S. Businesses
•
Conclusion
Investor Day 6.18.2013 |
 Conclusion
•
We have an extensive presence across the institutional and retail marketplace
•
We
are
poised
to
continue
to
benefit
from
a
cyclical
recovery
in
the
economy
and capital markets
•
We are favorably leveraged to longer-term secular growth trends
–
Retirement
–
Pension plan de-risking
–
Longevity
–
Individual asset accumulation
•
Each respective business is focused on achieving profitable growth
–
Sustaining strong execution and discipline in our current markets
–
Identifying and pursuing additional growth opportunities
•
Across our businesses, we are pursuing additional opportunities where we are
competitively advantaged by our distinctive combination of capabilities
31
Investor Day 6.18.2013 |
 Prudential Annuities
Robert O’Donnell
Robert O’Donnell
President
President
Prudential Annuities
Prudential Annuities |
 Variable Annuities is a Core Prudential Business
2
In Force Valuation
•
Our in force portfolio has significant value and will produce positive cash
flows over the remaining life in diverse
scenarios
Risk Management
•
Our risk management efforts focus on reducing capital markets risk and
maintaining a strong capital position
New Business
•
Our new business produces positive cash flows and offers favorable returns
in the current interest rate environment
Investor Day 6.18.2013 |
 Company
Perspective
Customer and Distributor
Perspective
•
Lifetime retirement income
security
•
Equity Market participation
•
Flexible access to account value
•
Account value protection in
down markets
•
Demonstrated commitment
to business
•
Innovative product offerings
•
Contributes to Prudential’s
business and risk diversification
•
Solid returns and growth
over time
•
Strong track record in product-
based risk management
•
Capital market protection
through hedging program
Value Proposition
3
Investor Day 6.18.2013 |
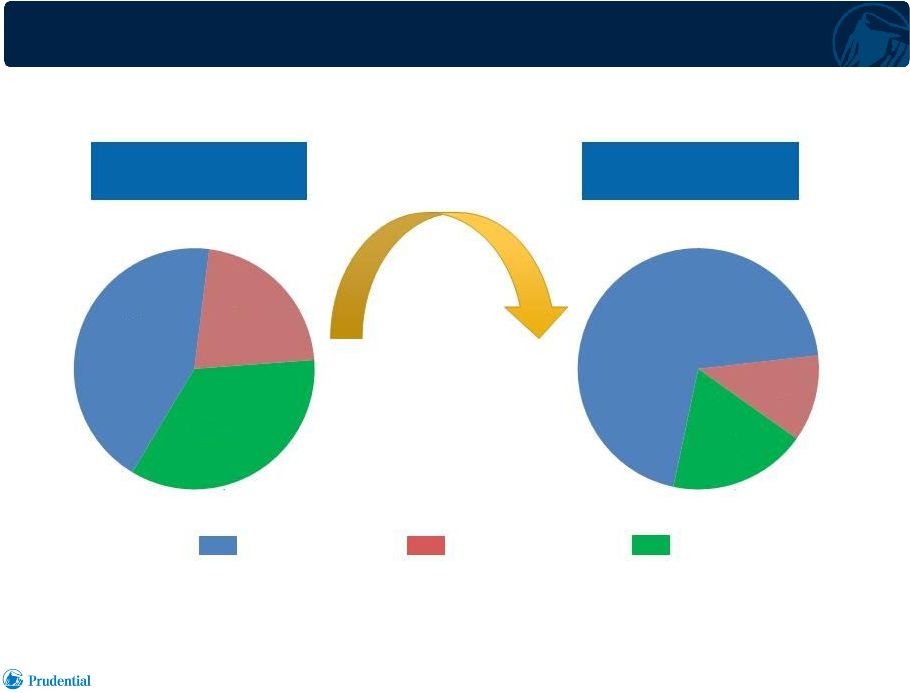 1
1
Year End 2009
(1)
$81 billion
Year End 2012
(1)
$132 billion
Improved Risk
Profile
Living Benefit with
Auto-Rebalancing
Living Benefit without
Auto-Rebalancing
No Living Benefits
Improving Risk Profile of
In Force Variable Annuity Block
1)
Variable annuity account values were composed of 52% of equity funds and 48% of
fixed income at end of 2009 and 57% of equity funds and 43% of fixed income
at end of 2012. Investor Day 6.18.2013
43%
22%
35%
70%
12%
18%
4 |
 Key
Risks and Risk Management 5
Risks
Risks
Mitigants
Mitigants
•
Hedging mitigates capital market risk of living
benefit features
•
Auto-rebalancing at contract level
•
Account value is first source of funding for
lifetime income
•
Rigorous management of asset allocation options
•
Assumptions based on industry standards
•
Best estimates refreshed annually
•
Assumptions based on historical data
•
Best estimates refreshed annually
Investment
Investment
Performance
Performance
Mortality/
Mortality/
Longevity
Longevity
Policyholder
Policyholder
Behavior
Behavior
Investor Day 6.18.2013
Capital
Capital
Markets
Markets |
 In
Force Valuation 6
Investor Day 6.18.2013 |
     Profile
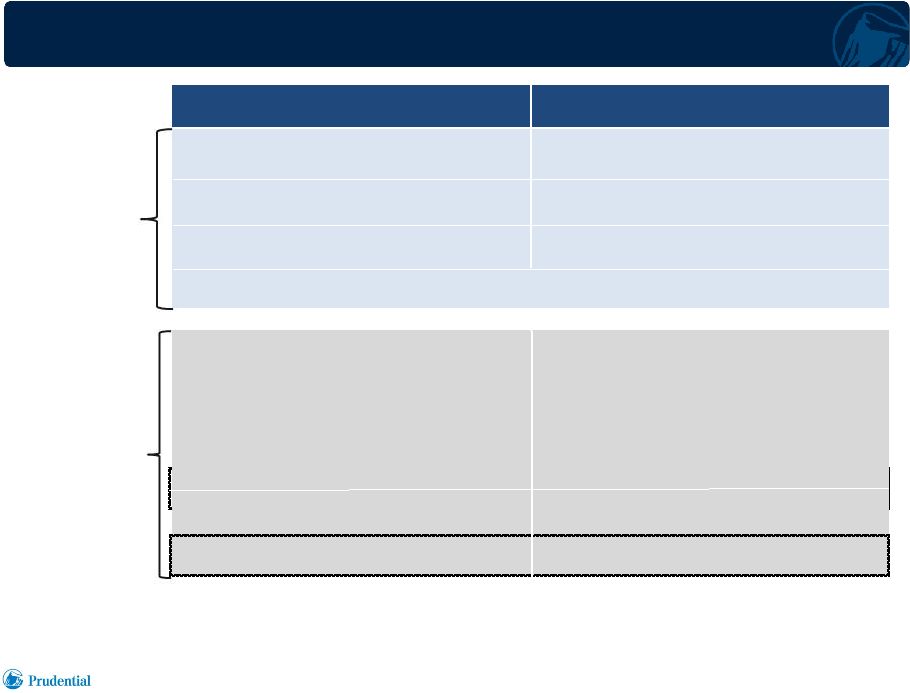
of Baseline Assumptions for In Force Contracts 7
1)
Based on GAAP best estimates as of 12/31/12.
2)
Long term expected equity market return. Expected return in four
year look forward period is 9.1%.
3)
Long term expected fixed income return. Expected return in four
year look forward period is 1.4%.
4)
Policyholder behavior assumptions for guaranteed lifetime withdrawal benefit
products only. 5)
Lapse rates prior to the dynamic lapse adjustment.
6)
After shock lapses.
Capital
Markets
Policyholder
Behavior
(4)
Baseline
Assumptions
(1)
Equity
Market
Return
(2)
6.0% appreciation plus
2.0% dividend yield
Fixed
Income
Return
(3)
3.6%
Blended Return
~6.0% annually
Living Benefit Liability is Hedged
Investor Day 6.18.2013
Base Annual Lapse Assumptions
Inside Surrender Charge Period
1.0%
(5)
Outside
Surrender
Charge
Period
(6)
9.0%
(5)
Dynamic Lapse Assumption
5.4%
Benefit Utilization
95% take lifetime withdrawals
Benefit Efficiency
85% of guaranteed amount |
 In
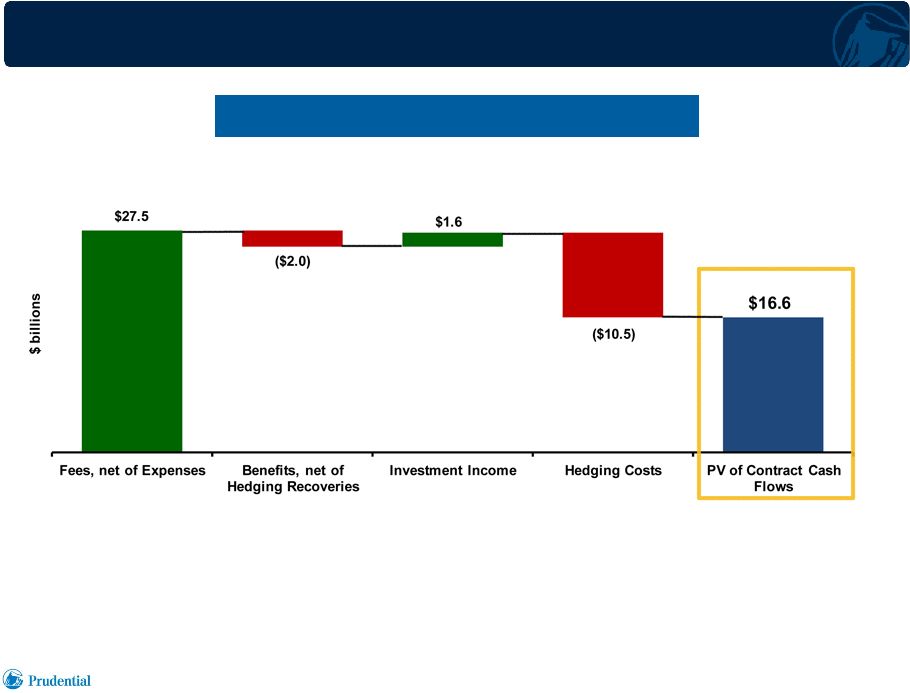
Force is Expected to Produce Positive Future Cash Flows
8
1)
Reflects total remaining contract cash flows based upon the in force book of
business as of 12/31/12. 2)
Cash
flows
are
shown
on
a
present
value
basis,
are
discounted
at
the
forward
curve,
and
reflect
the
results
of
hedging
activity.
Baseline Scenario Cash Flows
Baseline Scenario Cash Flows
(1)(2)
(1)(2)
Investor Day 6.18.2013 |
 In a
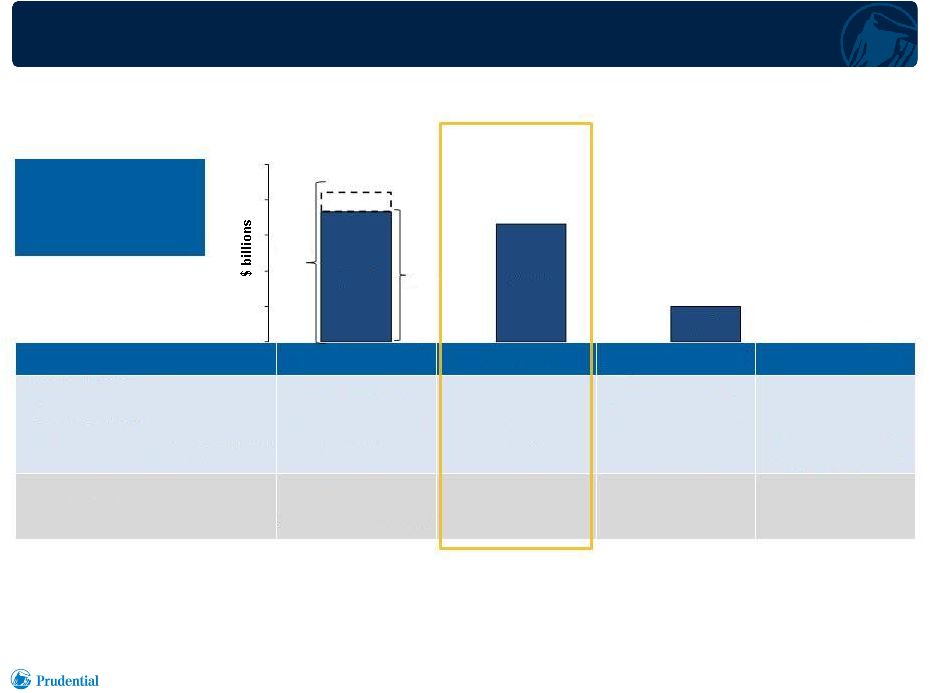
Range of Capital Market Scenarios, the In Force Book Produces Positive Cash
Flows, Including the Impact of Hedging 9
1)
Reflects total contract cash flows based upon the in force book of business as of
12/31/12. 2)
Cash
flows
are
shown
on
a
present
value
basis,
are
discounted
at
the
forward
curve,
and
reflect
the
results
of
hedging
activity.
3)
The
positive
market
scenarios
reflects
an
immediate
up
shock
of
10%
&
30%
on
12/31/12
followed
by
baseline
equity
market
returns
thereafter
with
fixed
income
returns 100bps above the expected long term rate. Assumes baseline
policyholder behavior assumptions. 4)
The
negative
scenario
reflects
an
immediate
down
shock
of
30%
on
12/31/12,
followed
by
baseline
equity
returns,
coupled
with
a
flat
10-year
treasury
rate
of
1.78%.
Assumes baseline policyholder behavior.
5)
The break-even scenario reflects annual equity return of -9% (including
dividend yield). Fixed income returns and policyholder behavior reflect our baseline
assumptions.
Investor Day 6.18.2013
PV of Total
Contract Cash
Flows
(1)(2)
Positive Markets
(3)
Baseline
Negative Markets
(4)
Break Even
(5)
+30%
+10%
$18.4
$16.6
$5.0
$0.0
$
21.1
Equity Markets
Immediate Shock
+10% / +30%
n/a
-30%
n/a
Post-shock Annual Equity Returns
Baseline
Baseline
Baseline
-9% annually
Fixed Income
Long Term
Assumption + 100bps
Baseline
Flat
Baseline |
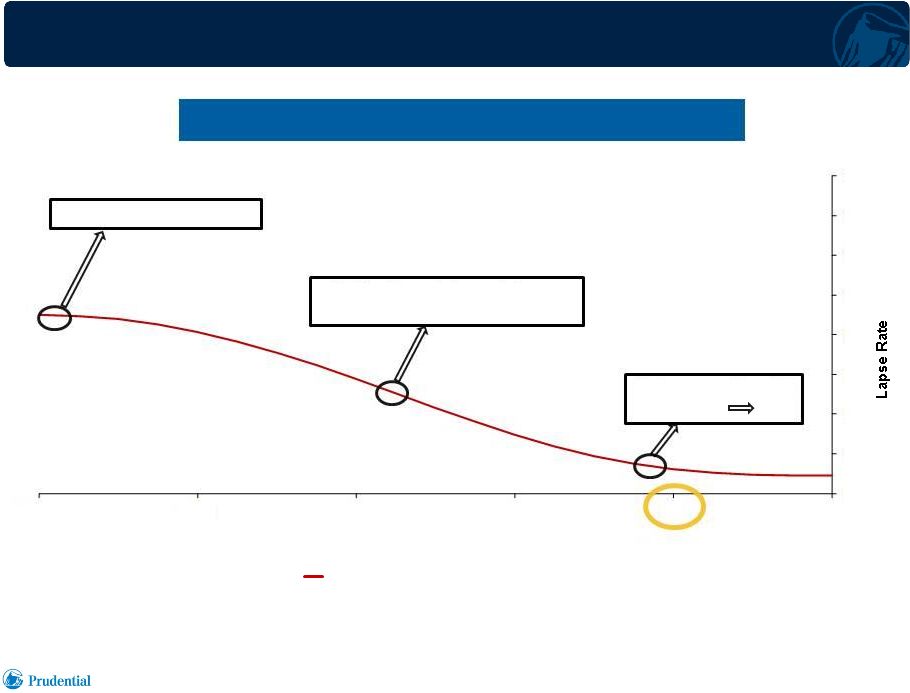 Lapse Rates Linked to “In-the-Moneyness”
10
1
Investor Day 6.18.2013
0%
2%
4%
6%
8%
10%
12%
14%
16%
0%
20%
40%
60%
80%
100%
Account Value (AV) / Protected Withdrawal Value (PWV)
Current GLWB Assumption
9% -
Baseline lapse rate
5.4% -
Current dynamic lapse
assumption
Rate approaches 1%
as AV/PWV 20%
Lapse
Rates
(1)
by
“In-the-Moneyness”
(2)
1)
Lapse rates are post surrender charge period, post “shock“ lapses experienced
immediately after the surrender charge period and reflect GLWB product assumptions only. 2)
“In-the-Moneyness” (Protected Withdrawal Value less Account Value) is used to
develop the percentage of the protected withdrawal value that is covered by the account value. |
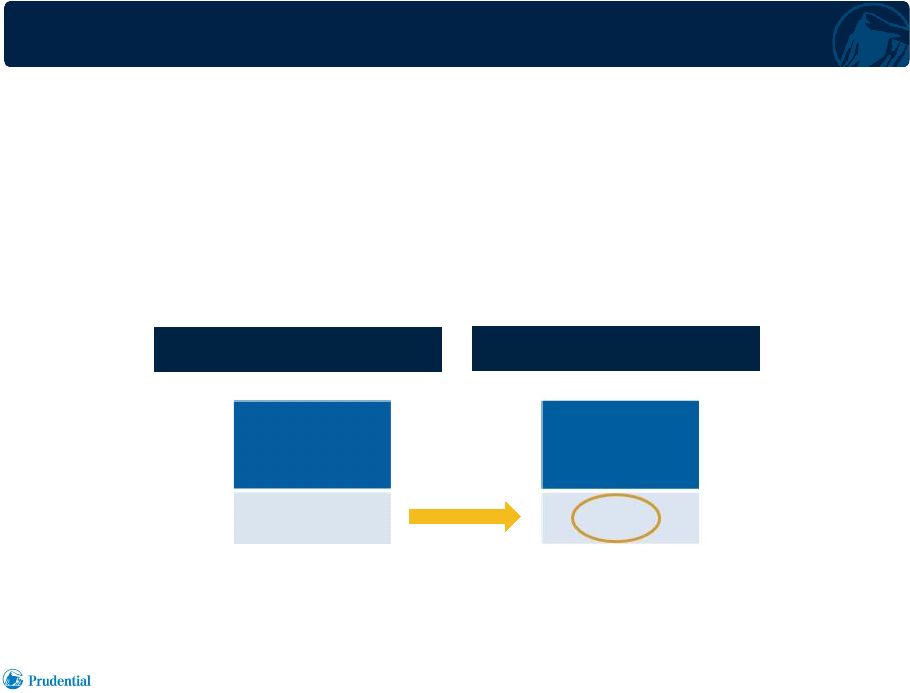 Lifetime Withdrawal Benefit Utilization
and Efficiency Assumptions
•
We assume 95% of policyholders exercise their lifetime withdrawal benefit
11
•
For policyholders that do exercise their lifetime withdrawal benefit we
assume greater efficiency than observed
Actual
Assumption
1)
% of AIA (Annual Income Amount) represents the weighted average withdrawal rate as
a percentage of maximum benefit withdrawal allowed without affecting future
policyholder benefit payments for policyholders with a lifetime withdrawal benefit.
Investor Day 6.18.2013
% of AIA
(1)
85%
% of AIA
(1)
82% |
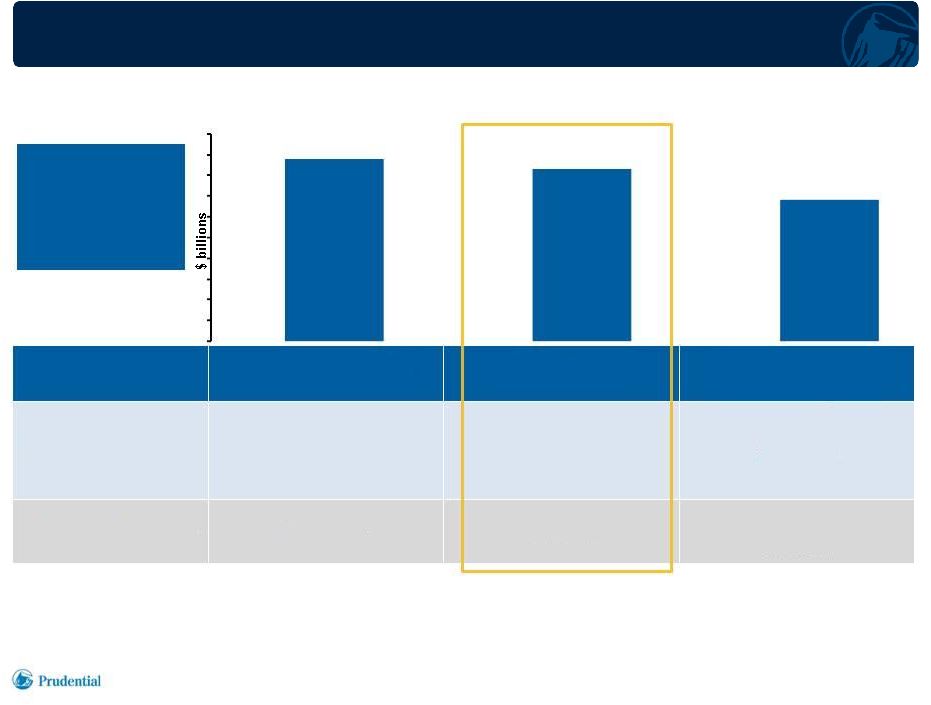 Strong, Positive Cash Flows Even if Future Policyholder
Behavior Deviates from Expectations
12
Investor Day 6.18.2013
PV of Total
Contract
Cash
Flows
(1)(2)
$17.6
$16.6
$13.6
Lower Lapses
(3)
Baseline
Higher Benefit
Efficiency
(4)
Lapses
All periods reduced by
20%
Baseline
Baseline
Benefit Efficiency
Baseline
Baseline
95% of guaranteed
amount
1)
Reflects total contract cash flows based upon the in force book of business as of 12/31/12. 2)
Cash flows are shown on a present value basis, are discounted at the forward curve, and reflect the
results of hedging activity.
3)
The lower lapse scenario reflects a 20% reduction to baseline lapse rates across all periods.
Capital market and benefit utilization assumptions are unchanged relative to the baseline
scenario. 4)
The higher benefit efficiency scenario reflects a 10% increase in benefit efficiency (from 85% to 95%)
across all periods. Capital market and benefit utilization assumptions are unchanged
relative to the baseline scenario. |
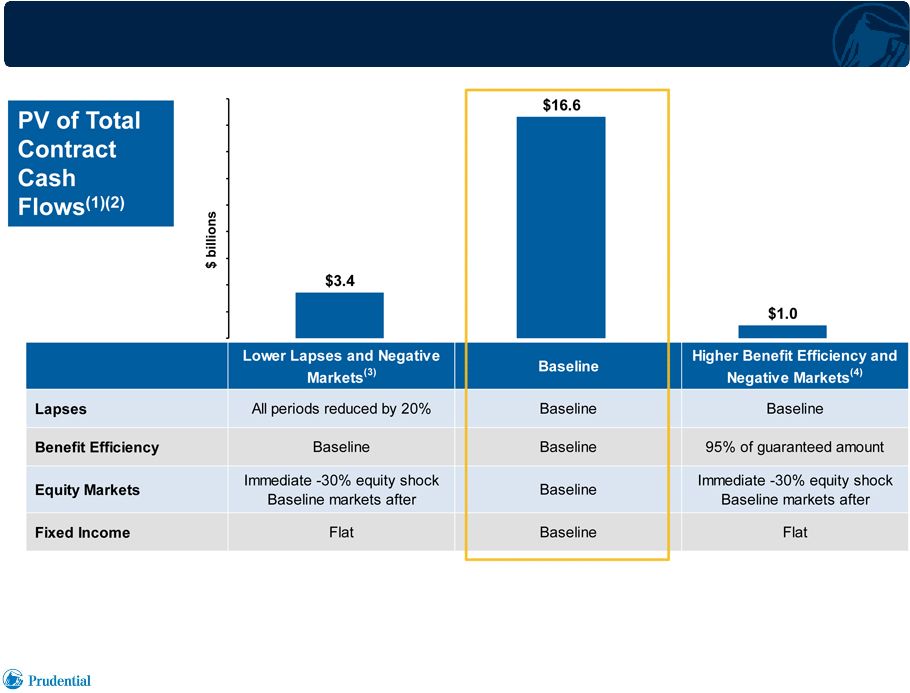 Resilient Cash Flows Despite Severely Adverse Market and
Policyholder Behavior Scenarios
13
1)
Reflects total contract cash flows based upon the in force book of business as of
12/31/12. 2)
Cash
flows
are
shown
on
a
present
value
basis,
are
discounted
at
the
forward
curve,
and
reflect
the
results
of
hedging
activity.
3)
The lower lapse scenario reflects a 20% reduction to baseline lapse rates across
all periods. Equity Markets reflect an immediate 30% down shock followed by
baseline
annual
growth
coupled
with
a
flat
10-year
treasury
rate
of
1.78%.
Benefit
utilization
assumptions
are
unchanged
relative
to
the
baseline
scenario.
4)
The higher benefit efficiency scenario reflects a 10% increase in benefit
efficiency (from 85% to 95%) across all periods. Equity Markets reflect an immediate 30%
down
shock
followed
by
baseline
annual
growth
coupled
with
a
flat
10-year
treasury
rate
of
1.78%.
Benefit
utilization
assumptions
are
unchanged
relative
to
the
baseline scenario.
Investor Day 6.18.2013 |
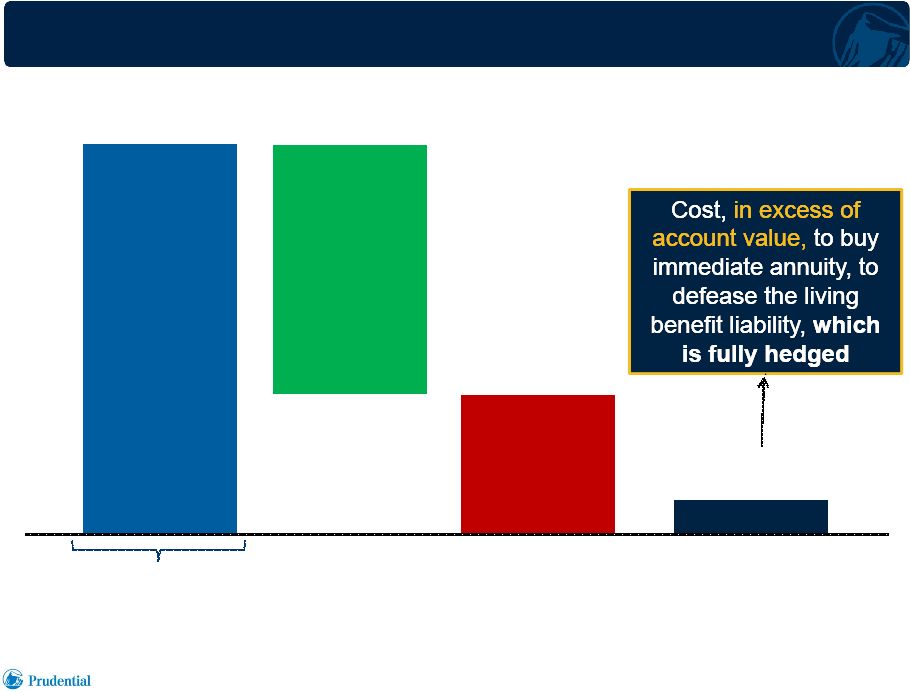  14
Notional amount –
cannot be accessed
by contract holder
1)
Represents
products
with
guaranteed
lifetime
withdrawal
benefits
(GLWB)
as
of
12/31/12.
2)
Represents our living benefit exposure, as of 12/31/12, based upon policyholder's
guaranteed lifetime annual income amount on that date. Our True Exposure is
Significantly Less Than the
Notional
“In-the-Moneyness”
(1)
Protected
Protected
Withdrawal
Withdrawal
Value
Value
$109 billion
$109 billion
Notional
“In-the-
Moneyness”
$14 billion
Account Value
Account Value
$95 billion
$95 billion
$2 billion
Economic
Investor Day 6.18.2013
“In-the-Moneyness”
(2) |
 Risk Management
15
Investor Day 6.18.2013 |
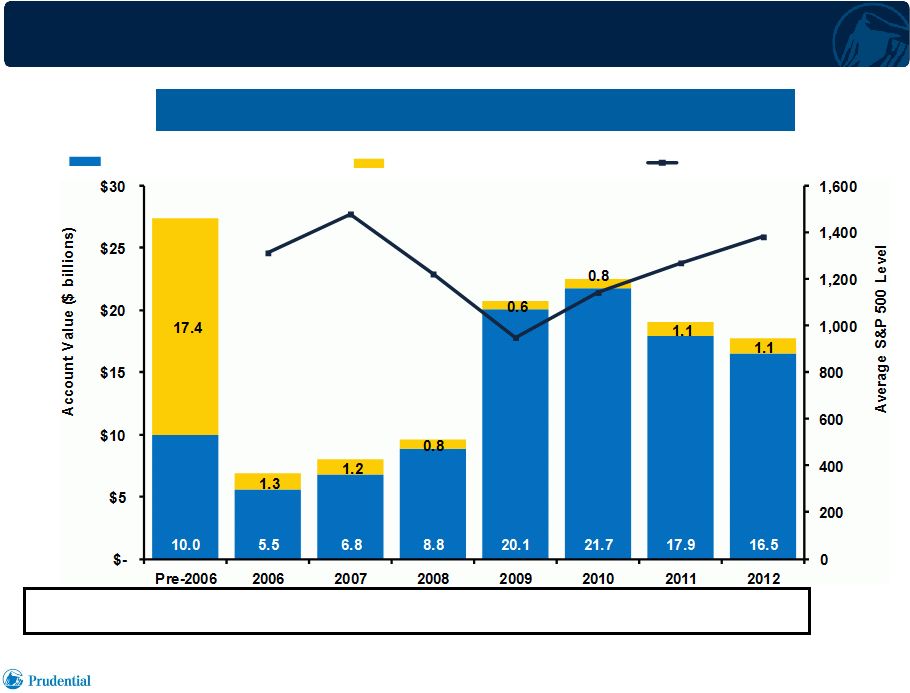 Account Value by Year of Issue
(1)
16
1)
Account
value represents the variable annuity inforce account value as of 12/31/12 for
policies sold in each cohort year and include subsequent premiums in the
year the original policy was sold.
Investor Day 6.18.2013
% of 12/31/12
Account Value
20.8%
5.2%
6.1%
7.3%
15.7%
17.1%
14.4%
13.4%
Total $107.3 billion
Total $24.3 billion
Account Value w/Living Benefit
Account Value w/o Living Benefit
Average S&P 500 Level
Total Account Value of $132 billion as of 12/31/12 |
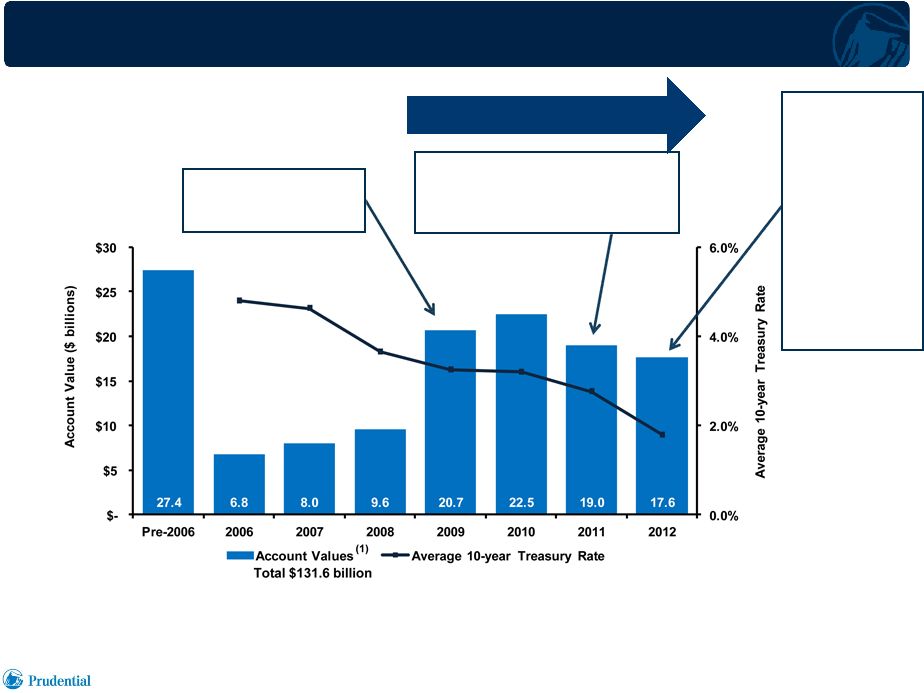 Reducing Risk Through Product Design and Pricing
17
1)
Account value represents the variable annuity in force account value as of 12/31/12
for policies sold in each cohort year and include subsequent premiums in the
year the original policy was sold. 2)
Additional
detailed
product
changes
can
be
found
in
the
appendix
on
slide
30.
•
Increased living
benefit rider fee
•
Reduced roll-up rate
•
Increased living benefit rider fee
•
Reduced roll-up rate
•
Account doubling period
lengthened
De-risking
De-risking
(2)
(2)
•
Increased
living benefit
rider fee
•
Increased
minimum issue
age
•
Increased age
for 5% income
payout
•
Eliminated
subsequent
premiums
•
Stopped sales
of X-share
Investor Day 6.18.2013 |
 Hedge Program Overview
18
•
Objectives
–
Severe scenario
protection
–
Maximize capital
efficiency
–
Minimize earnings
volatility
•
Strong performance
through full economic
cycles
Capital Markets Hedging
Overview
Capital Markets Hedging
Approach
•
Aims to replicate the market
sensitivities of our living
benefits
•
Uses derivatives to ensure
protection in any economic
scenario
Investor Day 6.18.2013 |
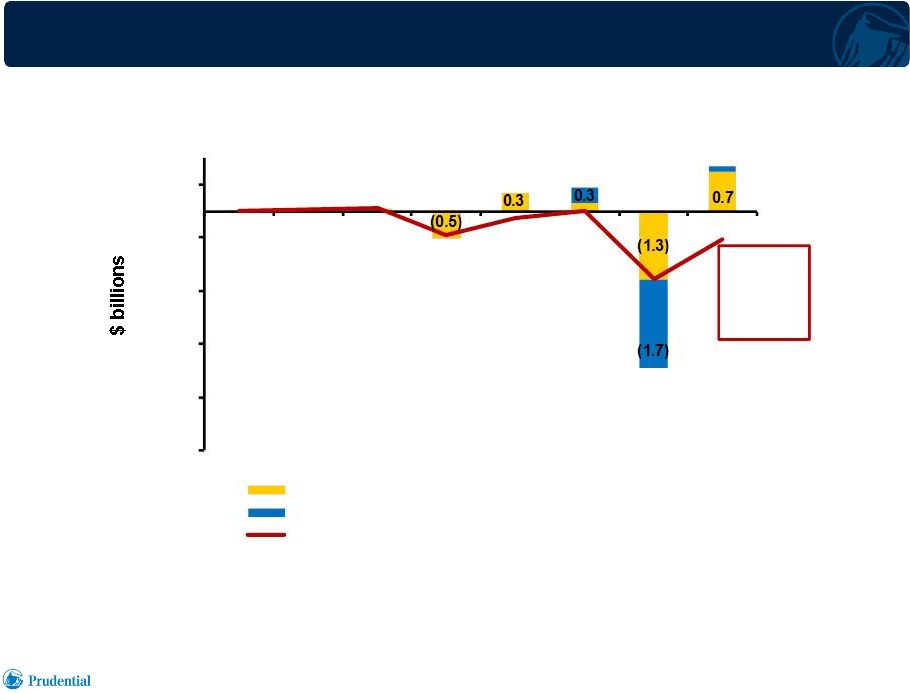 Historical Hedge Program Results
(1)(2)
19
1)
Excludes differential related to the assumption unlocks because they are not
hedged. 2)
We hedge to our economic view of the liability. The hedge target
is grounded in a GAAP/Capital markets valuation framework that incorporates
modifications to GAAP including alteration to the risk-free return
assumption to account for customer selected funds invested in risk bearing assets.
3)
Prudential
did
not
hedge
100%
of
the
hedge
target,
but
holds
capital
against
a
portion
of
the
interest
rate
exposure
rather
than
fully
hedging
the
risk.
The
underhedge
mitigates enterprise exposure to rising interest rates.
1
Investor Day 6.18.2013
(2)
(3)
0.0
0.0
0.0
0.1
0.1
$(4.5)
$(3.5)
$(2.5)
$(1.5)
$(0.5)
$0.5
2005
2006
2007
2008
2009
2011
2012
Yearly Net Gain/(Loss) vs. Hedge Target
Yearly Net Gain/(Loss) on Interest Rate Underhedge
Cumulative Net Gain/(Loss) vs. Hedge Target
Cumulative
Hedge
Differential
= ($0.5B)
2010 |
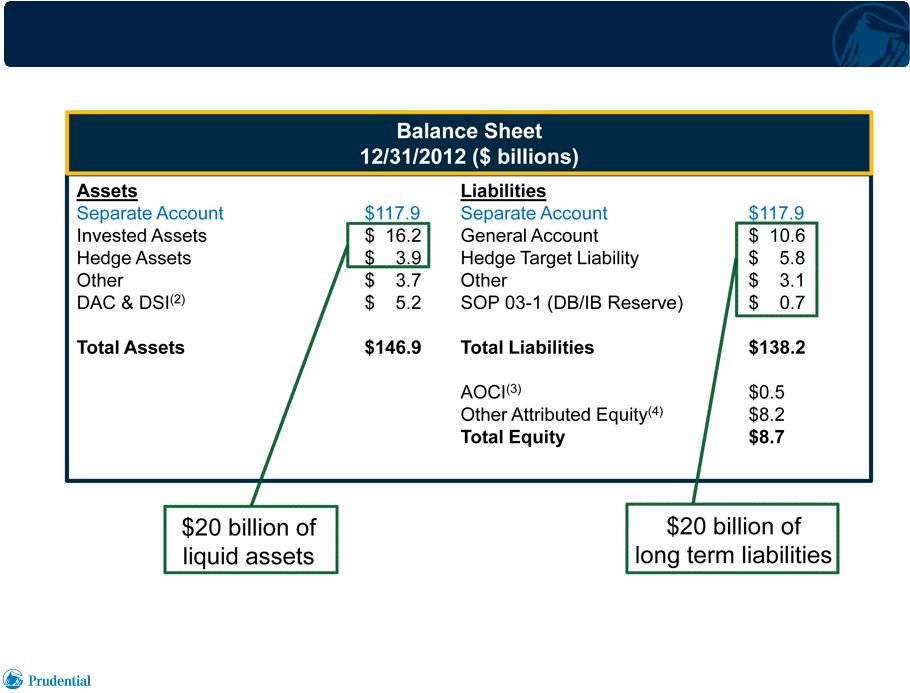 GAAP
Balance Sheet - VA Footprint
(1)
20
1)
Includes Fixed Annuities.
2)
Deferred Acquisition Costs (DAC) and Deferred Sales Inducements (DSI).
3)
Accumulated Other Comprehensive Income.
4)
Includes ~$4 billion of equity attributable to PrucoRe.
Investor Day 6.18.2013 |
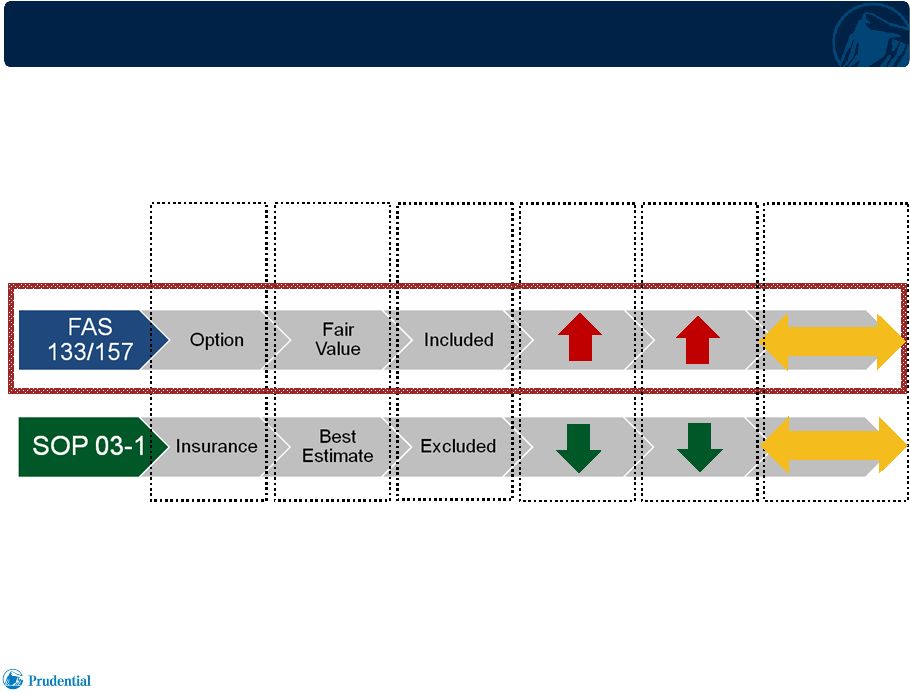 Accounting Framework Captures the Fair Value of our
Living Benefit Liabilities
21
Prudential’s mark to market accounting framework, FAS 133/157, applies a
valuation methodology that results in increased volatility in earnings and
equity 1)
Under FAS 133/157 accounting we are required to incorporate the
market-perceived risk of our own non-performance (NPR) in the valuation of the embedded
derivatives associated with our optional living benefit features.
Accounting
Framework
Reserve
Valuation
NPR
(1)
Earnings &
Equity
Volatility
Path Dependent
Required
Equity
Reserve
Impact
Path Dependent
Investor Day 6.18.2013 |
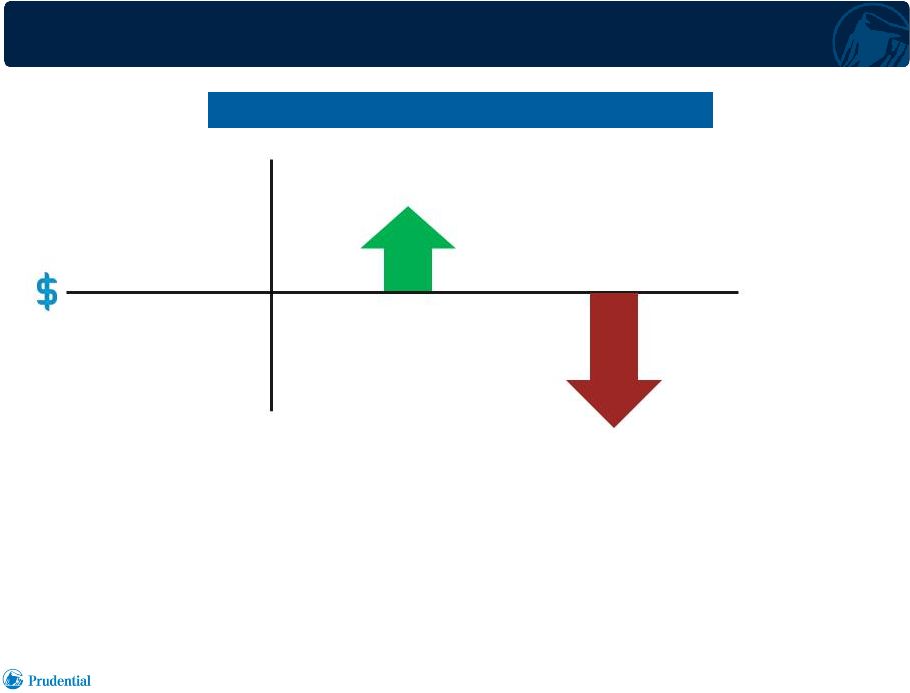 Impact of Assumption Updates
Reflects Accounting Framework
•
The impact of a change to baseline lapse assumptions measured under each
construct •
The negative impact of a reduction to our lapse assumption is magnified under FAS
133/157 22
Assumption Update Impact of Lapse Reduction
Assumption Update Impact of Lapse Reduction
1)
The arrows above represent a proxy for SOP 03-1 & FAS 133/157 (excl. NPR)
accounting frameworks. SOP 03-1 accounting utilizes management’s best
estimates of capital markets performance to value liabilities while FAS 133/157
(fair value) accounting assumes a risk neutral environment. SOP 03-1
(1)
FAS
133/157
(1)
Positive GAAP Net
Income Impact
Negative GAAP Net
Income Impact
Investor Day 6.18.2013 |
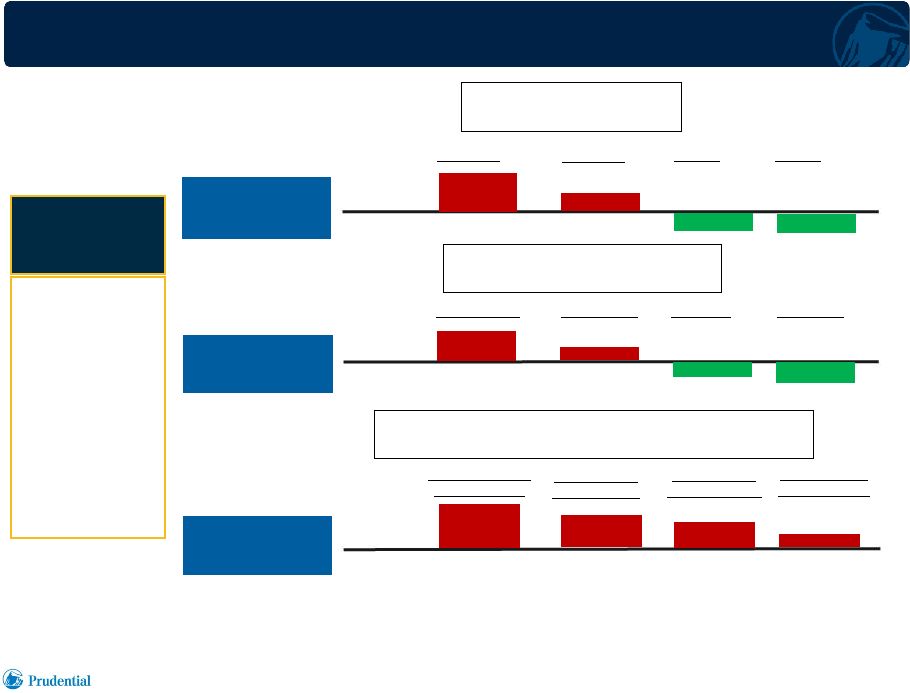 Capital Protection Framework Provides
Sufficient Coverage in Tail Scenarios
1)
Assumes shock occurs on 12/31/12 for overall block of business in force; represents
gross change in statutory capital requirements, inclusive of capital
requirements in reinsurance captive, immediately following shock.
Equity
Shock
Impacts
(1)
$ billions
Interest
Rate
Shock
Impacts
(1)
$ billions
23
Combined
Equity
&
Interest
Rate
Shock
Impacts
(1)
$ billions
Investor Day 6.18.2013
Capital
Capital
Protection
Protection
Framework:
Framework:
•
•
On-balance
Sheet
Capital
•
Derivatives
•
Reinsurance
•
Contingent
Sources
of
Capital
Capital
Capital
Requirements
Requirements
Increase
Decrease
Down 30%
Down 10%
Up 10%
Up 30%
$(0.4)
$(0.4)
$(0.7)
$(0.7)
$2.7
$2.7
$0.4
$0.4
Capital
Capital
Requirements
Requirements
Increase
Decrease
Down 100 bps
Down 10 bps
Up 10 bps
Up 100 bps
$(0.2)
$(0.2)
$(0.7)
$(0.7)
$1.2
$1.2
$0.0
$0.0
Increase
Decrease
-30% Equity & -
100bps Interest
-30% Equity
&
-10bps Interest
$2.3
$2.3
$0.5
$0.5
$5.1
$5.1
$2.9
$2.9
Capital
Capital
Requirements
Requirements
-10% Equity &
-100bps Interest
-10%
Equity
&
-10bps Interest |
 New Business
24
Investor Day 6.18.2013 |
 •
HDI 2.1 launched in February 2013, includes further de-risking
measures
25
Investor Day 6.18.2013
–
Rollup rate for protected value: 5% on highest daily value, limited to
earlier of 10 years or first lifetime withdrawal
–
Earliest age to receive 5% income payment rate is 70 (from 65)
–
Income payment rate reduced to 3.5% at ages 55-59
1/2
(from 4%) and 4.5% at
ages 65-69 (from 5%)
–
200% protected value guarantee at 12 years no longer available
–
Reduced compensation rates
–
Produces expected returns that meet or exceed targets even in an
environment
of continued low interest rates
New
Business
Offerings
Increase
Shareholder
Value |
 New
Business Produces Positive Cash Flows 1)
Reflects total contract cash flows based upon the HDI 2.1 product design.
2)
Cash
flows
are
shown
on
a
present
value
basis,
are
discounted
at
the
forward
curve,
and
reflect
the
results
of
hedging
activity.
3)
Each bar represents a discrete year.
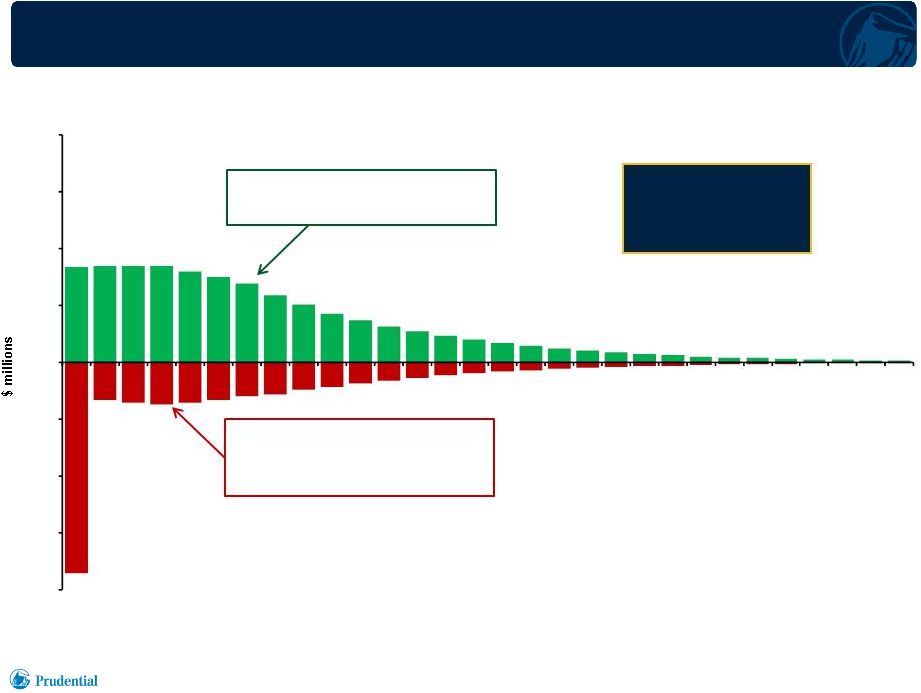
26
PV of Fees
$380 million
PV of Expenses and
Benefits
($234) million
Investor Day 6.18.2013
The present value of baseline new business cash flows equals $146 million per
$1 billion of sales
(1)
$(80)
$(60)
$(40)
$-
$20
$40
$60
$80
1
2
3
4
5
6
7
8
9
10
11
12
13
14
15
16
17
18
19
20
21
22
23
24
25
26
27
28
29
30
$(20)
PV of Cash
PV of Cash
Flows
Flows
(2)(3)
(2)(3)
$146 million
$146 million |
 Variable Annuities is a Core Prudential Business
27
In Force Valuation
•
Our in force portfolio has significant value and will produce positive cash
flows over the remaining life in diverse
scenarios
Risk Management
•
Our risk management efforts focus on reducing capital markets risk and
maintaining a strong capital position
New Business
•
Our new business produces positive cash flows and offers favorable returns
in the current interest rate environment
Investor Day 6.18.2013 |
 Appendix
28
Investor Day 6.18.2013 |
 $(1.5)
$(1.0)
$(0.5)
$-
$0.5
$1.0
$1.5
$2.0
$2.5
$3.0
$3.5
01
02
03
04
05
06
07
08
09
10
11
12
13
14
15
16
17
18
19
20
21
22
23
24
25
26
27
28
29
30
31
32
33
34
35
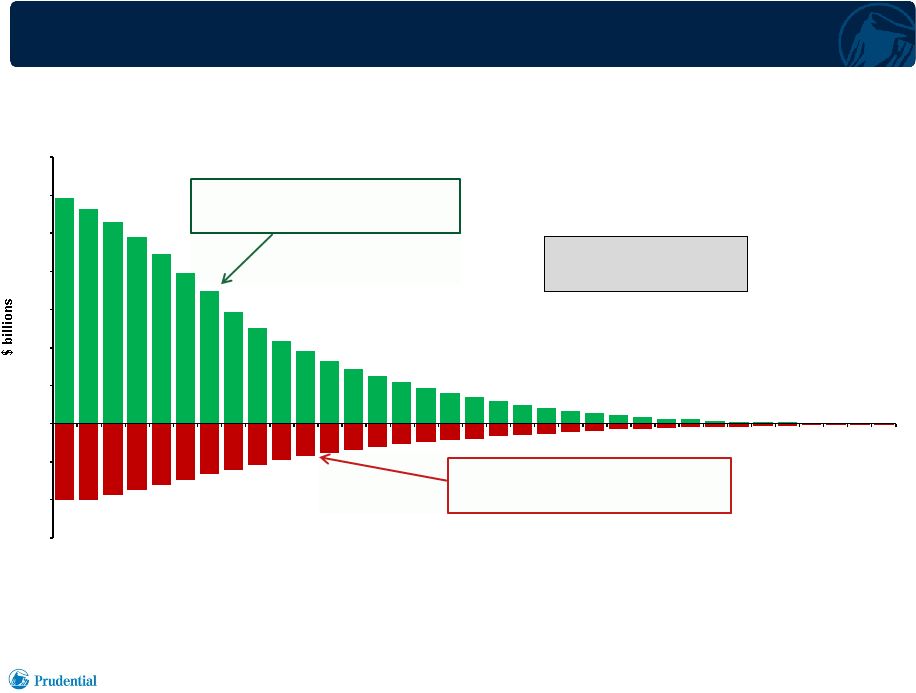
In Force Produces Positive Cash Flows
under Baseline Assumptions
29
The
present
value
of
remaining
in
force
baseline
cash
flows
equals
$16.6
billion
(1)
PV of Fees
$27.8 billion
PV of Cash Flows
$16.6 billion
(2)(3)
PV of Expenses and Benefits
($11.2) billion
Investor Day 6.18.2013
1)
Reflects total contract cash flows based upon the in force book of business as of 12/31/12 with each
bar representing a discrete year.
2)
Cash flows are shown on a present value basis, are discounted at the forward curve, and reflect the
results of hedging activity.
3)
Reflects the baseline capital market and policyholder behavior assumptions found on slide 7.
|
 Adapting to Changing Markets
30
1)
Single life contract.
2)
HD Lifetime Five basis point charge based on account value, all other products
based on protected withdrawal value. 3)
Represents the average S&P 500 level and 10yr treasury rate until the
introduction of the next product change. 4)
Average as of 3/31/13.
Investor Day 6.18.2013
Prudential
Rider
HD Lifetime
HD Lifetime
Five
Five
HD Lifetime
HD Lifetime
Seven
Seven
HD Lifetime
HD Lifetime
Seven +
Seven +
HD Lifetime
HD Lifetime
Six +
Six +
HDI
HDI
HDI
HDI
2.0
2.0
HDI
HDI
v2.1
v2.1
Introduced
November
2006
January
2008
February
2009
August
2009
January
2011
August
2012
February
2013
Basis Point
Basis Point
Charge
Charge
(1)
(1)
60
(2)
60
75
85
95
100
100
Age for
Age for
5% Payout
5% Payout
(1)
(1)
55
55
59
1/2
59
1/2
59
1/2
65
70
200%
200%
Protected
Protected
Value
Value
Guarantee
Guarantee
10 yrs
10 yrs
10 yrs
10 yrs
12 yrs
12 yrs
N/A
Minimum
Minimum
Issue Age
Issue Age
(1)
(1)
55
55
45
45
45
50
50
Average
Average
S&P 500
S&P 500
(3)
(3)
1,467
1,195
863
1,118
1,298
1,430
1,532
(4)
Average 10 yr
Average 10 yr
TSY
TSY
(3)
(3)
4.63%
3.58%
3.21%
3.29%
2.45%
1.74%
1.97%
(4) |
 $572
$462
$313
$589
$884
$984
$652
$(955)
$672
$950
$662
$1,039
$(1,500)
$(1,000)
$(500)
$-
$500
$1,000
$1,500
2007
2008
2009
2010
2011
2012
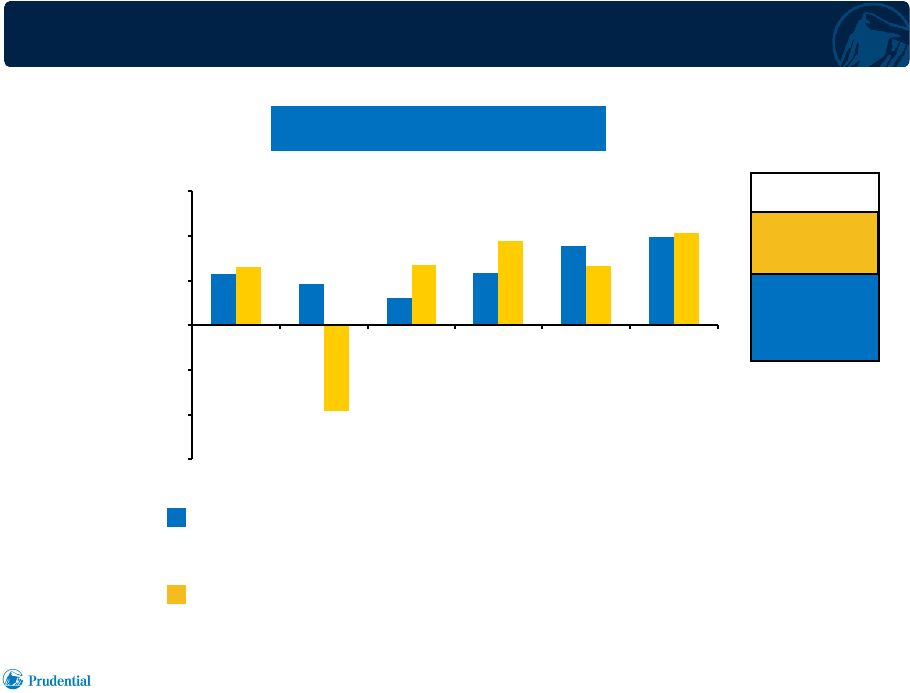
Adjusted operating income
Adjusted operating income
($ millions)
Reported
$503
Six Year
Average
Excluding
Excluding
indicated
indicated
items
items
$634
$634
Growing Baseline Operating Results
31
Investor Day 6.18.2013
Excluding impact of:
•
Changes in the estimated profitability on reserves for GMDB/GMIB
•
Amortization of DAC and other costs
•
Other discrete items
Reported
(1)
1)
Inclusive of expenses estimated in excess of baseline level for 2012.
|
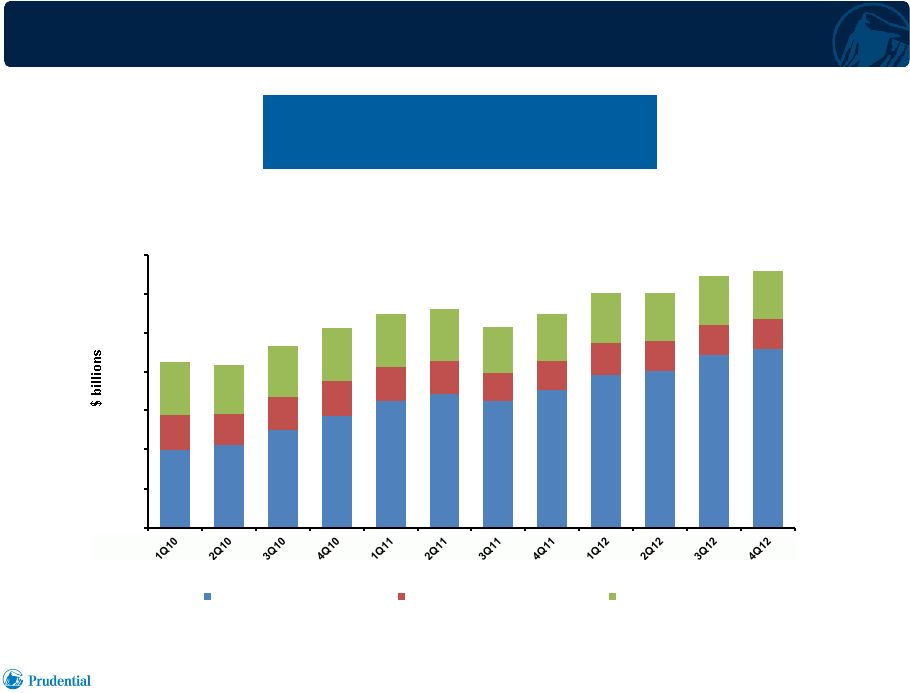 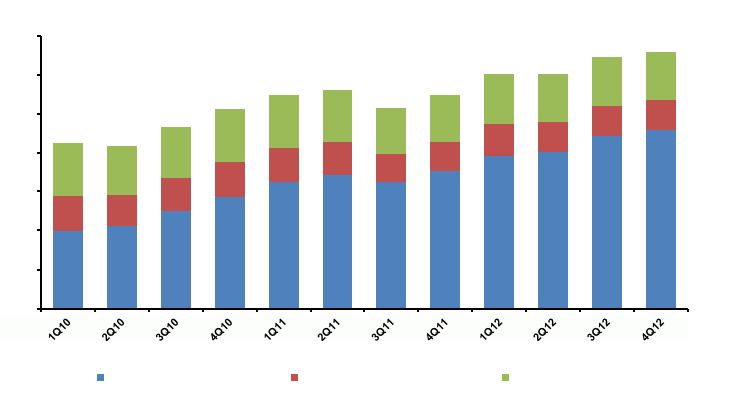 47%
51%
53%
56%
59%
61%
63%
64%
65%
67%
69%
70%
21%
19%
18%
17%
16%
15%
14%
14%
14%
13%
12%
12%
32%
30%
29%
27%
25%
24%
23%
22%
21%
20%
19%
18%
$85
$84
$93
$102
$110
$112
$103
$110
$120
$120
$129
$132
$-
$20
$40
$60
$80
$100
$120
$140
With living benefits,
With automatic rebalancing
With living benefits,
Without automatic rebalancing
Without living benefits
Improving Risk Profile
32
Variable Annuity
Variable Annuity
Account Value Risk Profile
Account Value Risk Profile
(1)
(1)
Investor Day 6.18.2013
1)
As of end of period. |
 Edward Baird
Executive Vice President and
Chief Operating Officer, International
Prudential International Insurance |
 2
Investor Day 6.18.2013
Key Messages
•
Proven strategy and successful execution
•
High ROE, steady AOI growth, low volatility
•
Core Life Planner model supplemented by multiple channels
•
Leading position in Japan, expanding in other markets
|
 3
Investor Day 6.18.2013
Overview |
 4
Investor Day 6.18.2013
2012 Snapshot
Market Leader in Japan
Broad Channel & Product Diversification
2012 Operation Highlights
(1)
Annual Sales
In-force Policies
In-force Face Amount
Captive Agents
Bank Partners
Independent Agencies
Employees
Pre-Tax AOI
AOI
CAGR
(2007
-
2012)
ROE
$4 billion
12 million
$877 billion
~18,000
70+
~3,400
~28,000
$2.8 billion
15%
17.5%
1) Pre-tax Adjusted Operating Income (AOI) excludes Star / Edison integration costs and gains on
China Pacific investment. Return on Equity (ROE) is based on after-tax AOI excluding
aforementioned items and overall effective tax rate for the Financial Services Businesses. Foreign denominated activity and face
amount are translated into U.S. dollars at 2013 plan exchange rates including Japanese yen 80 per U.S.
dollar, and Korean won 1,160 per U.S. dollar. U.S. denominated activity is included based
on the amounts as transacted in U.S. dollars. |
 5
Investor Day 6.18.2013
Our Historical Strategy and
Business Model…
…Is the Foundation For Our
Evolving Strategy
•
Concentrate on a limited number of
attractive countries
•
Target the affluent and mass-
affluent consumer
•
Needs-based selling
•
Proprietary distribution based on
selective recruiting, professional
training, performance-based
variable compensation
•
Historical focus on death
protection insurance
•
Concentrate on a limited number of
attractive countries
•
Expand the breadth and depth of our
capabilities in those countries
-
Target middle to mass-affluent
consumer and small/medium
business market
-
Diversify distribution and products to
meet additional customer needs
•
Maintain our proven discipline,
quality, and execution
in all markets,
channels, products, and customer
relationships
The Evolution of our International Strategy
|
 6
Investor Day 6.18.2013
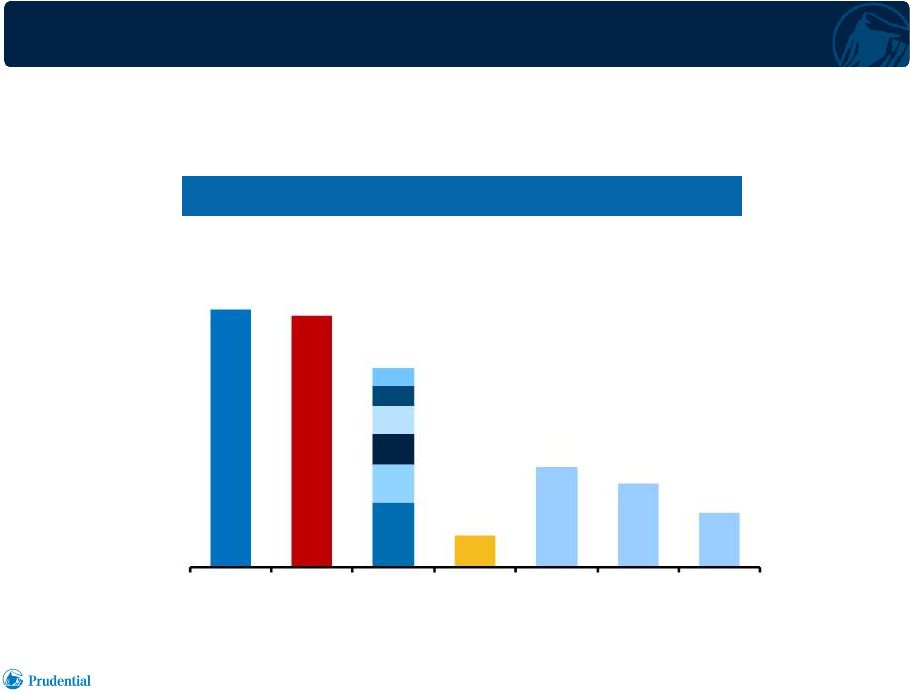
World Life Insurance Markets
•
Japan is the largest market in the world after the U.S.
•
South East Asia is growing fast, but the market size is still small (<2% of
world) 2011 Life Insurance Premiums
(1)(2)
($ billions)
$417
China
China
Korea
Korea
Taiwan
Taiwan
India
India
SE Asia
SE Asia
Other
Other
$538
$525
$65
$210
$175
$114
United
States
Japan
Asia ex
-
Japan
Latin
America
United
Kingdom
France
Germany
1)
Source: Swiss Re. Based on 2011 life premium volume, foreign denominated activity translated to
U.S. dollars at average exchange rates for 2011.
2)
World total life premiums are $2,627 billion. Chart not inclusive of the remainder of Europe,
Africa, Oceania and Canada. |
 7
Investor Day 6.18.2013
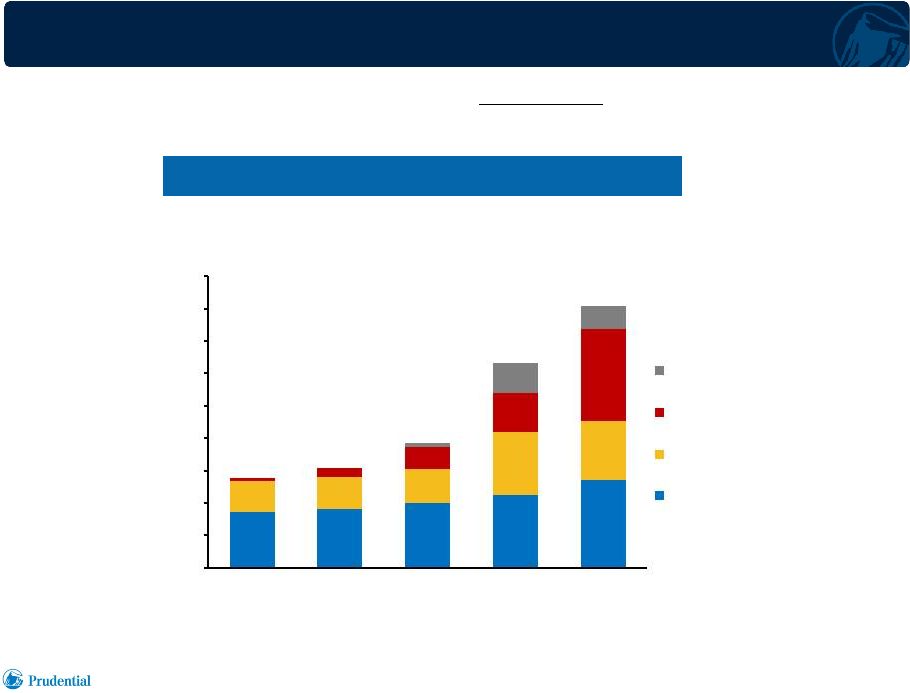
Growing Sales Throughout Multiple Channels
Annualized New Business Premiums
(1)
$1,389
$1,545
$1,929
$3,157
$4,051
•
Bank
and
Independent
Agency
channels
supplement
tied
agency
channels
($ millions)
$-
$500
$1,000
$1,500
$2,000
$2,500
$3,000
$3,500
$4,000
$4,500
2008
2009
2010
2011
2012
Independent Agency
Bank
Life Consultant
Life Planner
1)
Foreign denominated activity translated to U.S. dollars at uniform exchange rates for all periods
presented; Japanese yen 80 per U.S. dollar; Korean won 1,160 per U.S. dollar. |
 8
Investor Day 6.18.2013
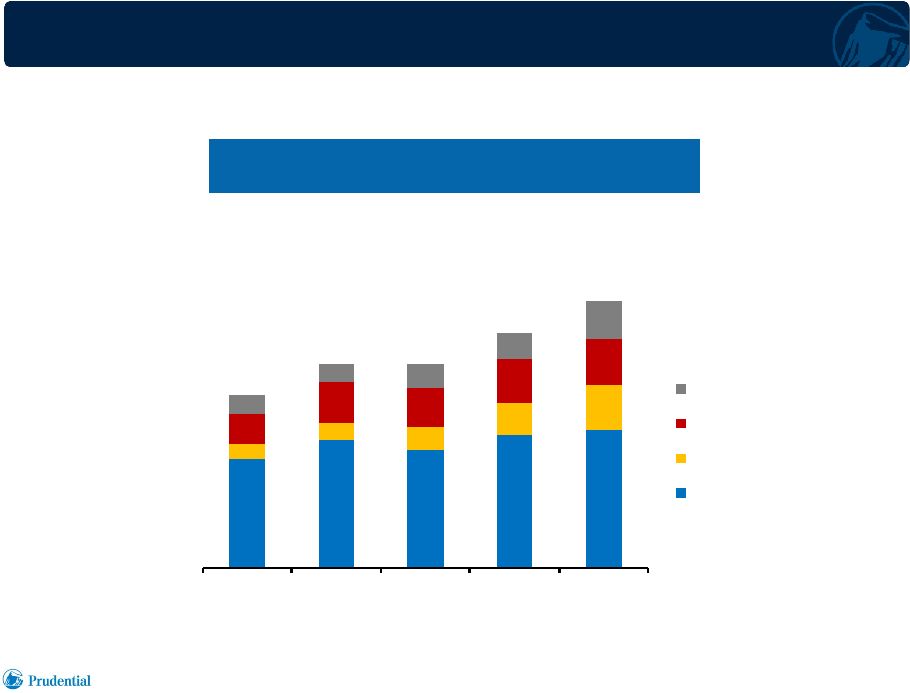
2008
2009
2010
2011
2012
All Others
Taiwan
Brazil
Korea
Japan Success Supplemented by Other Markets
1)
Foreign denominated activity translated to U.S. dollars at uniform exchange rates
for all periods presented; Korean won 1,160 per U.S. dollar. Annualized New
Business Premiums (1)
Ex Japan
$355
$311
$270
$271
$229
($ millions) |
 9
Investor Day 6.18.2013
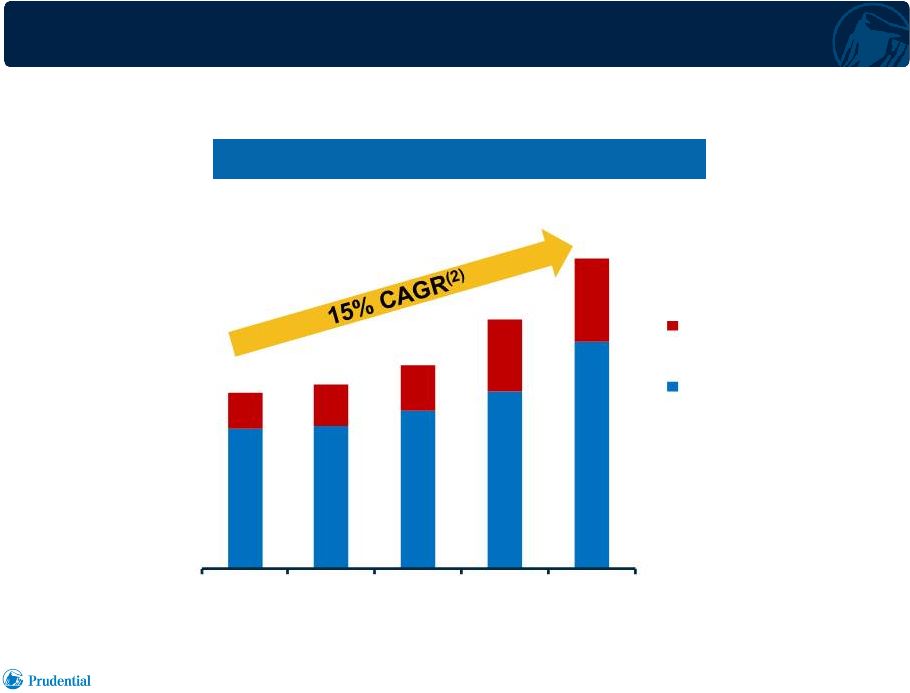
Sustained Earnings Growth Through
Challenging Markets and Events
Pre-Tax Adjusted Operating Income
(1)
($ millions)
$1,581
$1,651
$1,821
$2,239
$2,782
2008
2009
2010
2011
2012
Investment Margin
Mortality, Expense
& Other Margin
1)
Pre-tax AOI excludes the net of Star / Edison transaction and integration costs and gains on
China Pacific investment of $66 million in 2010, $24 million in 2011, and $(78) million in
2012.
2)
CAGR based on 2007 – 2012 (5 Year). |
 10
Investor Day 6.18.2013
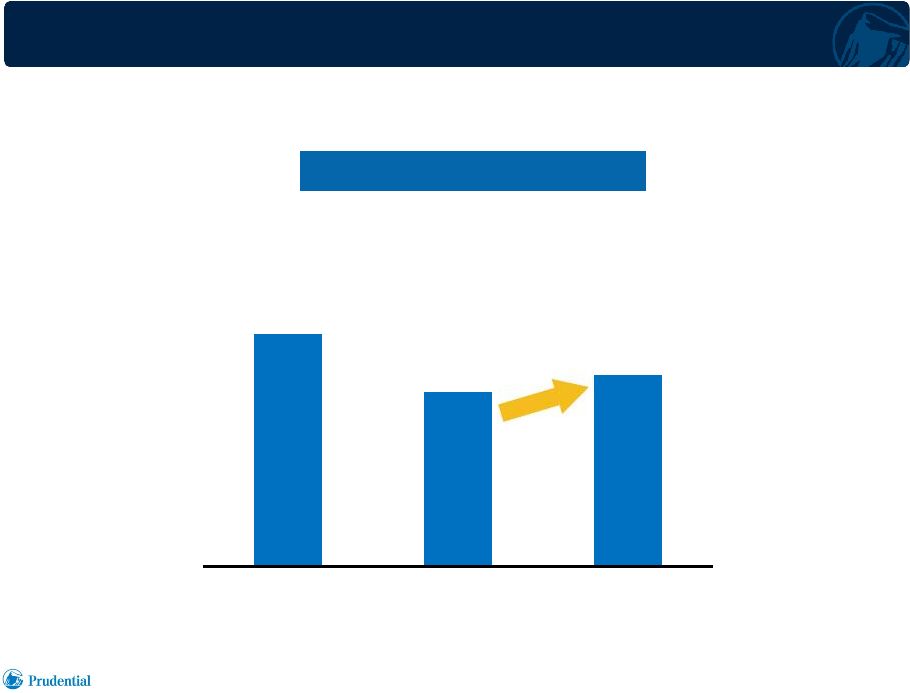
21.2%
15.9%
17.5%
2010
2011
2012
High Return on Equity Driven by Fundamentals
Return on Equity
(1)
•
Star / Edison integration contributes to ROE performance
1)
Based on after-tax AOI of our International Insurance operations excluding Star / Edison
transaction and integration costs and gains on China Pacific investment, using overall
effective tax rate for the Financial Services Businesses and associated attributed equity. |
 11
Investor Day 6.18.2013
Life Planner / Prudential of Japan |
 12
Investor Day 6.18.2013
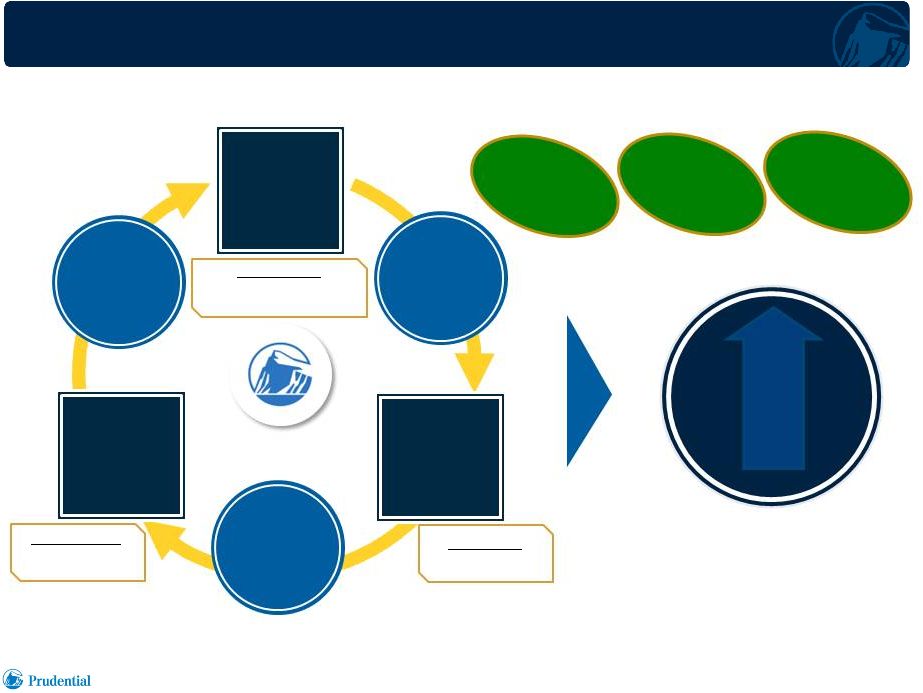
Beneficial Cycle of Life Planner Model
Superior
Returns &
Steady
Growth
•
Providing financial security over lifetime of customers drives our beneficial
cycle High Income
for Life
Planner
High
Customer
Satisfaction
Quality
Referrals
Productivity
$26,700 AP per LP month
7.5 policies per LP month
(1)
Retention
90.5%
(1)
Persistency
95.0%
(1)
High Life
Planner
Retention
High Policy
Persistency
Quality
People
Quality
Products
Quality
Service
High Life
Planner
Productivity
1)
Data based on 2012 Prudential of Japan (POJ). Annualized new business
premiums produced by each Life Planner (LP) in a month; foreign denominated activity
translated to U.S. dollars at uniform exchange rate, Japanese yen 80 per U.S.
dollar. Number of new policies sold per LP per month, including medical and cancer
policies.
Total
retention
for
agents
in
all
service
years.
13
month
policy
persistency
measured
based
on
face
amount,
12-month
rolling
average
data.
th |
 13
Investor Day 6.18.2013
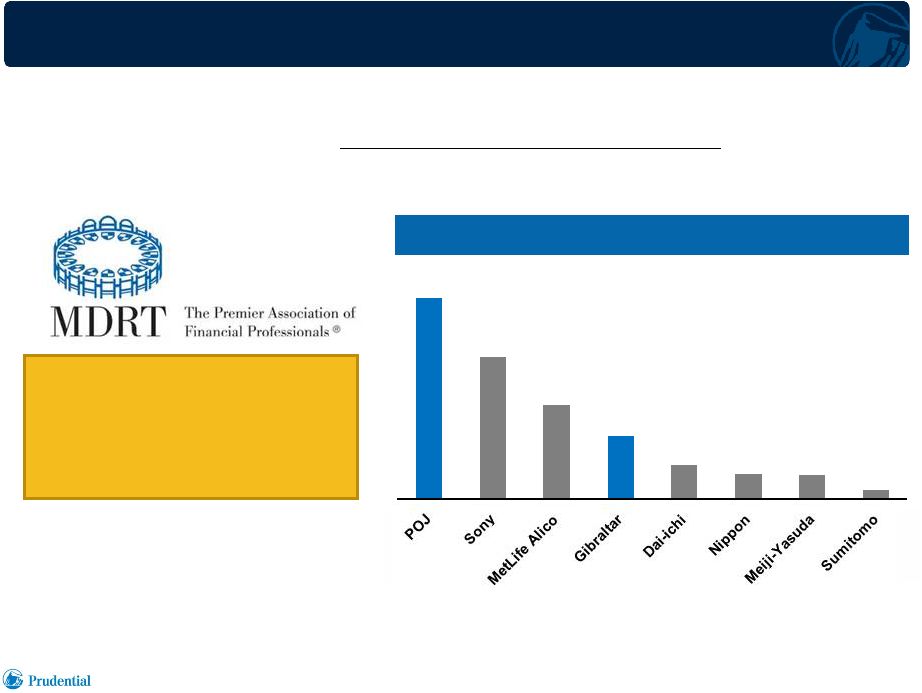
Quality People
•
Industry leading Million Dollar Round Table memberships
•
Prudential of Japan has the highest number of MDRT members in the Japanese
industry for 16 consecutive years
(1)
1)
Source:
Million
Dollar
Round
Table
Association,
Japan
-
membership
data
as
of
4/18/13.
MDRT Japan Membership
(1)
29% of POJ Life Planners
are MDRT members –
Highest percentage
in industry
(1)
945
665
445
300
157
115
111
43 |
 14
Investor Day 6.18.2013
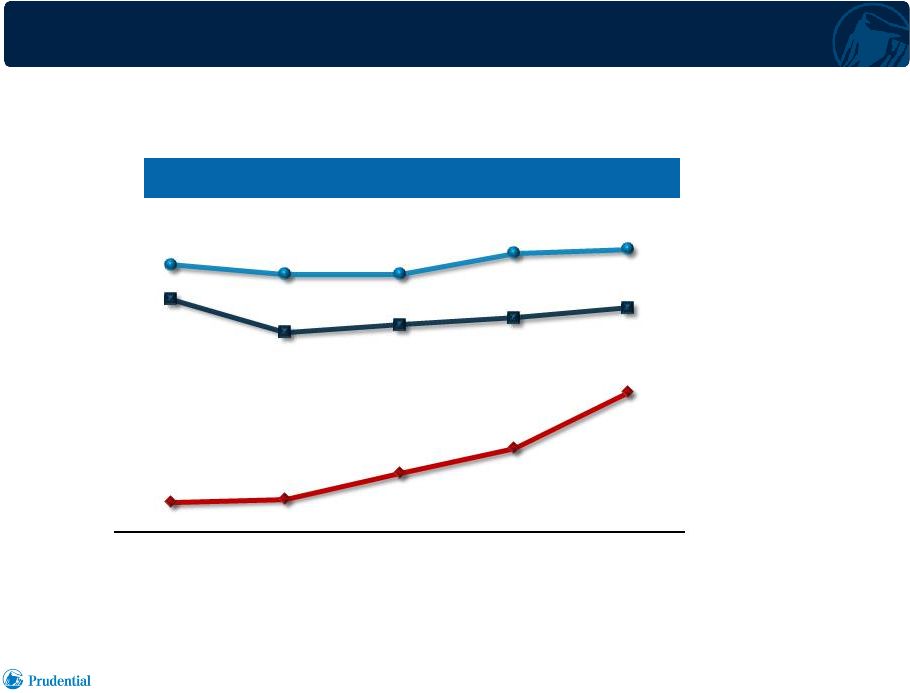
Quality Business
Prudential of Japan
12 Month LP Retention
(1)
Total LP Retention
(1)
Life Planner AP Productivity
(1)
•
Quality focused Life Planner operation drives both the top-line and the
bottom- line growth
Total LP Retention
(1)
2008
2009
2010
2011
2012
$17,500
$17,800
$19,900
$22,000
$26,700
83.3%
78.7%
79.7%
80.7%
82.1%
88.3%
87.0%
87.0%
89.9%
90.5%
th
1)
Annualized new business premiums produced by each LP in a month. Total LP retention for Life Planners
in all service years; percentage of Life Planners at beginning of year who are still active at
end of year. 12th month LP retention based on 12-month rolling average data. |
 15
Investor Day 6.18.2013
Quality Service
1)
J.D.
Power
Asia
Pacific
2011
-
2013
Japan
Life
Insurance
Contract
Satisfaction
Studies
SM
and
2011
-
2013
Japan
Life
Insurance
Claim
Satisfaction
Studies
SM
.
Contract Satisfaction Study based on a total of 4,490 life insurance policyholders
who purchased or renewed coverage during the past year. Claim Satisfaction Study
based on a total of 3,776 policyholders who filed claims for medical benefits
during the past year. japan.jdpower.com 2)
13 month policy persistency for 2012.
•
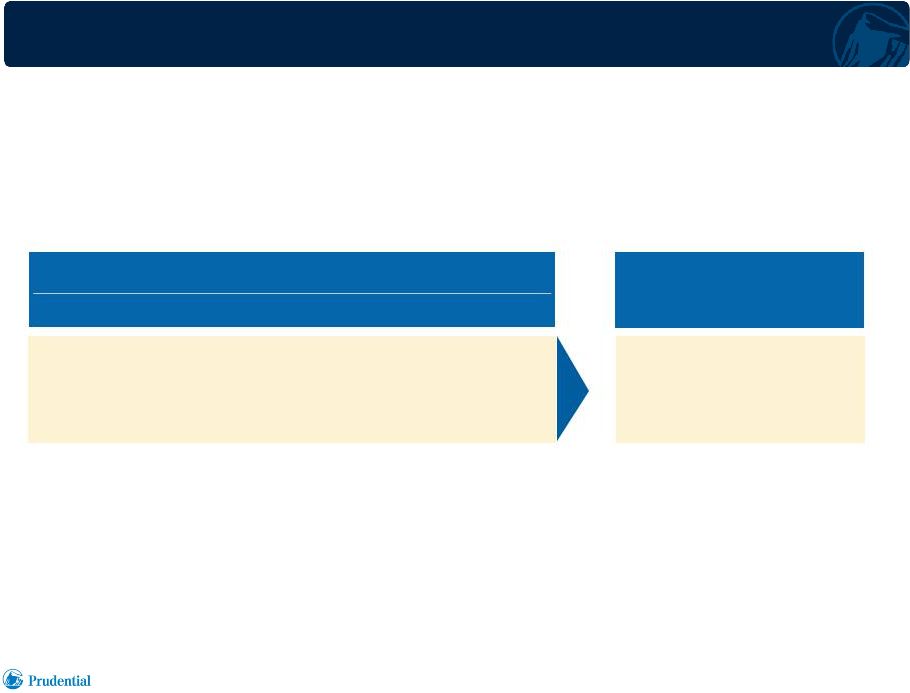
According to J.D. Power Asia Pacific, Prudential of Japan is the
highest in
customer satisfaction for three years in a row
•
Satisfied customers, high policy persistency
#1
Customer Satisfaction
(1)
Policy
Persistency
(2)
95%
2011
2012
2013
#1
#1
th |
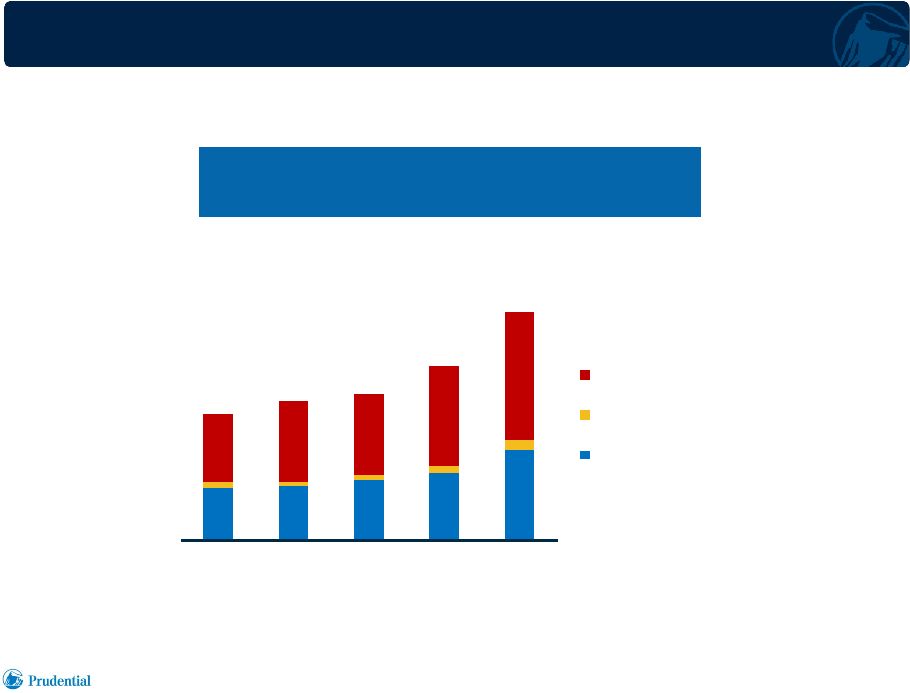 16
Investor Day 6.18.2013
2008
2009
2010
2011
2012
Retirement
Accident & Health
Death Protection
Current Customers are Excellent Prospects
for Additional Coverage to Meet Needs
Annualized New Business Premiums
(1)
POJ Second Sales to Existing Customers
1)
Data
based
on
Prudential
of
Japan
sales
to
individual
market;
foreign
denominated
activity
translated
to
U.S.
dollars
at
uniform
exchange
rates;
Japanese
yen
80 per U.S. dollar.
$107
$118
$123
$147
$192
($ millions) |
 17
Investor Day 6.18.2013
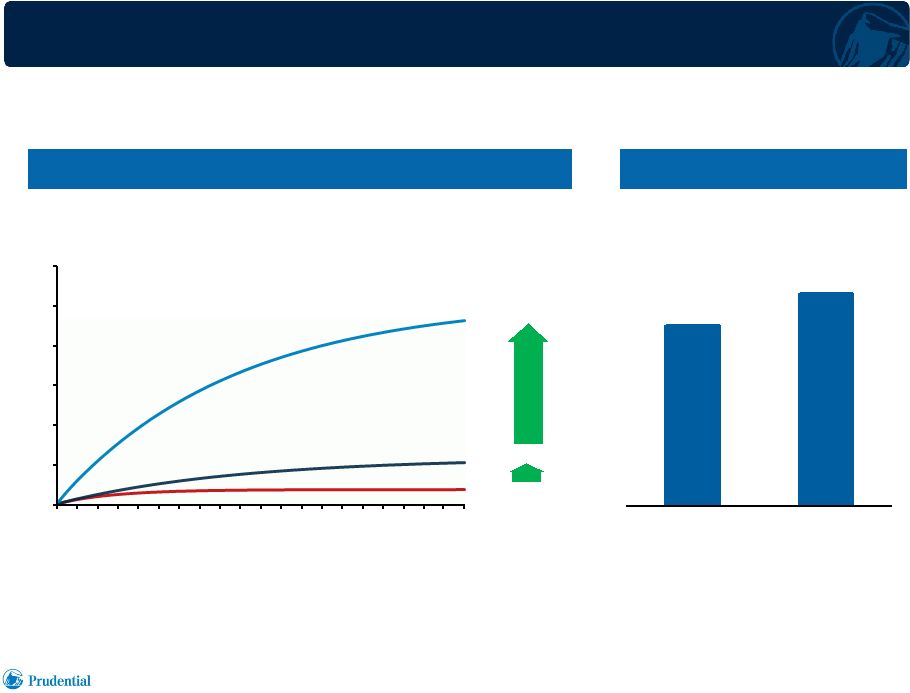
Payoff from Quality
•
Superior business drivers of LP model significantly increase the
lifetime
production of agent
Lifetime Sales of Agents
(1)
1)
Assumptions for traditional agent: AP Productivity = $6,000 per month; Agent
Retention (Year 1/ Year 2/ Year 3+) = 55%/ 60%/ 80% POJ LP: AP Productivity =
$26,700 per month; Agent Retention (Year 1/ Year 2/ Year 3+) = 82%/ 80%/ 91%
POJ Life Planners
Traditional Agent
+ LP Retention
+ LP Productivity
$0.2 million
$0.6 million
$2.3 million
0.0
0.5
1.0
1.5
2.0
2.5
3.0
0
1
2
3
4
5
6
7
8
9
10
11
12
13
14
15
16
17
18
19
20
Cumulative Sales
($ millions)
Service Year
3,165
3,284
1Q12
1Q13 |
 18
Investor Day 6.18.2013
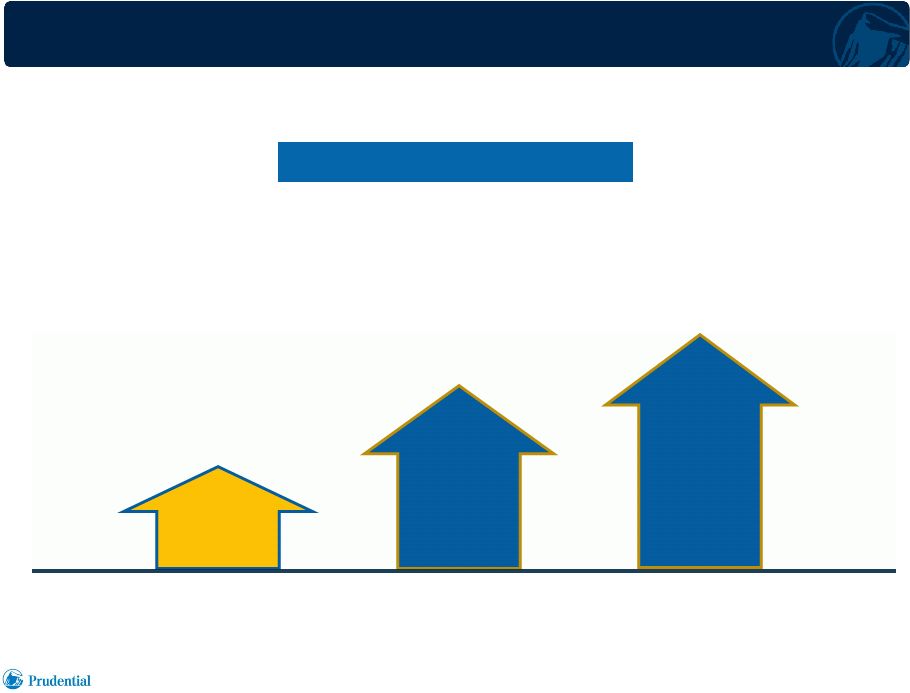
Life Planner Model Growth –
Business Drivers
•
Life Planner growth + productivity improvement results in superior performance
Number of
Life Planners
AP Productivity
Annualized New
Business
Premiums
(1)
6,166
7,058
$16,600
$12,800
$899m
$1,347m
3%
3%
5%
5%
8%
8%
1)
Foreign
denominated
activity
translated
to
U.S.
dollars
at
uniform
exchange
rates
for
all
periods
presented;
Japanese
yen
80
per
U.S.
dollar;
Korean won 1,160 per U.S. dollar.
5 Year CAGR (2007 –
2012) |
 19
Investor Day 6.18.2013
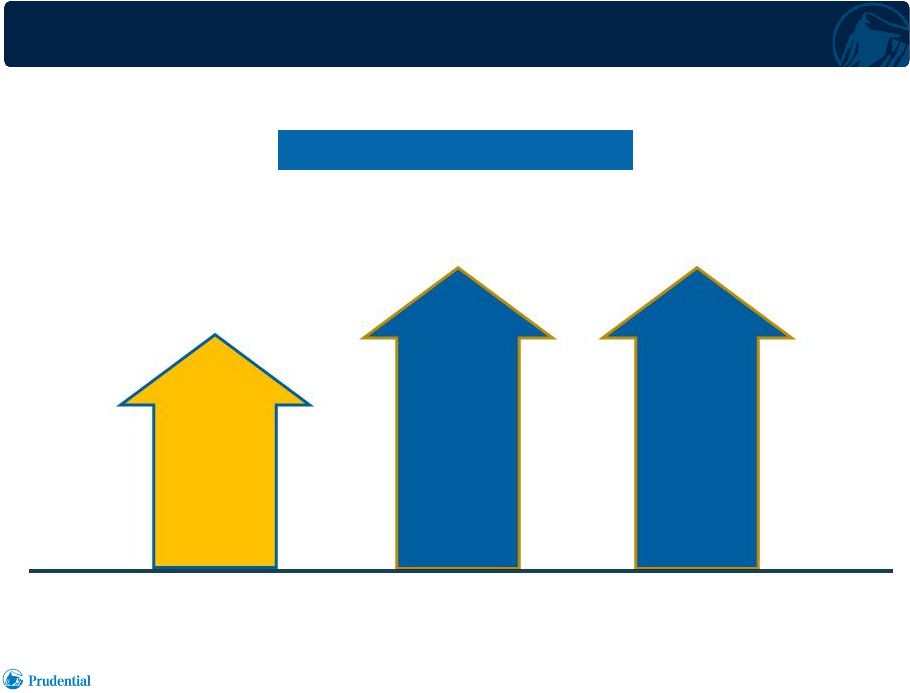
Life Planner Model Growth –
Financial Performance
•
Sales growth + high persistency results in strong financial performance
Operating Revenue
(2)
Pre-tax Adjusted
Operating Income
$5,407m
$9,002m
$867m
$1,481m
11%
11%
11%
11%
5 Year CAGR (2007 –
2012)
Annualized New
Business Premiums
(1)
$899m
$1,347m
8%
8%
1)
Foreign denominated activity translated to U.S. dollars at uniform exchange rates for all periods
presented; Japanese yen 80 per U.S. dollar; Korean won 1,160 per U.S. dollar.
2)
Reported basis – translated based on applicable average exchange rates for respective
periods. |
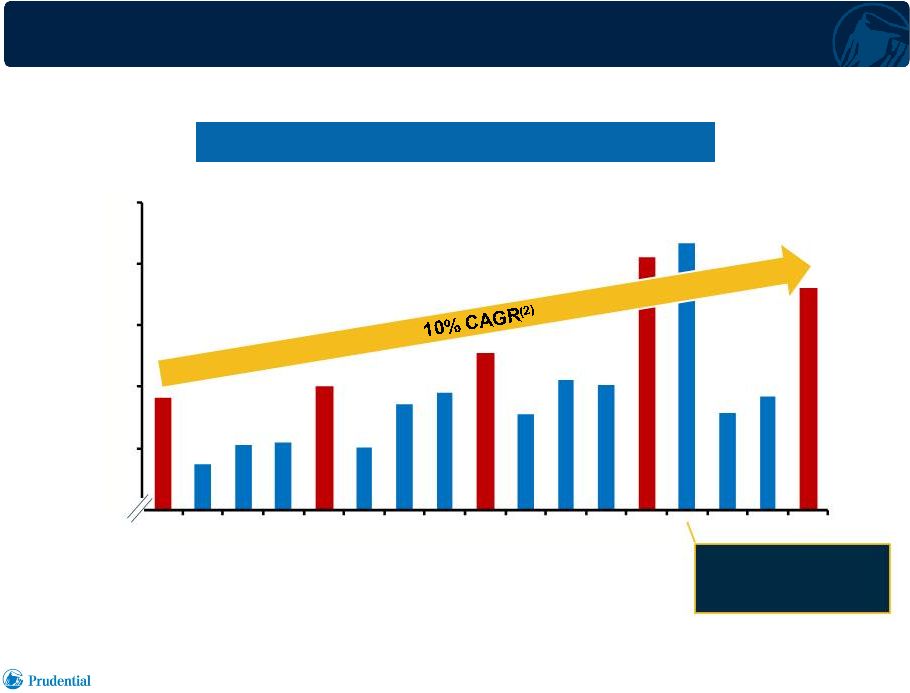 20
Investor Day 6.18.2013
Prudential of Japan Sales Trend
Annualized New Business Premiums
(1)
($ millions)
$100
$150
$200
$250
$300
$350
1Q09
1Q10
1Q11
1Q12
1Q13
Higher than run-rate due to:
-
USD product re-pricing
-
Tax law change
1)
Foreign denominated activity translated to U.S. dollars at uniform exchange rates for all periods
presented; Japanese yen 80 per U.S. dollar.
2)
CAGR based on 2009 – 2013 (1Q). |
 21
Investor Day 6.18.2013
Gibraltar Life |
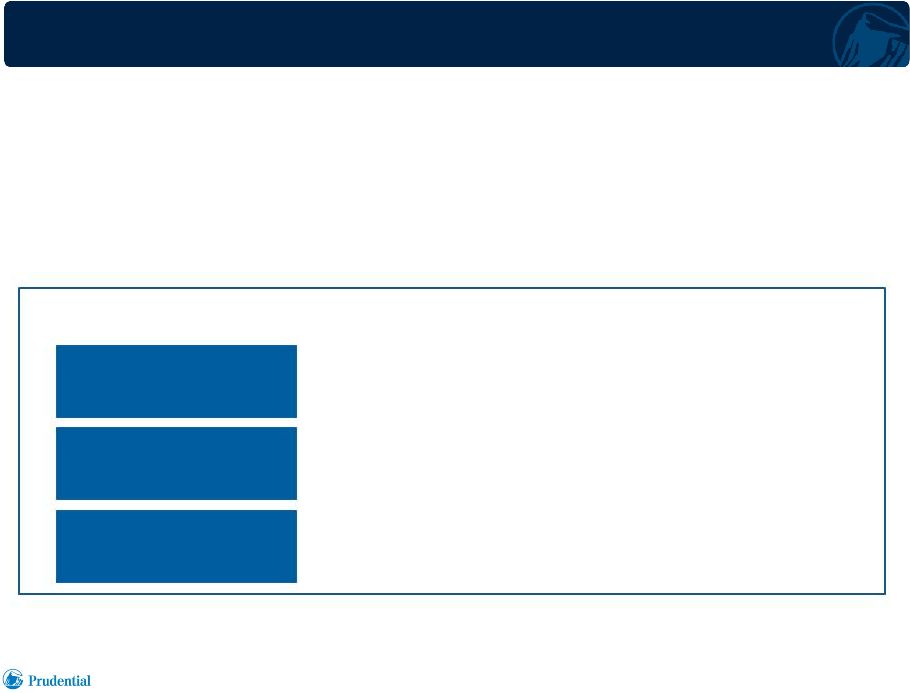 22
Investor Day 6.18.2013
$315 million
$400 million
$250 million
Integration Progress by Numbers…
•
Incurred integration costs through 1Q13
•
Total expected pre-tax integration costs
•
Down $100 million from original estimate
•
Targeted annual cost savings
•
~80% realized by 2012, 90% by 2013 on a run-rate basis
•
Continue to “Prudentialize”
sales force
•
De-risked investment portfolio to align with Prudential standards
•
Replaced lower margin product portfolio with higher margin products
•
Enhanced risk management and internal controls
Star/Edison Integration Substantially Complete |
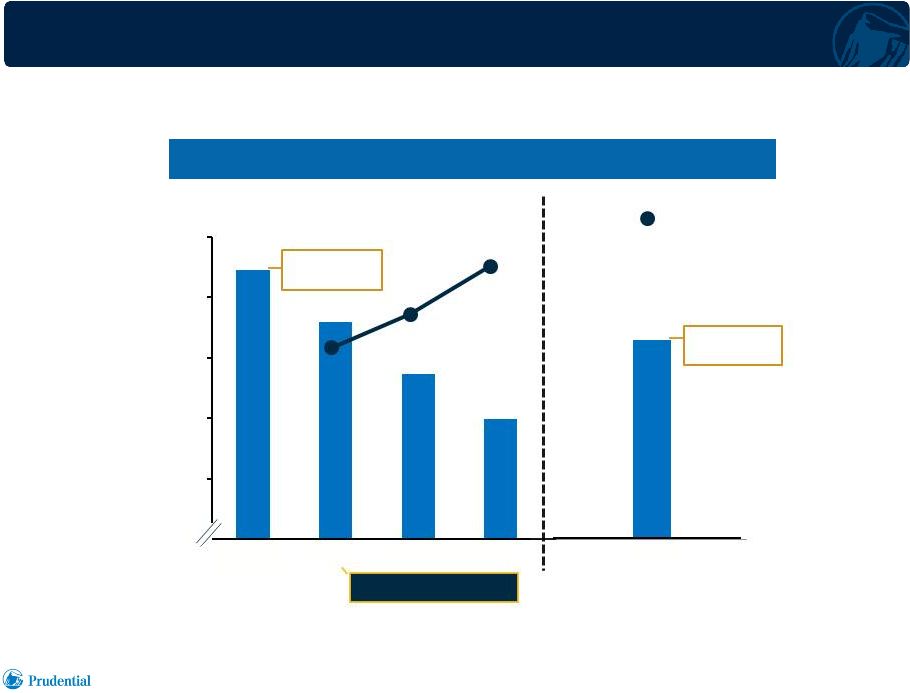 23
Investor Day 6.18.2013
Gibraltar
Life
–
Life
Consultant
Count
and
Sales
Historical Life Consultant Count & Sales
•
Acquired Kyoei Life in 2001 –
Life Consultant count reduced while sales grew
Annualized
New Business
Premiums ($m)
(1)
LC
(3)
Count
6,281 LC’s
in Dec. 2010
$132
(2)
2010
3,000
4,000
5,000
6,000
7,000
8,000
$68
$80
$97
Apr-01
3Q01
1Q02
1Q03
7,457 LC’s
in April 2001
First full quarter sales
1)
Foreign denominated activity translated to U.S. dollars at uniform exchange rates for all periods
presented; Japanese yen 80 per U.S. dollar.
2)
Average quarterly annualized new business premiums in 2010.
3)
Life Consultant (LC). |
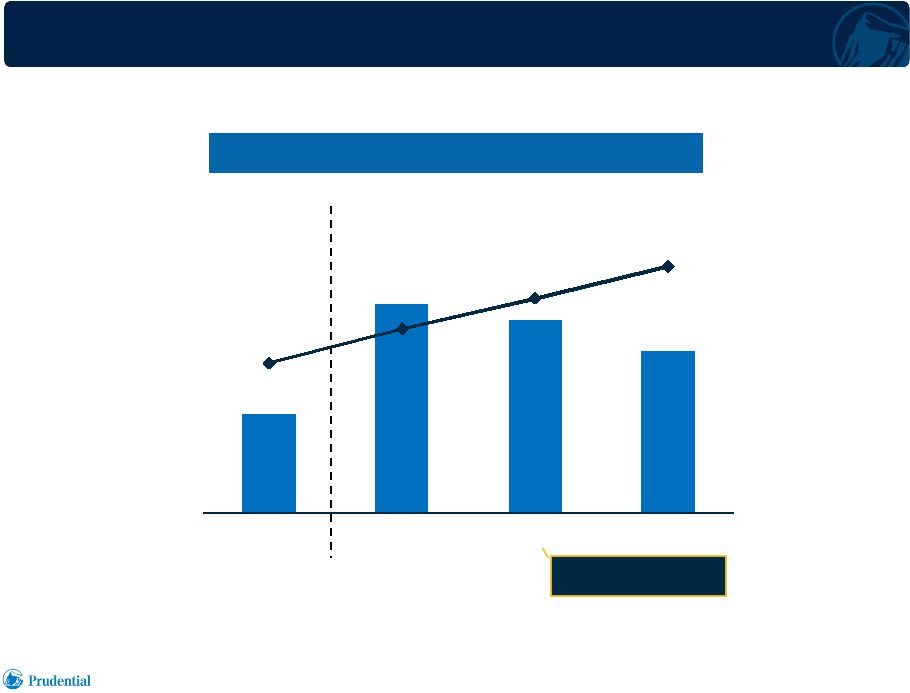 24
Investor Day 6.18.2013
6,281
13,227
12,219
10,252
$132
$162
$189
$217
2010
1Q11
1Q12
1Q13
Gibraltar
Life
–
Post
Star/Edison
Acquisition
•
Acquired Star and Edison in February 2011, added 7,300 agents upon acquisition
Life Consultant Count & Sales
Annualized
New Business
Premiums
($m)
(1)
LC Count
(2)
(3)
1)
Foreign denominated activity translated to U.S. dollars at uniform exchange rates for all periods
presented; Japanese yen 80 per U.S. dollar.
2)
One month of sales activities from Star and Edison included, due to one month lag reporting.
3)
Average quarterly annualized new business premiums in 2010.
Gibraltar / Star / Edison
Merge Implemented |
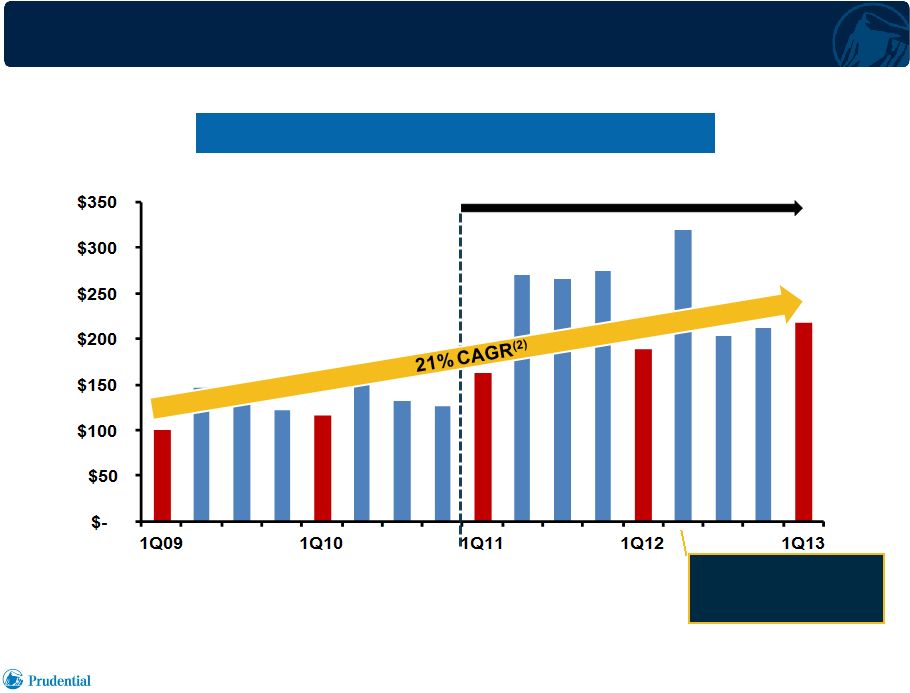 25
Investor Day 6.18.2013
Life Consultant Sales Trend
1)
Foreign
denominated
activity
translated
to
U.S.
dollars
at
uniform
exchange
rates
for
all
periods
presented;
Japanese
yen
80
per
U.S.
dollar.
2)
CAGR
based
on
2009
–
2013
(1Q).
($ millions)
Annualized New Business Premiums
(1)
Higher than run-rate due to:
-
USD product re-pricing
-
Tax law change
Post Star/Edison Acquisition |
 26
Investor Day 6.18.2013
Bank Channel |
 27
Investor Day 6.18.2013
Bank Channel Distribution Brings Growth & Challenges
•
Enhances access to expanded
customer base
and investable
wealth
•
Strong growth potential
through
development of new banking
relationships
•
Competitive product portfolio
meets bank customer needs
•
Strong brand name attracts
security focused customers
•
Leverages infrastructure costs
Advantages
•
Less influence over distribution
•
Sales can be volatile
due to
changes in interest rates and
competitor actions
•
Profitability
can vary with
changes in product mix
Challenges |
 28
Investor Day 6.18.2013
Bank Channel Distribution –
Prudential’s Response
•
Focused on profitable growth
•
Supplemental to captive channels
•
Actively manage the channel
–
Attractive margins Active in the
market –
Unattractive margins Willing to pull
back •
Recent actions in response to interest rate declines
–
Sales caps
–
Lowered guaranteed interest rate on yen single premium whole life from
1.0% to 0.8%
–
Reduced commission rates
•
Will not compete based on price |
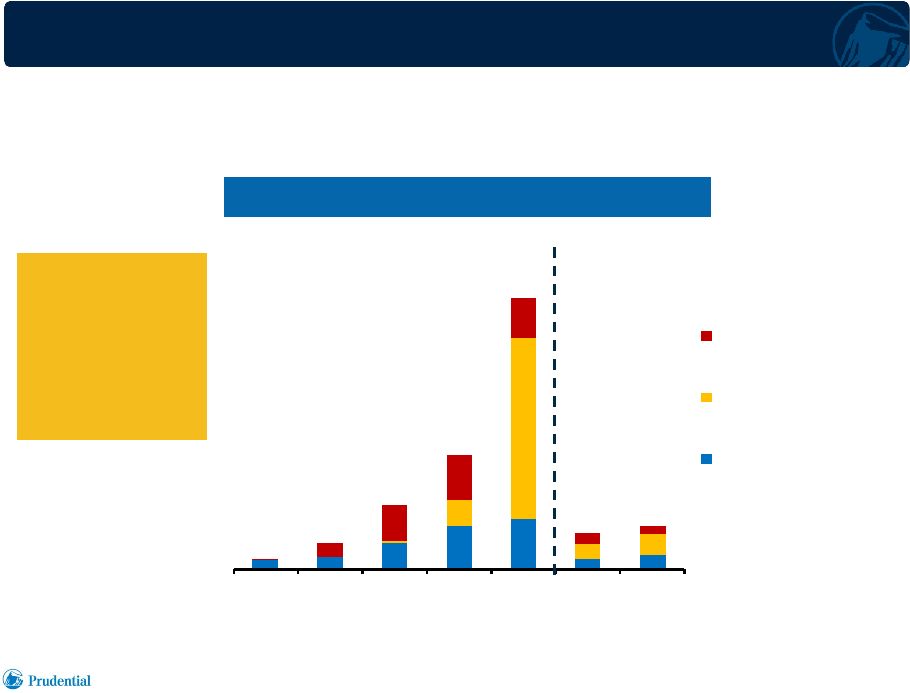 29
Investor Day 6.18.2013
2008
2009
2010
2011
2012
1Q12
1Q13
USD Whole Life &
Retirement Income
JPY Single Premium
Whole Life
All Other
Bank Channel Sales Growth
Annualized New Business Premiums
(1)
($ millions)
$56
$138
$341
$600
$1,422
$190
$223
•
Significant sales growth in 2011 and 2012 driven by JPY single premium
whole life
•
Partnering with all mega-banks in Japan. 70+ bank partners in
total. Sales of JPY
single premium
whole life have
declined in 2013
following the
re-pricing
in January
1)
Foreign denominated activity translated to U.S. dollars at uniform exchange rates for all periods
presented; Japanese yen 80 per U.S. dollar. |
 30
Investor Day 6.18.2013
Affluent
Strategic Expansion Framework
Death protection
Customer
Segment
Whole life & Term
Primary
Customer
Needs
Product
Solution
•
Meeting evolving customer needs through product and channel expansion
Life Planner
+ Mass affluent
+ Business owners
+ Retirement
+ Business planning
+ Accident & Health
+ Retirement income
+ USD products
Distribution |
 31
Investor Day 6.18.2013
Affluent
Strategic Expansion Framework
Death protection
Customer
Segment
Whole life & Term
Primary
Customer
Needs
Product
Solution
+ Middle class
+ Teachers
•
Meeting evolving customer needs through product and channel expansion
Life Planner
Life Consultant
+ Mass affluent
+ Business owners
+ Retirement
+ Business planning
+ Accident & Health
+ Retirement income
+ USD products
Distribution
+ Multi-currency fixed
annuity
Death protection
+ Retirement
Whole life & Term
+ Accident & Health
+ Retirement income
+ USD products |
 32
Investor Day 6.18.2013
Affluent
Strategic Expansion Framework
Death protection
Customer
Segment
Whole life & Term
Primary
Customer
Needs
Product
Solution
3
Party Channels
Bank / Independent Agency
+ High net worth
+ Savings
+ Single pay insurance
+ Middle class
+ Teachers
•
Meeting evolving customer needs through product and channel expansion
Captive Channels
Life Planner
Life Consultant
+ Mass affluent
+ Business owners
+ Retirement
+ Business planning
+ Accident & Health
+ Retirement income
+ USD products
Distribution
+ Multi-currency fixed
annuity
Death protection
+ Retirement
Whole life & Term
+ Accident & Health
+ Retirement income
+ USD products
+ Business owners
Death protection
+ Retirement
+ Business planning
+ Multi-currency fixed
annuity
Whole life & Term
+ Accident & Health
+ Retirement income
+ USD products
rd |
 33
Investor Day 6.18.2013
FX, Interest Rate Environment and Capital |
 34
Investor Day 6.18.2013
Foreign Currency Risk Management
Potential Exposure
Risk Management
Asset-Liability
Management
Well Matched FX
Shareholder Value in US$
Comprehensive
Hedging Program
Accounting
Remeasurement
Non-Economic Noise
•
Income and Cash Flow
•
Equity Value |
 35
Investor Day 6.18.2013
Japanese Yen Income Hedge
•
Roughly 50% of Japan’s earnings are Yen-based
•
Yen-based
AOI
is
hedged
over
a
36
month
rolling
basis
using
a
series
of
FX
forwards
with
laddered maturities
•
The Yen plan rate is derived from the weighted average hedged rate
•
Hedging Yen-based AOI protects the USD value of Japan capital
repatriation 2013
2014
2015
2016
% of Yen AOI Hedged
(1)
100%
~80%
~35%
~5%
Plan Rates (¥/$)
¥80
1)
Percentage of expected yen-based adjusted operating income hedged as of
3/31/13. Income Hedges |
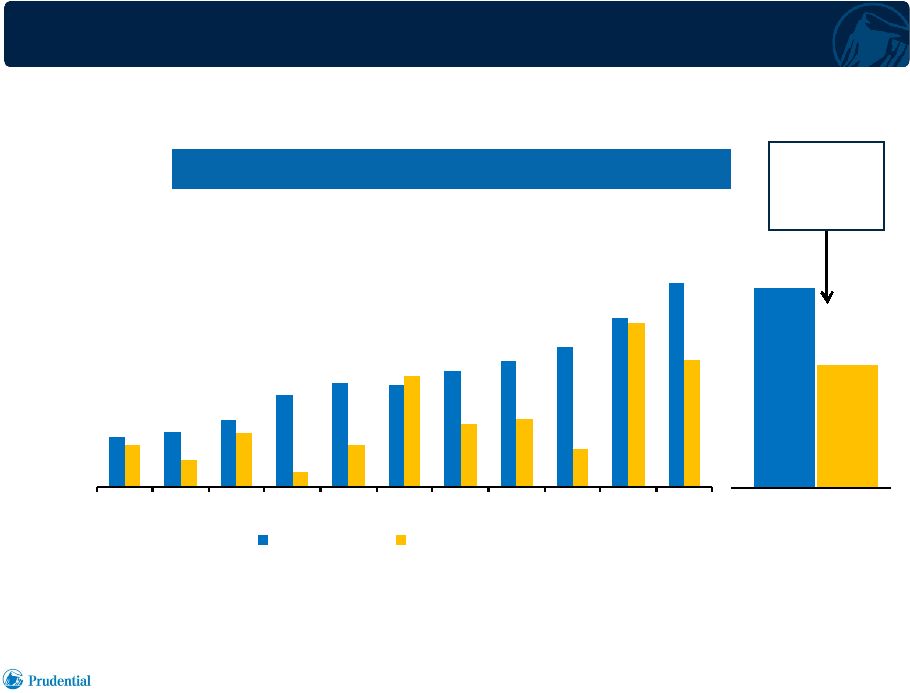 36
Investor Day 6.18.2013
502
550
669
921
1,041
1,016
1,153
1,248
1,393
1,679
2,025
419
273
541
151
414
1,104
627
683
384
1,631
1,257
2002
2003
2004
2005
2006
2007
2008
2009
2010
2011
2012
After-Tax AOI
Capital Redeployed
12,197
7,484
High Capital Redeployment
Historical Capital Redeployment
•
International Insurance operations have redeployed excess capital equal to 61%
of After-tax AOI since 2002
(1)
(2)
($ millions)
1)
Years 2007 –
2011 have been restated for U.S. GAAP accounting standards applicable to deferred
policy acquisition costs (DAC) effective 1/1/12. Years 2002 –
2006 have not been restated. After-tax AOI is based on overall FSB
effective tax rates. 2)
Primarily includes dividends, affiliated debt repayment, and affiliated lending.
2011 capital redeployment also includes $800 million of capital that was used to
partially fund the Star and Edison acquisition.
61% of
After-tax
AOI
Cumulative 2002 -
2012 |
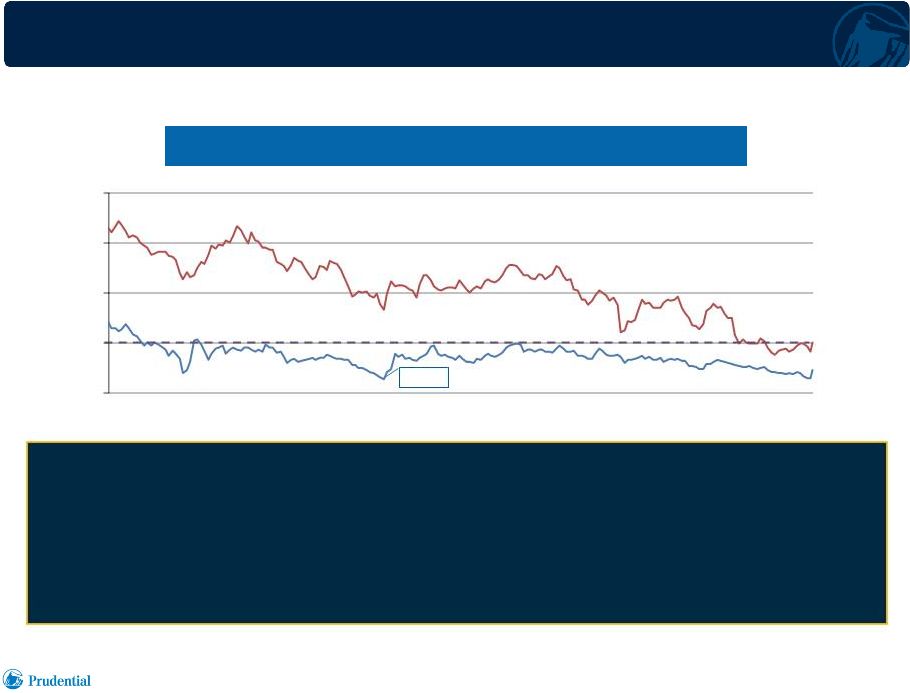 37
Investor Day 6.18.2013
Interest Rate Environment
•
Interest rates in Japan have been low for more than fifteen years
1)
For new business, commencing second quarter 2012.
Historical 10 Year Government Bond Yield
Historical 10 Year Government Bond Yield
•
High quality long duration investment portfolio
•
Recently
lowered
guaranteed
crediting
rates
of
U.S.
dollar
products
(1)
•
Protection product profitability relatively less sensitive to interest rates
•
Fixed annuity designed to mitigate interest rate risk
Prudential’s Position
JGB
UST
0.54%
0%
2%
4%
6%
8%
1997
1999
2001
2003
2005
2007
2009
2011
2013 |
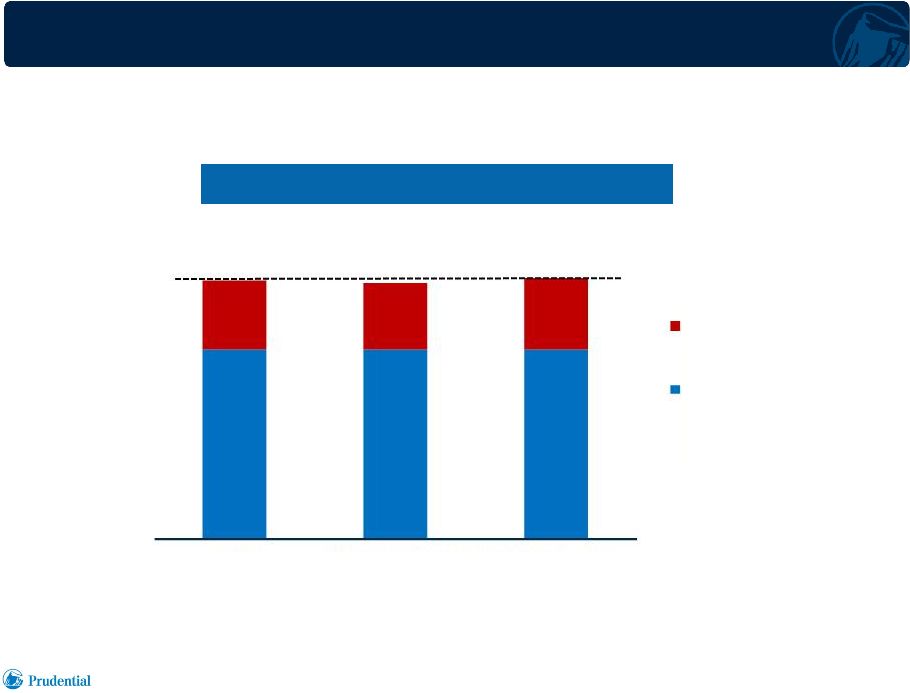 38
Investor Day 6.18.2013
1)
Pre-tax AOI excludes the net of Star / Edison integration costs and
gains on China Pacific investment of $(78) million. The analysis represents
assumed investment of renewal premiums and reinvestment of investment income
and proceeds from maturing investments at market interest rates 50 bps higher or lower
than actual rates during the year.
Pre-Tax Adjusted Operating Income
(1)
($ millions)
$2,782
•
In the near-term, earnings are not materially impacted by modest changes in
interest rates •
+/-
50 bps = ~$25m in near-term, or ~1% of pre-tax AOI
$2,757
$2,807
Impact of Changing Interest Rate Environment
2012
2012 if interest rates
reduced 50 bps
2012 if interest rates
increased 50 bps
Investment Margin
Mortality, Expense
& Other Margin |
 39
Investor Day 6.18.2013
Solvency Margin Ratio
March 31, 2013
749%
Prudential of Japan
Gibraltar
(1)
896%
Stressed Scenario
~625%
~800%
1)
Gibraltar consolidated basis.
2)
Represents indicated change applied to asset valuation as of 3/31/13.
•
Solvency
margin
position
of
Prudential’s
Japanese
companies
–
well
capitalized
and financially secure
SMR
Stressed Scenario
(2)
•
Japan Equity
•
Real Estate
•
USD & AUD Exchange Rates
•
Interest Rates
Down 55%
Down 35%
Weakening 20%
Up 100 bps |
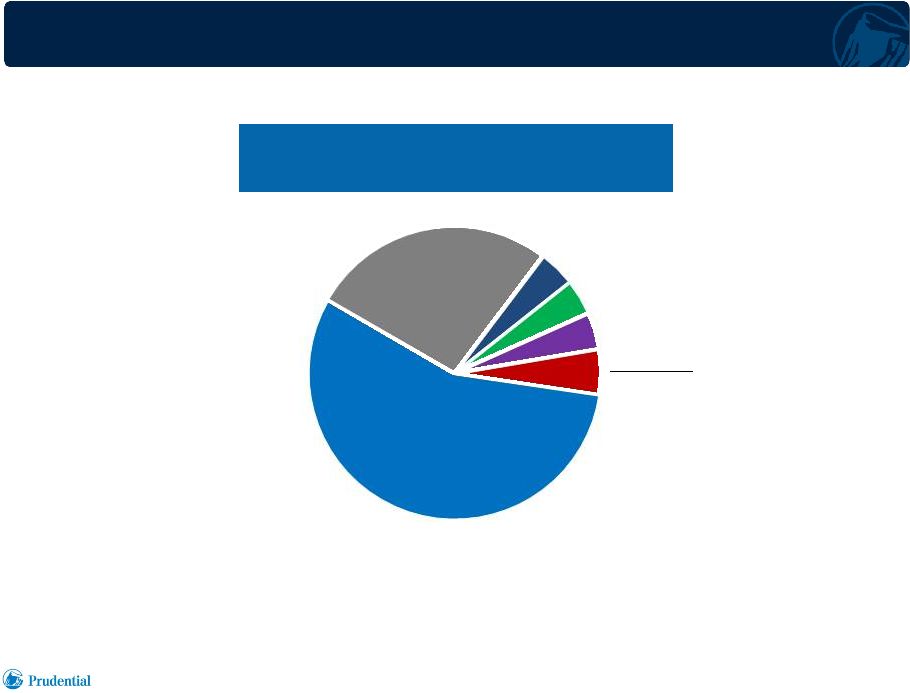 40
Investor Day 6.18.2013
High Quality Investment Portfolio
Japan Investment Portfolio
(1)
$146 billion
1)
As of 3/31/13, at balance sheet carrying amount.
2)
Includes commercial/residential mortgage backed securities and asset backed
securities. 3)
Includes commercial/residential mortgage loans.
4)
Includes
trading
account
assets
supporting
insurance
liabilities
and
policy
loans.
Corporate Bonds
(Investment Grade)
2% Corporate Bonds (Below Investment Grade)
2% Equities
1% Real Estate
Structured Securities
(2)
Commercial Loans
(3)
Risk Assets
Other
(4)
Government
(JGB & UST)
27%
4%
4%
4%
5%
56% |
 41
Investor Day 6.18.2013
Key Takeaways
•
Solid business model with sustained track record of success
•
High ROE, steady AOI growth, low volatility: returns and earnings primarily
the result of stable drivers
•
Leading position in Japanese market (second largest market in the world),
strengthened by Star / Edison acquisition
•
Competitive advantages in distribution based on core Life Planner model, coupled
with financial strength and reputation, driving growth across multiple
channels •
Strong growth prospects enhanced by product portfolio serving lifetime financial
security needs |