EX-99.1
Published on
 PRUDENTIAL FINANCIAL, INC.
INVESTOR DAY
June 4, 2014
Exhibit 99.1 |
 PRUDENTIAL FINANCIAL, INC.
INVESTOR DAY
ERIC DURANT
SENIOR VICE PRESIDENT
INVESTOR RELATIONS |
 FORWARD-LOOKING STATEMENTS
1
Investor Day 6.4.2014
Certain of the statements included in this presentation constitute forward-looking statements
within the meaning of the U. S. Private Securities Litigation Reform Act of 1995. Words such as
“expects,” “believes,” “anticipates,” “includes,” “plans,” “assumes,” “estimates,” “projects,” “intends,”
“should,” “will,” “shall” or variations of such words are generally part
of forward-looking statements. Forward-looking statements are made based on
management’s current expectations and beliefs concerning future developments and their potential effects upon Prudential Financial, Inc. and
its subsidiaries. There can be no assurance that future developments affecting Prudential
Financial, Inc. and its subsidiaries will be those anticipated by management. These
forward-looking statements are not a guarantee of future performance and involve risks and uncertainties, and
there are certain important factors that could cause actual results to differ, possibly materially,
from expectations or estimates reflected in such forward-looking statements, including,
among others: (1) general economic, market and political conditions, including the performance and
fluctuations of fixed income, equity, real estate and other financial markets; (2) the availability
and cost of additional debt or equity capital or external financing for our operations; (3)
interest rate fluctuations or prolonged periods of low interest rates; (4) the degree to which we choose not
to hedge risks, or the potential ineffectiveness or insufficiency of hedging or risk management
strategies we do implement, with regard to variable annuity or other product guarantees; (5)
any inability to access our credit facilities; (6) reestimates of our reserves for future policy benefits and
claims; (7) differences between actual experience regarding mortality, longevity, morbidity,
persistency, surrender experience, interest rates or market returns and the assumptions we use
in pricing our products, establishing liabilities and reserves or for other purposes; (8) changes in our
assumptions related to deferred policy acquisition costs, value of business acquired or goodwill; (9)
changes in assumptions for retirement expense; (10) changes in our financial strength or credit
ratings; (11) statutory reserve requirements associated with term and universal life insurance
policies under Regulation XXX and Guideline AXXX; (12) investment losses, defaults and counterparty non-performance;
(13) competition in our product lines and for personnel; (14) difficulties in marketing and
distributing products through current or future distribution channels; (15) changes in tax law;
(16) economic, political, currency and other risks relating to our international operations; (17) fluctuations in
foreign currency exchange rates and foreign securities markets; (18) regulatory or legislative
changes, including the Dodd-Frank Wall Street Reform and Consumer Protection Act; (19)
inability to protect our intellectual property rights or claims of infringement of the intellectual property
rights of others; (20) adverse determinations in litigation or regulatory matters and our exposure to
contingent liabilities, including in connection with our divestiture or winding down of
businesses; (21) domestic or international military actions, natural or man-made disasters including terrorist
activities or pandemic disease, or other events resulting in catastrophic loss of life; (22)
ineffectiveness of risk management policies and procedures in identifying, monitoring and
managing risks; (23) effects of acquisitions, divestitures and restructurings, including possible difficulties
in integrating and realizing projected results of acquisitions; (24) interruption in
telecommunication, information technology or other operational systems or failure to maintain
the security, confidentiality or privacy of sensitive data on such systems; (25) changes in statutory or U.S. GAAP
accounting principles, practices or policies; (26) Prudential Financial, Inc.’s primary reliance,
as a holding company, on dividends or distributions from its subsidiaries to meet debt payment
obligations and the ability of the subsidiaries to pay such dividends or distributions in light of our ratings
objectives and/or applicable regulatory restrictions; and (27) risks due to the lack of legal
separation between our Financial Services Businesses and our Closed Block Business. Prudential
Financial, Inc. does not intend, and is under no obligation, to update any particular forward-looking
statement included in this presentation.
See “Risk Factors” included in Prudential Financial, Inc.’s Annual Report on Form
10-K for the year ended December 31, 2013 and Quarterly Report on Form 10-Q for the
period ended March 31, 2014 for discussion of certain risks relating to our businesses and investment in our
securities.
Prudential Financial, Inc. of the United States is not affiliated with Prudential PLC which is
headquartered in the United Kingdom. |
 2
Investor Day 6.4.2014
This presentation includes references to “adjusted operating income” or “AOI”.
Adjusted operating income is a non-GAAP measure of performance of our Financial Services
Businesses. Adjusted operating income excludes “Realized investment gains (losses), net,” as adjusted, and related
charges and adjustments. A significant element of realized investment gains and losses are impairments
and credit-related and interest rate- related gains and losses. Impairments and
losses from sales of credit-impaired securities, the timing of which depends largely on market credit
cycles, can vary considerably across periods. The timing of other sales that would result in gains or
losses, such as interest rate-related gains or losses, is largely subject to our discretion
and influenced by market opportunities as well as our tax and capital profile. Realized investment gains (losses) within certain of our businesses for which such gains (losses) are
a principal source of earnings, and those associated with terminating hedges of foreign
currency earnings and current period yield adjustments are included in adjusted operating income.
Adjusted operating income excludes realized investment gains and losses from products that contain
embedded derivatives, and from associated derivative portfolios that are part of a hedging
program related to the risk of those products. Adjusted operating income also excludes gains and
losses from changes in value of certain assets and liabilities relating to foreign currency exchange
movements that have been economically hedged or considered part of our capital funding
strategies for our international subsidiaries, as well as gains and losses on certain investments
that are classified as other trading account assets.
Adjusted operating income also excludes investment gains and losses on trading account assets
supporting insurance liabilities and changes in experience-rated contractholder liabilities
due to asset value changes, because these recorded changes in asset and liability values are expected
to ultimately accrue to contractholders. Trends in the underlying profitability of our businesses can
be more clearly identified without the fluctuating effects of these transactions. In addition,
adjusted operating income excludes the results of divested businesses, which are not relevant to our
ongoing operations. Discontinued operations, which is presented as a separate component of net income
under GAAP, is also excluded from adjusted operating income. We believe that the
presentation of adjusted operating income as we measure it for management purposes enhances understanding of the results
of operations of the Financial Services Businesses by highlighting the results from ongoing operations
and the underlying profitability of our businesses. However, adjusted operating income is not a
substitute for income determined in accordance with GAAP, and the adjustments made to derive
adjusted operating income are important to an understanding of our overall results of operations. The schedules on the following pages
provide a reconciliation of adjusted operating income for the Financial Services Businesses to income
from continuing operations in accordance with GAAP. The
information referred to above, as well as the risks of our businesses described in our Annual Report on Form 10-K and Quarterly Reports on
Form 10-Q, should be considered by readers when reviewing forward-looking
statements contained in this presentation. Additional historical
information
relating
to
our
financial
performance
is
located
on
our
Web
site
at
www.investor.prudential.com.
NON–GAAP MEASURES |
 3
Investor Day 6.4.2014
RECONCILIATION BETWEEN ADJUSTED OPERATING INCOME
AND THE COMPARABLE GAAP MEASURE
($ millions)
2009
2010
2011
2012
2013
Financial Services Businesses after-tax adjusted operating income
2,261
$
2,664
$
2,917
$
3,019
$
4,586
$
Reconciling items:
Realized investment gains (losses), net, and related charges and adjustments
(1,669)
(27)
847
(2,809)
(8,149)
Investment gains (losses) on trading account assets supporting insurance
liabilities, net 1,601
501
223
610
(250)
Change in experience-rated contractholder liabilities due to asset value
changes (899)
(631)
(123)
(540)
227
Divested businesses
2,101
1
90
(615)
29
Equity in earnings of operating joint ventures and earnings attributable to
noncontrolling interests (2,387)
(87)
(227)
(29)
28
Total reconciling items, before income taxes
(1,253)
(243)
810
(3,383)
(8,115)
Income taxes, not applicable to adjusted operating income
(663)
35
424
(816)
(2,857)
Total reconciling items, after income taxes
(590)
(278)
386
(2,567)
(5,258)
Income (loss) from continuing operations (after-tax) of Financial Services
Businesses before equity in earnings of operating joint ventures
1,671
2,386
3,303
452
(672)
1,580
63
148
10
(48)
Income (loss) from continuing operations attributable to Prudential Financial,
Inc. 3,251
2,449
3,451
462
(720)
Earnings attributable to noncontrolling interests
(57)
19
34
50
107
Income (loss) from continuing operations (after-tax) of Financial Services
Businesses 3,194
2,468
3,485
512
(613)
Income (loss) from discontinued operations, net of taxes
(19)
32
35
17
7
Net income (loss) of Financial Services Businesses
3,175
2,500
3,520
529
(606)
Less: Income attributable to noncontrolling interests
(57)
19
34
50
107
Net income (loss) of Financial Services Businesses attributable to Prudential
Financial, Inc. 3,232
$
2,481
$
3,486
$
479
$
(713)
$
Equity in earnings of operating joint ventures, net of taxes and earnings attributable to
noncontrolling interests |
 RECONCILIATION FOR EARNINGS PER SHARE
EXCLUDING
MARKET
DRIVEN
AND
DISCRETE
ITEMS
(1)
4
Investor Day 6.4.2014
1)
As disclosed in company earnings releases.
2)
Includes adjustments to reflect updated estimates of profitability based on market
performance in relation to our assumptions, as well as annual reviews of
actuarial assumptions and refinements of reserves, deferred policy acquisition and
other costs. 3)
Includes gains on sales of investments in China Pacific, Afore XXI, as well as
impairments and gains on certain investments. 4)
Includes acquisition and integration expenses related to Star and Edison, and the
acquired in force from The Hartford Life. 5)
Includes true ups for legal reserves, and employee benefit accruals, and
impairments and write offs of intangible assets. Adjusted Operating Income
basis: 2010
2011
2012
2013
Earnings Per Share
5.64
$
5.97
$
6.40
$
9.67
$
Reconciling items:
Unlockings
and
experience
true-ups
(2)
0.52
(0.27)
(0.03)
0.77
Gains
on
sales
of
businesses/investments
(3)
0.09
0.53
0.15
0.09
Impact of earthquake in Japan
-
(0.09)
-
-
Integration costs
(4)
-
(0.29)
(0.21)
(0.09)
Write off of bond issue costs
-
-
(0.04)
(0.03)
Other
(5)
-
(0.16)
(0.17)
-
Sub-total
0.61
(0.28)
(0.30)
0.74
Earnings Per Share -
excluding market driven and discrete
items
5.03
$
6.25
$
6.70
$
8.93
$ |
 5
Investor Day 6.4.2014
1)
As disclosed in company earnings releases.
2)
Includes adjustments to reflect updated estimates of profitability based on market
performance in relation to our assumptions, as well as annual reviews of
actuarial assumptions and refinements of reserves, deferred policy acquisition and
other costs. 3)
Includes gain on sale of investment in Afore XXI, as well as an impairment and
gains on certain other investments. 4)
Includes true ups for legal reserves and impairments and write offs of intangible
assets. ($ millions)
2012
2013
U.S. Businesses pre-tax adjusted operating income
2,661
$
4,587
$
Reconciling items:
Unlockings and experience true-ups
(2)
48
764
Gains on sales of business/investments
(3)
44
-
Integration costs for Hartford Life acquisition
(15)
(51)
Other
(4)
(67)
-
Sub-total
10
713
U.S. Businesses pre-tax adjusted operating income excluding market
driven and discrete items
2,651
$
3,874
$
RECONCILIATION FOR U.S. BUSINESSES PRE-TAX ADJUSTED
OPERATING
INCOME
EXCLUDING
MARKET
DRIVEN
AND
DISCRETE
ITEMS
(1) |
 6
Investor Day 6.4.2014
1)
As disclosed in company earnings releases.
2)
Includes gain on sale of an investment in Afore XXI, as well as an impairment and
gains on sales of certain other investments. ($ millions)
2009
2010
2011
2012
2013
Asset Management pre-tax adjusted operating income
92
$
523
$
888
$
584
$
723
$
Reconciling items:
Gains/(losses) on sales of business/investments
(2)
-
-
157
(34)
-
Sub-total
-
-
157
(34)
-
Asset Management pre-tax adjusted operating income excluding market
driven and discrete items
92
$
523
$
731
$
618
$
723
$
RECONCILIATION FOR ASSET MANAGEMENT PRE-TAX ADJUSTED
OPERATING
INCOME
EXCLUDING
MARKET
DRIVEN
AND
DISCRETE
ITEMS
(1) |
 RECONCILIATION FOR INTERNATIONAL INSURANCE PRE-TAX ADJUSTED
OPERATING
INCOME
EXCLUDING
MARKET
DRIVEN
AND
DISCRETE
ITEMS
(1)
7
1)
As disclosed in company earnings releases.
2)
Includes refinements of reserves and amortization of deferred policy acquisition
and other costs. 3)
Represents initial surrenders of policies following the restructuring of the
acquired Yamato Life business. Investor Day 6.4.2014
($ millions)
2009
2010
2011
2012
2013
International Insurance pre-tax adjusted operating income
1,651
$
1,887
$
2,263
$
2,704
$
3,152
$
Reconciling items:
Annual
review
of
actuarial
assumptions
and
reserve
refinements
(2)
14
-
-
20
(190)
Gains on sales of indirect investment in China Pacific Group
-
66
237
60
66
Impact of earthquake in Japan
-
-
(69)
-
-
Star/Edison integration costs
-
-
(213)
(138)
(28)
Other
(3)
15
-
-
-
-
Sub-total
29
66
(45)
(58)
(152)
International Insurance pre-tax adjusted operating income excluding market
driven and discrete items
1,622
$
1,821
$
2,308
$
2,762
$
3,304
$ |
 PRUDENTIAL FINANCIAL, INC.
JOHN STRANGFELD
CHAIRMAN & CEO |
 •
Superior ROE
•
Strong cash flow and capital deployment
•
High value-added, solution-driven business models
•
Conservatively managed balance sheet
2
Investor Day 6.4.2014
PRUDENTIAL’S INVESTOR VALUE PROPOSITION |
 •
Attractive mix of high quality businesses
•
Talent and culture as a differentiator
•
Seasoned management team
•
Proven acquisition and integration track record
•
Balanced approach to capital management
•
Financial strength and brand
3
Investor Day 6.4.2014
HOW WE DELIVER ON OUR VALUE PROPOSITION |
 4
Investor Day 6.4.2014
WHAT WE MEAN BY ATTRACTIVE MIX OF HIGH QUALITY BUSINESSES
•
Focus upon Life, Retirement and Asset Management
•
Market leading businesses in the two largest markets in the world
–
U.S.
–
Japan
•
Planting seeds in other markets
•
Combination of growth and stability
•
Balanced set of risks |
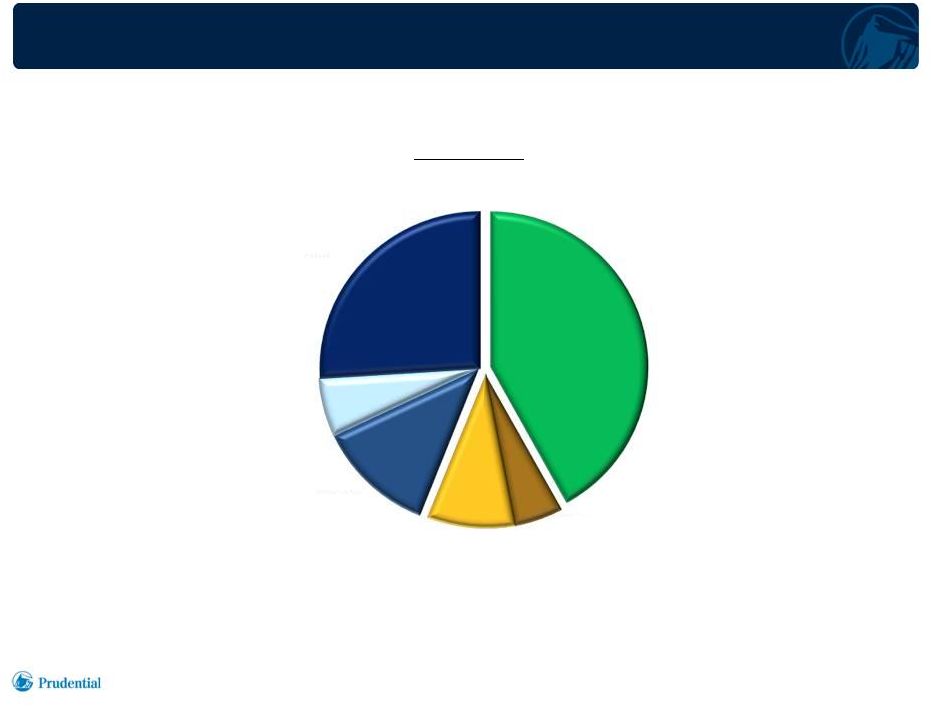 March
31, 2014 Attributed Equity
$29.1
Billion
(1)
1)
Attributed equity of Financial Services Businesses (FSB) as of March 31, 2014,
excluding accumulated other comprehensive income (AOCI), and Corporate and
Other Operations. Also excluding impact of foreign currency exchange rate
remeasurement, which is attributed to International Insurance. 5
Investor Day 6.4.2014
SUPERIOR MIX OF HIGH QUALITY BUSINESSES WITH BALANCED RISKS
Retirement
12%
Asset
Management
6%
Individual
Annuities
26%
International
Insurance
42%
Group
Insurance
5%
Individual Life
9% |
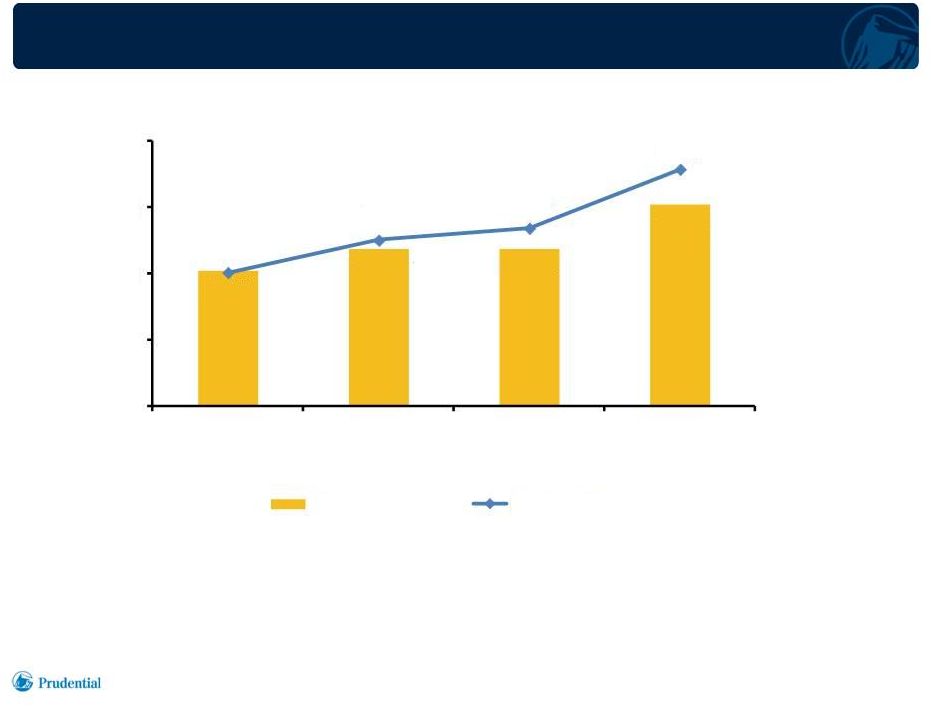 6
6
1)
EPS based on after-tax AOI of FSB excluding market driven and discrete items as
disclosed in the company earnings releases; 2010 and 2011 market driven and
discrete items have been restated for U.S. GAAP accounting standards applicable to deferred policy acquisition costs effective 1/1/12.
2)
ROE based on AOI as adjusted herein and excludes accumulated other comprehensive
income and the impact of foreign currency exchange rate remeasurement on
attributed equity. Investor Day 6.4.2014
ROE AND EPS GROWTH
(1),(2)
10.2%
11.9%
11.8%
15.2%
$5.03
$6.25
$6.70
$8.93
0%
5%
10%
15%
20%
2010
2011
2012
2013
ROE
Earnings Per Share |
 7
•
Strong
technical
skills
–
used
independently
and
in
combination
•
Healthy blend of internally developed and external hires
•
Environment of collaboration, teamwork and diversity
•
Cross discipline engagement to drive innovation and execution
•
Seasoned management team; orderly transitions
Investor Day 6.4.2014
TALENT AND CULTURE AS PERFORMANCE DRIVERS |
 PRUDENTIAL FINANCIAL, INC.
MARK GRIER
VICE CHAIRMAN |
 AGENDA
•
Regulatory update
•
Risk management
•
Capital management
2
Investor Day 6.4.2014 |
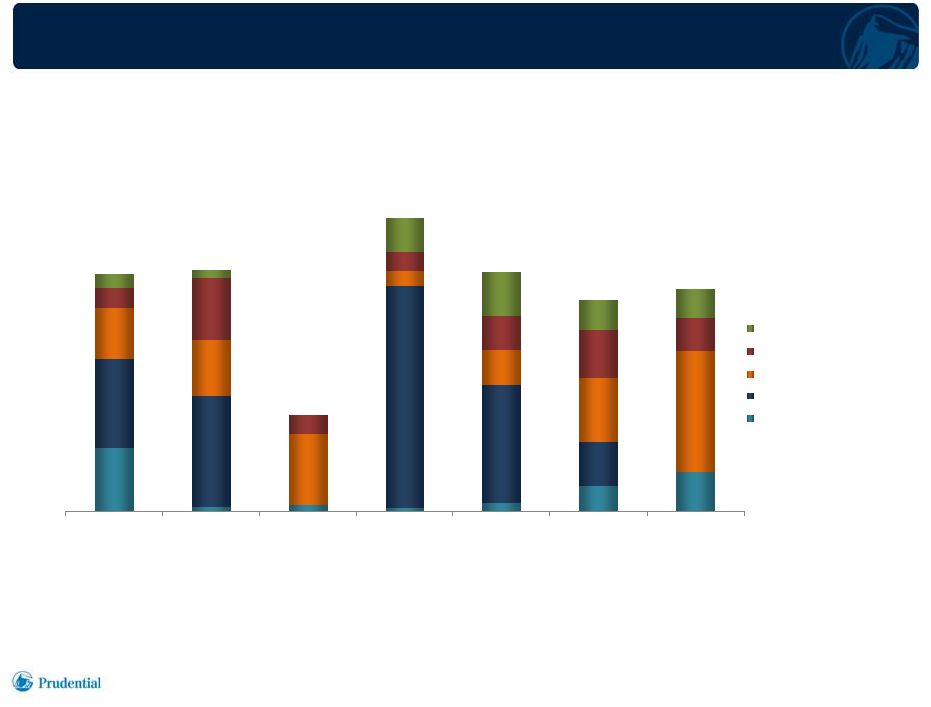 CASH
FLOWS
FROM
SUBSIDIARIES
(1)
3
Investor Day 6.4.2014
1)
Reflects dividends and returns of capital to Prudential Financial, Inc.
(PFI). 2007
2008
2009
2010
2011
2012
2013
Prudential Annuities
Asset Management
International
Prudential Insurance
Other
$3.2
$1.3
$4.0
$3.2
$2.9
$3.3
$3.0
$ billions |
 STEPHEN PELLETIER
EXECUTIVE VICE PRESIDENT AND
CHIEF OPERATING OFFICER, U.S.
PRUDENTIAL’S U.S. BUSINESSES |
 TODAY’S DISCUSSION
2
•
Executive Summary
•
Prudential’s U.S. Business Portfolio
•
Review of U.S. Businesses
•
Conclusion
Investor Day 6.4.2014 |
 •
Prudential’s U.S. business portfolio represents an attractive mix of
businesses and risks •
Among the best positioned in the industry to participate in growth
opportunities –
Long term trends are putting money in motion
–
Established and emerging solutions directly address these opportunities
–
Superior
and
highly
relevant
set
of
capabilities,
leveraged
both
within
and
across
businesses
–
Access a broad set of institutional and individual customers through multiple
distribution channels •
Sales are an outcome of our focus on:
–
Pursuing market opportunities
–
Achieving appropriate returns
–
Maintaining an attractive balance of risks
•
Strong and sustainable financial performance by virtue of our business mix,
operating leverage, and quality of earnings
EXECUTIVE SUMMARY
3
Investor Day 6.4.2014 |
 TODAY’S DISCUSSION
4
•
Executive Summary
•
Prudential’s U.S. Business Portfolio
•
Review of U.S. Businesses
•
Conclusion
Investor Day 6.4.2014 |
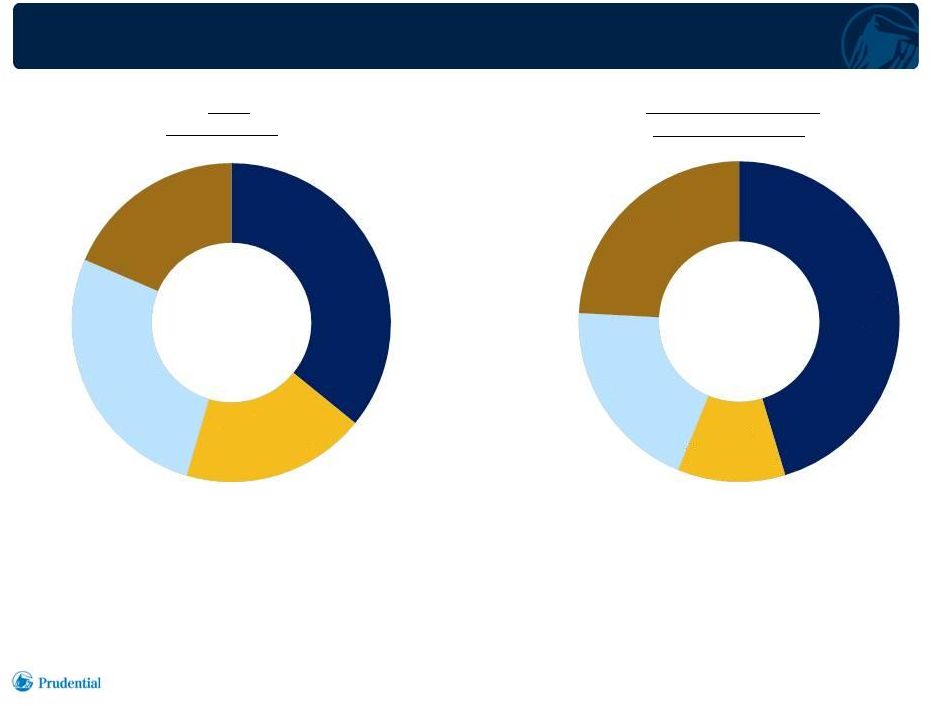 PRUDENTIAL’S U.S. BUSINESS PORTFOLIO REPRESENTS
AN ATTRACTIVE MIX OF BUSINESSES AND RISKS
Investor Day 6.4.2014
5
1)
Adjusted Operating Income (AOI) excluding market-driven and discrete items, as
disclosed in company earnings releases. 2)
U.S. Individual Life and Group Insurance Division.
3)
Attributed equity of the U.S. Businesses as of 12/31/2013, excluding accumulated
other comprehensive income. $3.9
billion
$16.6
billion
2013
Pre-Tax AOI
(1)
Attributed Equity
(3)
(2)
(2)
Annuities
36%
Asset
Management
19%
Retirement
27%
Insurance
18%
Annuities
45%
Asset
Management
11%
Retirement
20%
Insurance
24%
December
31,
2013 |
 WE ARE
AMONG THE BEST POSITIONED IN THE INDUSTRY TO PARTICIPATE IN GROWTH
OPPORTUNITIES 6
Investor Day 6.4.2014
Long term trends are putting money in motion
Long term trends are putting money in motion
Our established and emerging solutions
Our established and emerging solutions
directly address these opportunities
directly address these opportunities
Aging population with growing pool of assets
Growing retail investment business
Diversified annuity product portfolio
Innovative individual insurance products
Movement toward derisking in large Defined
Benefit (DB) markets
Pension Risk Transfer
Longevity Reinsurance
Liability-Driven Investing
Growing need for more certain outcomes
Stable Value Products
In-Plan Income Solutions
Outcome-Oriented DC Plans
Rapid
growth
of
target
date
funds
(5)
•
$618 billion in 401(k) assets
•
31% of 401(k) contributions; 63% by 2018
“Day One”
Target Date Funds
Increasing consumer expenditures
on healthcare
•
5.8%
annual
growth
over
last
10
years
(6)
Voluntary Critical Illness Insurance
Chronic Illness Insurance Rider
Consumers age 46+ control 88% of financial
assets –
over $23 trillion
(1)
•
$3.0 trillion U.S.
•
$1.9 trillion U.K.
•
$1.3 trillion Canada
•
$5.3 trillion Defined Contribution (DC) market
•
69% of covered workers have DC plans only;
80% had DB plans 30 years ago
(3)
(4)
(2)
1)
LIMRA, Fact Book on Retirement Income 2014, based on 2010 Survey of Consumer Finances. 2)
U.S. Investment Company Institute (U.S. – ICI); U.K. – Pension Protection Fund; Canada -
Towers Watson Global Pension Assets Study 2014; year end 2013 estimates. 3)
Cerulli Retirement Markets 2013. Data as of 2012. 4)
Employee Benefit Research Institute; data from 1981-2011; among private-sector participants in
an employment-based retirement plan.
5)
Cerulli Retirement Markets 2013.
6)
Bureau of Labor Statistics, Consumer Expenditure Survey, Oliver Wyman analysis; as of 2012. |
 SUPERIOR
AND HIGHLY RELEVANT SET OF CAPABILITIES, LEVERAGED BOTH WITHIN AND ACROSS
BUSINESSES 7
Investor Day 6.4.2014
Strength in solution development and innovation
Investment management expertise and performance
Actuarial expertise
Risk management expertise
Strong client service and operational capabilities |
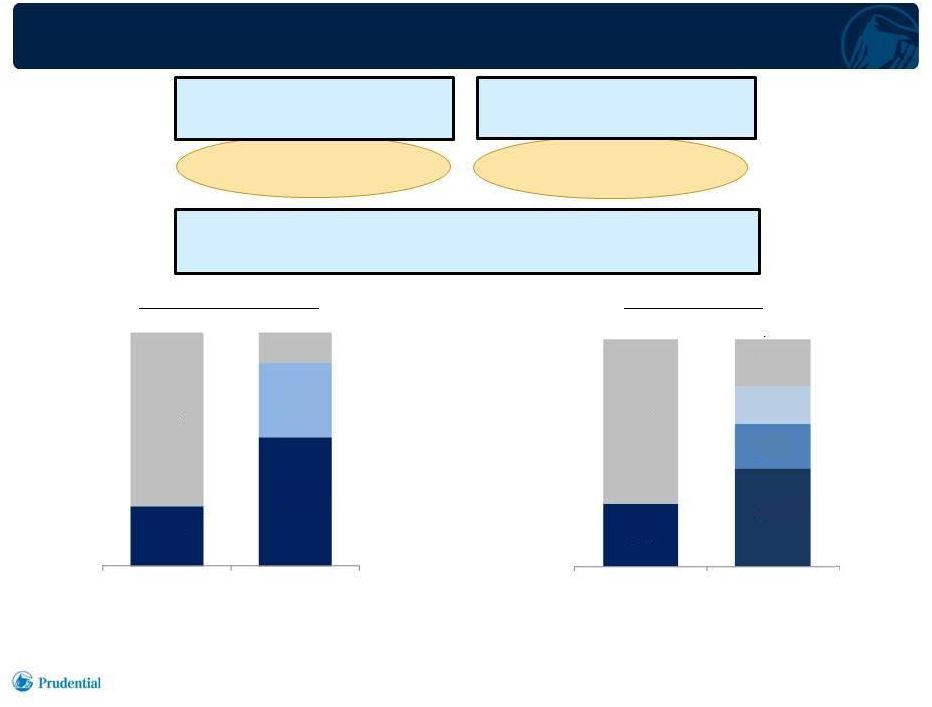 Over
half of the Fortune 500
Over 9 million retirees
and
near-retirees
(2)
ACCESS A BROAD SET OF INSTITUTIONAL AND INDIVIDUAL
CUSTOMERS THROUGH MULTIPLE DISTRIBUTION CHANNELS
8
Investor Day 6.4.2014
Over 25,000
Institutional Clients
Over 30 million
Individual Customers
(1)
Over 125,000
Financial
Professionals
selling
our
products
(3)
1)
Individual customers count based on a product-by-product basis as of
December 2013, with the exception of Mutual Funds, which is as of December 2012.
2)
Retirees and near-retirees count based on unique customers as of December
2012. 3)
Third party financial professionals counted on a product-by-product
basis. ($ millions)
Brokerage
Agency
Independent
Financial
Planners
Agency
Wirehouses
Banks
Institutional
(Banks and
Wirehouses)
Individual Life Sales*
Annuities Sales*
*Based on annualized new business premiums; excludes corporate owned life
insurance. 2002
based
on
scheduled
premiums
from
new
sales
on
an
annualized
basis
and
first
year excess premiums and deposits on a cash-received basis.
Agency
Brokerage
*Based on gross sales
26%
55%
32%
74%
13%
320
731
2002
2013
43%
28%
20%
16%
72%
21%
2,000
11,513
10%
20%
30%
40%
50%
70%
80%
90%
100%
2002
2013
Agency
Third
Party
($ millions) |
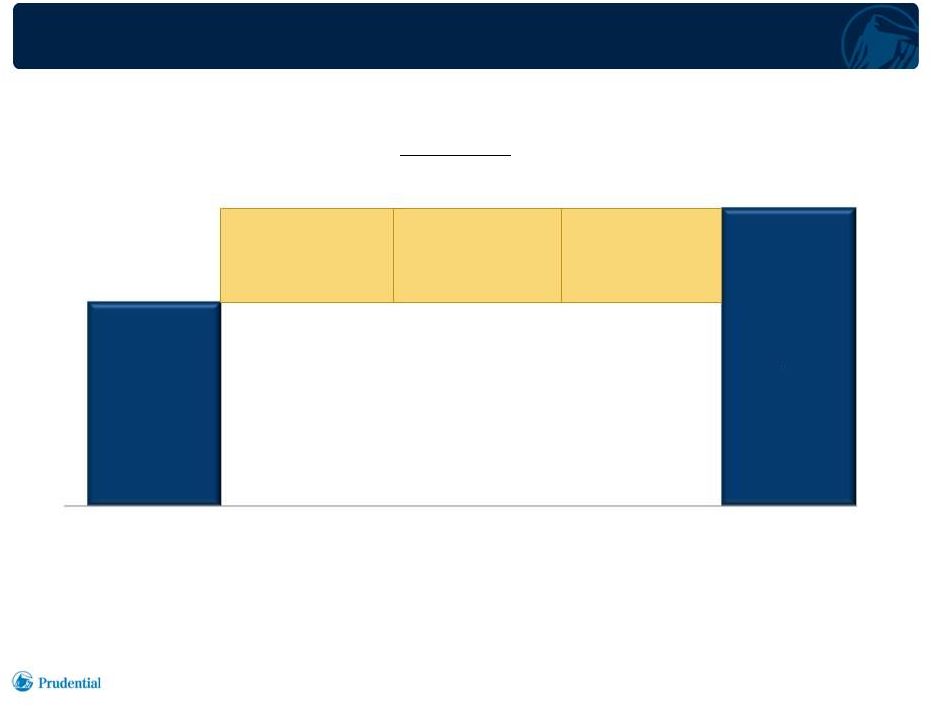 FINANCIAL
PERFORMANCE REFLECTS EARNINGS GROWTH AND QUALITY
9
Pre-Tax AOI
(1)
($ millions)
2012
2013
1)
U.S. Businesses, AOI excluding market-driven and discrete items, as disclosed
in company earnings releases. M&A and Outsized
Organic Growth
Net Flows and
Margins
Equity Markets
Investor Day 6.4.2014
$2,651
$3,874 |
 TODAY’S DISCUSSION
10
•
Executive Summary
•
Prudential’s U.S. Business Portfolio
•
Review of U.S. Businesses
•
Conclusion
Investor Day 6.4.2014 |
 ANNUITIES
Investor Day 6.4.2014
11
•
Value propositions address needs for secure retirement income
•
Product diversification strategy improves our risk profile
•
Positive cash flows expected over a wide range of scenarios
•
Living benefits exposure has declined due to favorable capital markets
|
 ANNUITIES: PRODUCT DIVERSIFICATION STRATEGY
•
No cash value
•
Payout Annuity
Single
Premium
Immediate
Annuity
•
Diversification of
investments
•
Living/Death
benefit options
•
Equity/Fixed
income
investments
•
No equity exposure
•
Bond fund only
•
Accumulation focused
•
Greatest market
upside potential
•
No living benefit option
•
Wide variety of funds
including non-coupon
investments
High
Low
Risk
Investor Day 6.4.2014
12
•
Developing
new
products
to
meet
market
demand
for
a
broad
set
of
retirement
income solutions
•
Implementing product and design changes to reduce risk and manage volatility
High
Low
“Highest
Daily”
Suite
Prudential
Premier
Investment
Variable Annuity
(VA)
Prudential
Defined
Income
(PDI) |
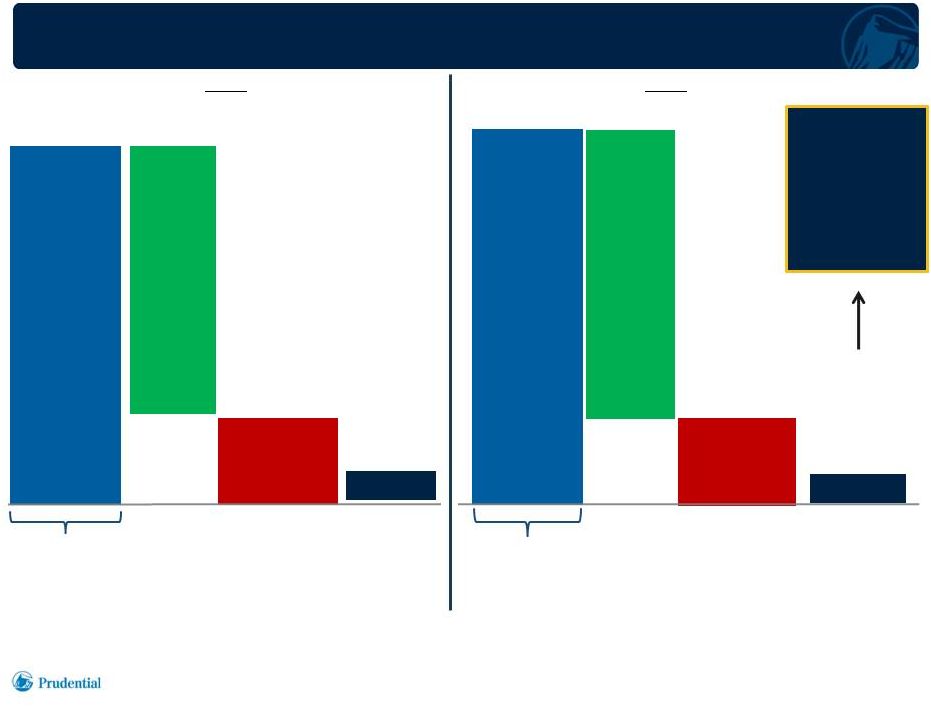 ANNUITIES: LIVING BENEFIT EXPOSURE
(1)
Notional amount
–
cannot be
accessed by
contract holder
Protected
Withdrawal
Value
$122 billion
Notional
“In-the-
Moneyness”
$10 billion
Account
Value
$112
billion
$1 billion
Cost, in excess
of account value,
to buy immediate
annuity to
defease the
living benefit
liability, which
is hedged
Economic
“In-the-
Moneyness”
(2)
Notional amount
–
cannot be
accessed by
contract holder
Protected
Withdrawal
Value
$109 billion
Notional
“In-the-
Moneyness”
$14 billion
Account
Value
$95
billion
$2 billion
Economic
“In-the-
Moneyness”
(2)
2012
2013
13
Investor Day 6.4.2014
1)
Represents products with guaranteed lifetime withdrawal benefits (GLWB), excluding PDI, as of end of
period. 2)
Represents our living benefit exposure, as of end of period, based upon policyholder's guaranteed
lifetime annual income amount on that date. |
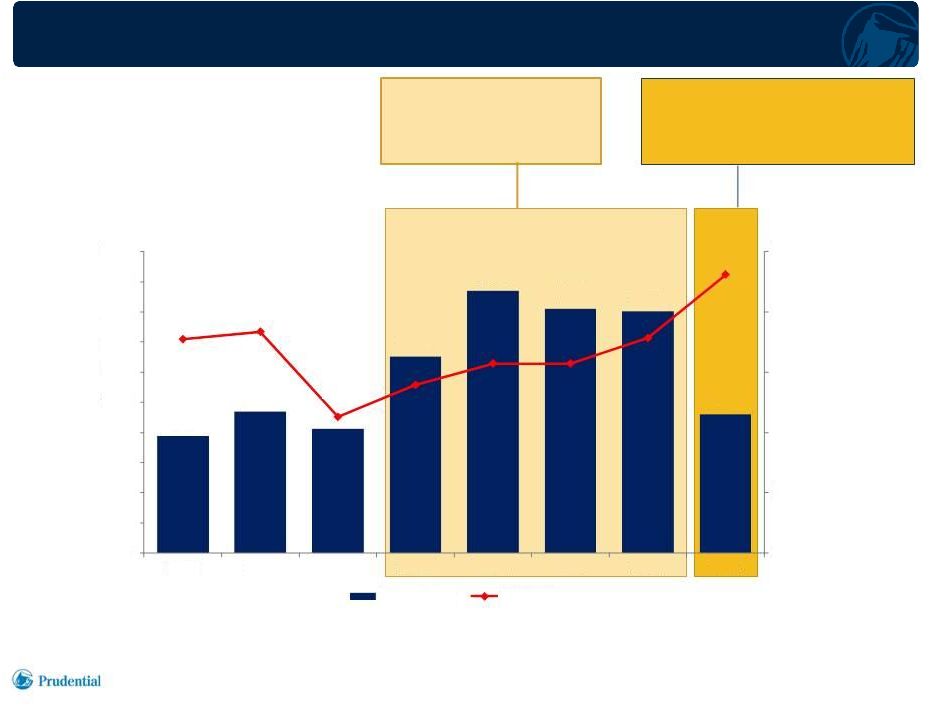 ANNUITIES: SALES AS AN OUTCOME
Investor Day 6.4.2014
14
2009-2012
Increasing VA sales
in a rising market
2013
Moderating VA sales reflects strategy
to adapt products to current
environment and diversify risks
S&P 500
($ billions)
9.7
11.8
10.3
16.3
21.8
20.3
20.0
11.5
$0
$5
$10
$15
$20
$25
0
200
400
600
800
1,000
1,200
1,400
1,600
1,800
2,000
2006
2007
2008
2009
2010
2011
2012
2013
Gross Sales
S&P 500 |
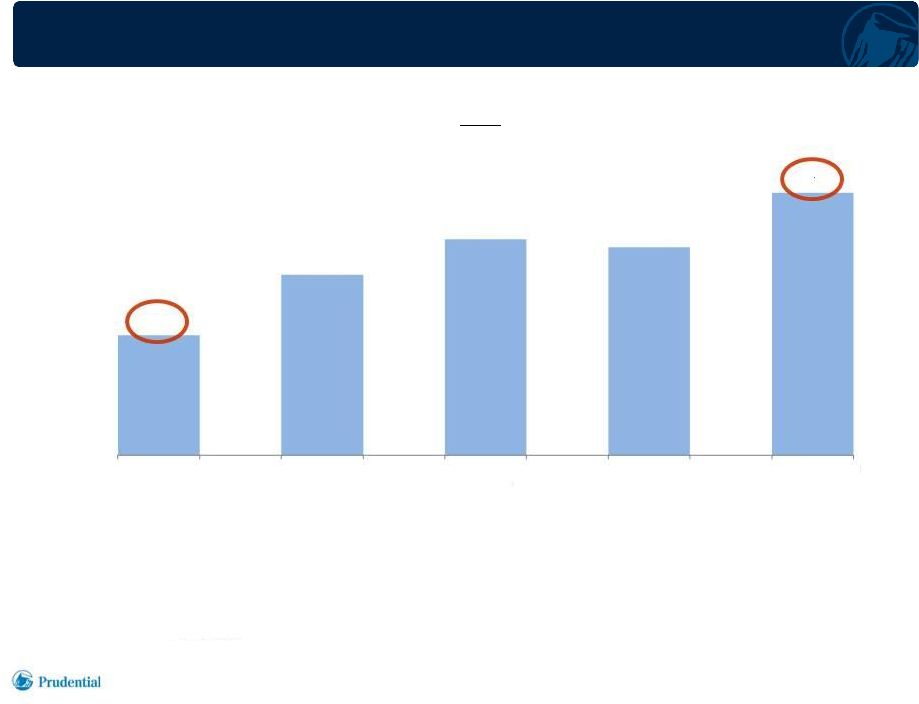 1) Based on pre-tax AOI excluding market unlockings and experience
true-ups, and impact of annual actuarial review as disclosed in company earnings releases, as
percentage of average account value.
ANNUITIES:
RETURN
ON
ASSETS
(ROA)
(1)
Investor Day 6.4.2014
15
2009
2010
2011
2012
2013
ROA
0.44%
0.66%
0.79%
0.76%
0.96% |
 RETIREMENT
•
Market leader in Pension Risk Transfer (PRT)
–
PRT pipeline and market remain strong; pace of transactions will
be lumpy
–
Foothold
in U.K. longevity reinsurance market
•
Investment
Only
Stable
Value
(IOSV)
book
exceeds
$70
billion
(1)
–
Filled post-crisis vacuum
–
Favorable risk profile
–
Increasing competition in market
•
Investment in the Full Service business
–
Improved cost efficiency and pipeline; strong persistency
–
Solid value proposition focused on mid to large case market
16
Investor Day 6.4.2014
1)
As of 3/31/2014. |
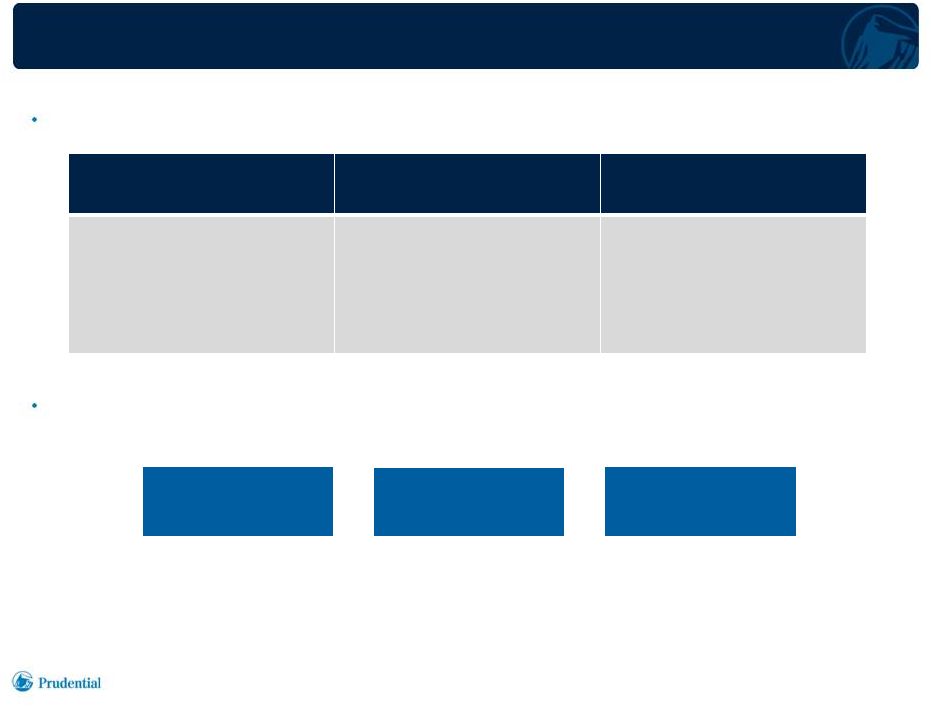 RETIREMENT: DEMAND FOR
PENSION RISK TRANSFER Investor Day 6.4.2014
17
Improved Pension Plan
Improved Pension Plan
Funded Status
Funded Status
Heightened Awareness
Heightened Awareness
of Pension Plan Risk
of Pension Plan Risk
Greater Comprehension
Greater Comprehension
of Risk Transfer Solutions
of Risk Transfer Solutions
Driven by more stringent
funding rules, increasing
interest rates and surging
equity markets
Resulting from increased
external transparency and
a deeper understanding
of longevity and asset risk
Achieved by dispelling
common misconceptions
(i.e., too costly, too time-
consuming, not viable in a
low interest rate environment)
There
are
three
key
drivers
of
a
vibrant
market
for
pension
risk
transfer
transactions.
U.K.
$1.9 Trillion
(2)
U.S.
$3.0 Trillion
(1)
Canada
$1.4 Trillion
(3)
The U.S., U.K. and Canada either have or are developing these drivers.
The size of the DB markets in these countries represents significant opportunities.
DB market assets estimated in U.S. dollars, as of year end 2013.
1)
Investment Company Institute.
2)
Pension Protection Fund.
3)
Towers Watson Global Pension Assets Study 2014. |
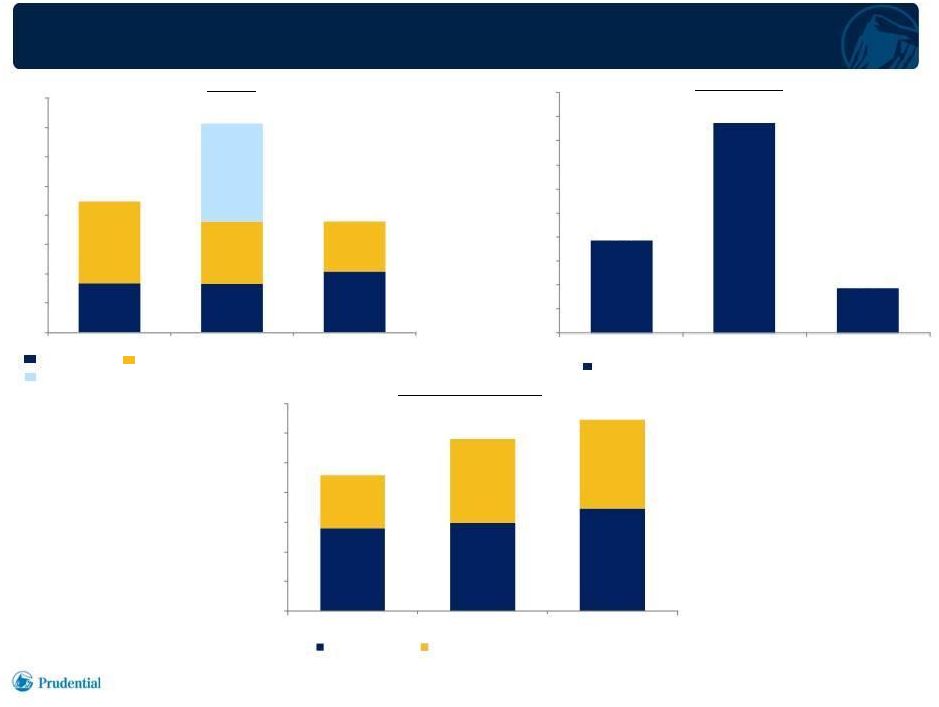 RETIREMENT: SALES, FLOWS, AND ACCOUNT VALUES
Investor Day 6.4.2014
18
Sales
Account Values
(2)
1)
Represents significant transactions
recorded in fourth quarter 2012.
2)
At end of period.
Net Flows
Pension Risk Transfer
(1)
Other Institutional Investment Products
Full Service
($ billions)
Full Service and Institutional Investment Products
45
71
38
19
44
9
($ billions)
($ billions)
$0
$10
$20
$30
$40
$50
$60
$70
$80
2011
2012
2013
$0
$5
$10
$15
$20
$25
$30
$35
$40
$45
$50
2011
2012
2013
230
290
323
$0
$50
$100
$150
$200
$250
$300
$350
2011
2012
2013
Full Service
Institutional Investment Products |
 INDIVIDUAL LIFE
•
Stable earnings contributor; balances interest rate and equity market
sensitivity in other businesses
•
Shifting product emphasis to maintain attractive risk profile
•
Hartford integration on track and delivering product and distribution
benefits –
Back office integration, financial performance of acquired block, and synergies
continue to track expectations
–
Unified, Prudential-branded product portfolio reflecting enhanced
innovation •
Chronic illness rider (BenefitAccess Rider)
•
Unique hybrid indexed universal life product (Founders Plus)
•
Unique variable universal life product (VUL Protector)
–
Integrated, multi-channel distribution strategy; significantly increased
presence in Institutional (bank and wirehouse) channels
19
Investor Day 6.4.2014 |
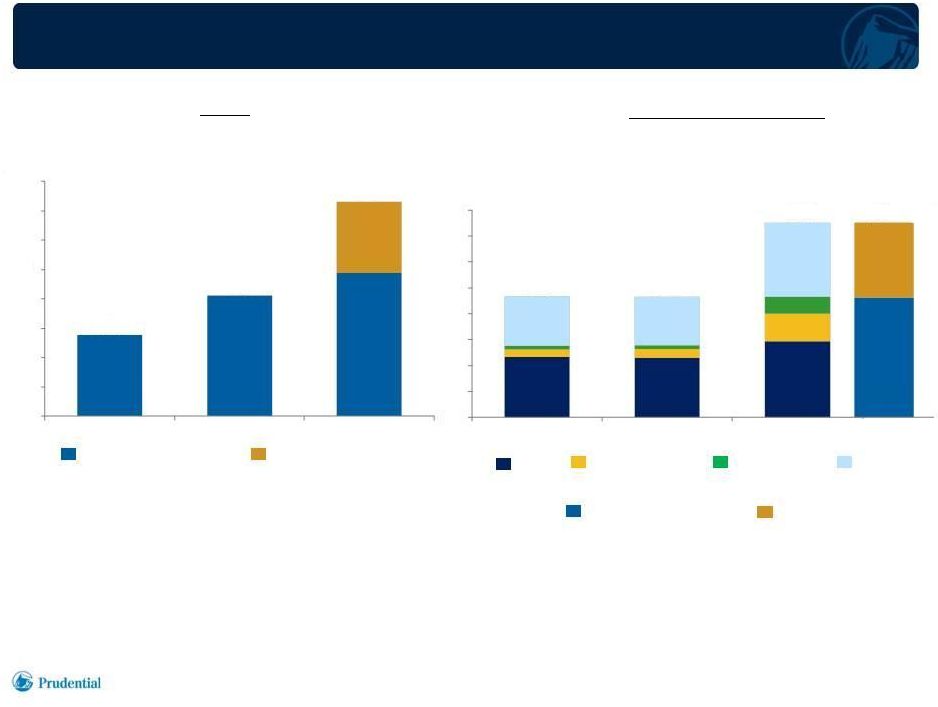 INDIVIDUAL LIFE: NEW BUSINESS PREMIUMS AND IN FORCE
Investor Day 6.4.2014
20
1) Annualized new business premiums, excludes corporate-owned life
insurance. 2) As of end of period, net of reinsurance ceded.
Sales
(1)
Face Amount In Force
($ millions)
($ billions)
Hartford
Legacy Prudential
Guaranteed
Universal Life
Variable Life
Other
Universal Life
Term
Hartford
Legacy Prudential
2013
278
412
731
$0
$100
$200
$300
$400
$500
$600
$700
$800
2011
2012
2013
234
233
376
$0
$50
$100
$150
$200
$250
$300
$350
$400
2011
2012
376
(2) |
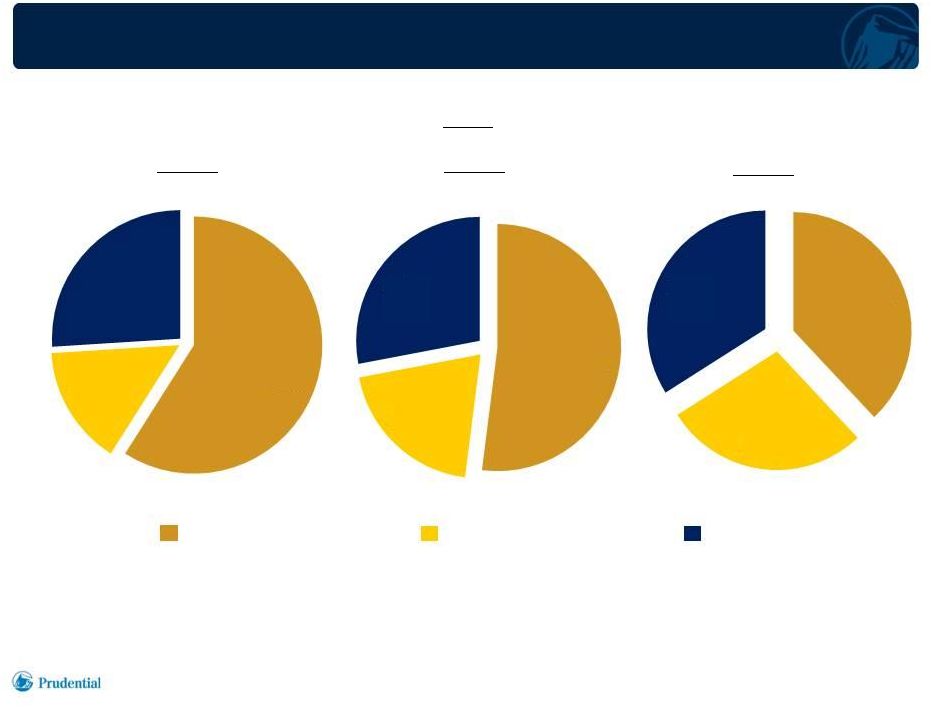 Investor Day 6.4.2014
21
1H 2013
2H 2013
1Q 2014
Sales
(1)
1)
Annualized new business premiums, excludes corporate-owned life
insurance. Other Universal Life and
Variable Life
Term
Guaranteed Universal Life
59%
15%
26%
52%
20%
28%
38%
28%
34%
INDIVIDUAL LIFE: PRODUCT DIVERSIFICATION STRATEGY |
 •
Overall Business
–
Sales reflect focus on restoring appropriate returns
–
Investing in underwriting and technology
–
Emphasis on voluntary products
•
Group Life
–
Dominant source of profitability for Group Insurance
–
Benefit ratios historically within expected ranges
–
Benefiting from strong demand for voluntary products; 76% of life sales in
2013 •
Group Disability
–
60%
of
the
book
has
been
repriced
or
lapsed
over
the
past
two
years
(1)
–
Significant investments in claims management
–
Progress will not be linear
GROUP INSURANCE
Investor Day 6.4.2014
22
1)
For the years ended 12/31/2012 and 2013, including 1/1/2014 renewals.
|
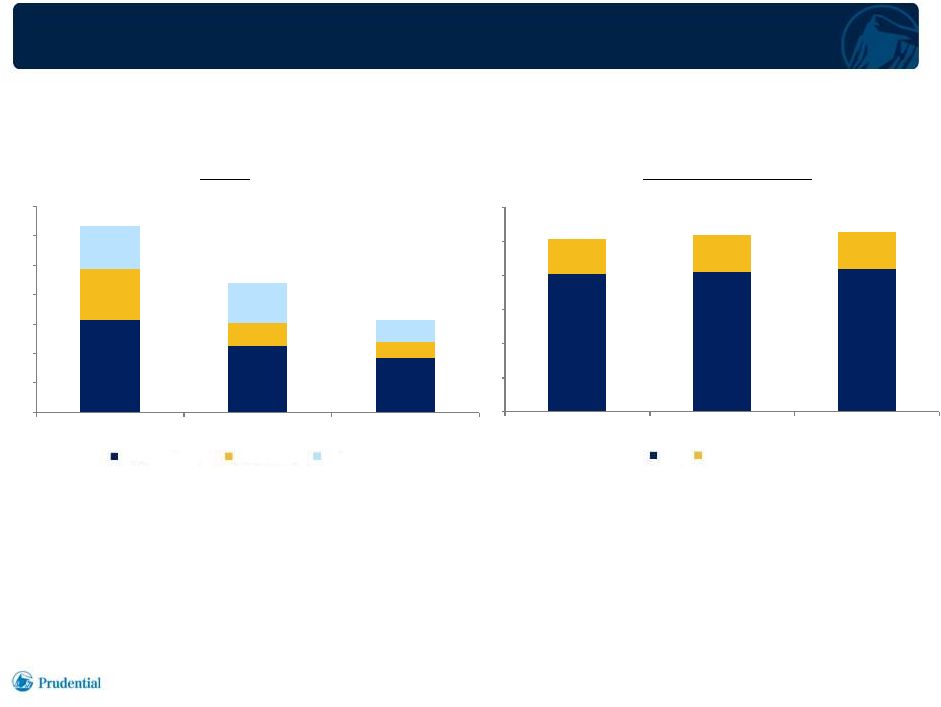 GROUP
INSURANCE: SALES AND IN FORCE Investor Day 6.4.2014
23
($ millions)
Sales
(1)
In
Force
Premiums
1)
Annualized new business premiums.
2)
As of end of period; net of reinsurance.
635
439
313
$0
$100
$200
$300
$400
$500
$600
$700
2011
2012
2013
5,071
5,172
5,278
$0
$1,000
$2,000
$3,000
$4,000
$5,000
$6,000
2011
2012
2013
(2)
Voluntary Life
Basic Life
Disability
Life
Disability |
 ASSET
MANAGEMENT •
Leading global asset manager with a unique multi-manager model
–
Global
top
10
asset
manager
(1)
–
Broad client base including many of the world’s most sophisticated
clients –
Diversified product suite and broad range of investment capabilities
•
Robust underlying fundamentals and attractive shareholder returns
–
Strong, consistent financial performance
–
14%
annual
AUM
growth
over
past
5
years
(2)
–
Earnings driven primarily and increasingly by asset management fees
•
Source of competitive advantage for the Prudential businesses
–
Culture of product innovation; collaborating with Annuities and Retirement to meet
client needs
•
Higher investment margins for the General Account
•
Continuing to invest in the business and in its people to drive further
growth 24
Investor Day 6.4.2014
1)
Based on Pensions & Investments Top Money Managers list for 2013 assets. Assets represent
assets managed by Prudential Financial.
2)
Assets managed by the Asset Management segment as of 12/31/2013. |
 TODAY’S DISCUSSION
25
•
Executive Summary
•
Prudential’s U.S. Business Portfolio
•
Review of U.S. Businesses
•
Conclusion
Investor Day 6.4.2014 |
 CONCLUSION
26
Investor Day 6.4.2014
•
Prudential’s U.S. businesses portfolio represents an attractive mix of
businesses and risks •
Among the best positioned in the industry to participate in growth
opportunities –
Long term trends are putting money in motion
–
Established and emerging solutions directly address these opportunities
–
Superior
and
highly
relevant
set
of
capabilities,
leveraged
both
within
and
across
businesses
–
Access a broad set of institutional and individual customers through multiple
distribution channels •
Sales are an outcome of our focus on:
–
Pursuing market opportunities
–
Achieving appropriate returns
–
Maintaining an attractive balance of risks
•
Strong and sustainable financial performance by virtue of our business mix,
operating leverage, and quality of earnings |
 DAVID
HUNT PRESIDENT & CEO
PRUDENTIAL INVESTMENT MANAGEMENT
ASSET MANAGEMENT |
 OUR
DISCUSSION TODAY •
Prudential is a leading global asset manager with a distinct multi-
manager model
Investor Day 6.4.2014
2
•
The Asset Management business has robust underlying fundamentals
and attractive shareholder returns
•
Asset Management is a source of competitive advantage for the other
Prudential businesses
•
Prudential continues to invest in the Asset Management business and in
its people to drive further growth |
 LEADING
GLOBAL ASSET MANAGER Investor Day 6.4.2014
3
•
Global
top
10
asset
manager
(1)
•
Broad client base including many of the world’s most sophisticated
clients •
Diversified product suite and broad range of investment capabilities
•
Global business model and presence
–
30 offices on 5 continents
(2)
–
21% of third party AUM
(3)
from non-U.S. clients
•
Distinct multi-manager model focused on delivering investment performance
1)
Based on Pensions & Investments (P&I) Top Money Managers list for 2013 assets. Assets
represent assets managed by Prudential Financial.
2)
As of 3/31/2014.
3)
Assets Under Management; as of 3/31/2014.
|
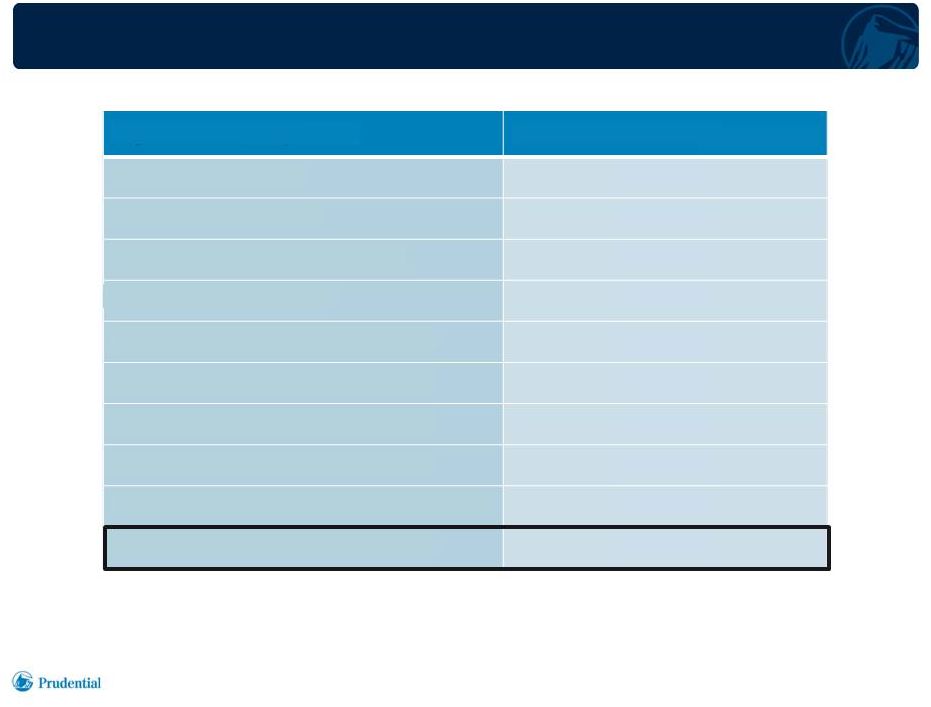 PRUDENTIAL’S MARKET LEADING POSITION AS
10
LARGEST
ASSET
MANAGER
Investor Day 6.4.2014
4
1) Pensions & Investments Top Money Managers
list. 2) Figure includes Prudential’s Asset Management
business of $870 billion and non-proprietary assets under management for Prudential Financial of $237 billion.
1.
BlackRock
4,324
2. Vanguard Group
2,753
3. State Street Global Advisors
2,345
4. Fidelity Investments
2,160
5. J.P. Morgan Asset Management
1,598
6. BNY Mellon Asset Management
1,583
7. PIMCO
1,535
8.
Capital Group
1,339
9. Deutsche Asset & Wealth Management
1,289
10. Prudential Financial
1,107
(
2)
Top
10
Asset
Managers
(1)
2013
Total
Assets
($
billions)
TH |
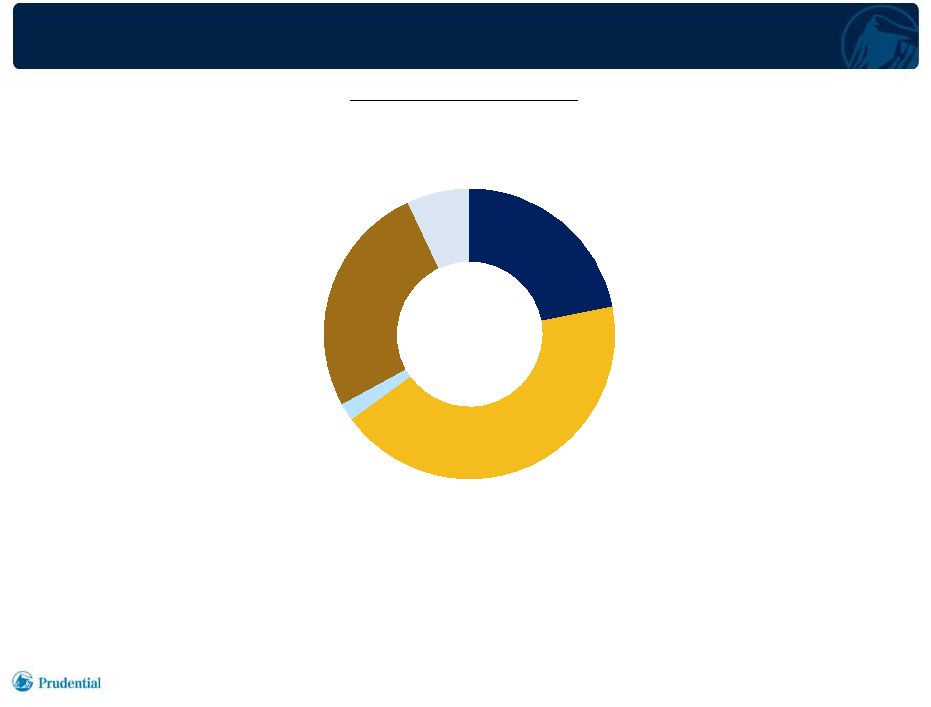 REVENUES
WELL-BALANCED ACROSS CLIENT GROUPS Investor Day 6.4.2014
5
1)
Year ended 12/31/2013.
•
78% of fee-based revenues from clients outside of the General Account
•
Balanced revenue base across institutional, retail, and affiliated clients
Asset
Management
Fees
(1)
General Account
22%
Third Party
Institutional
43%
Affiliated
Institutional
2%
Third Party
Retail
26%
Affiliated Retail
7%
$1.88 billion |
 ROBUST
INSTITUTIONAL CLIENT BASE •
Over
1,100
third
party
clients
(1)
•
60
third
party
clients
with
more
than
$1
billion
invested
with
us
(1)
–
46 U.S. clients
–
14 international clients
•
7
out
of
top
10
Fortune
500
companies
(2)
•
24
out
of
largest
25
corporate
U.S.
pension
plans
(3)
•
24
out
of
largest
25
public
U.S.
pension
plans
(3)
•
116
out
of
largest
300
global
pension
funds
(4)
Investor Day 6.4.2014
6
1)
As of 3/31/2014.
2)
Based on CNN Money, Fortune 500 annual ranking of America’s largest
corporations as of 12/31/2013, published January 2014. 3)
Based on U.S. Plan Sponsor rankings in Pensions & Investments as of
9/30/2013, published January 2014. 4) P&I/Towers
Watson Top 300 Pension Funds ranking, as of 12/31/2012, published September 2013. |
 DIVERSIFIED PRODUCT OFFERING
Investor Day 6.4.2014
7
1)
Includes both traditional and alternative asset allocation products.
•
Broad range of investment capabilities tailored to evolving client needs
•
Accessed through proven multi-manager model
PUBLIC FIXED
INCOME
U.S. Broad Market: Core
Conservative, Core, and Core
Plus, and Absolute Return
U.S., European, and Global IG
Corporate
Global Leveraged Finance
Global and Emerging Market
Debt
Municipal Bonds
Short, Intermediate, and Long
Duration
Liability Driven Investing
EQUITY
Large Cap Growth Equity
Large Cap Value Equity
Large Cap Core Equity
Global, Developed, and
Emerging Markets
Small and Mid Cap Equity
Opportunistic Equity
Sector Strategies
Equity Indexing
Structured Equity
Fundamental and Quantitative
REAL ESTATE
Core, Value Add, and
Opportunistic
U.S., Europe, Latin America,
Middle East, and Asia
Global Real Estate Securities
U.S. and European Real Estate
Debt
Commercial Mortgages
ALTERNATIVES
Long / Short Fixed Income
Emerging Markets
Relative Value
Collateralized Loan Obligations
Bank Loans
Mezzanine
Global Tactical Asset Allocation
Equity Long / Short
Market Neutral
Multi-Asset Class
(1)
PRIVATE FIXED
INCOME
Privately Placed Debt
Commercial Mortgages
Agricultural Debt |
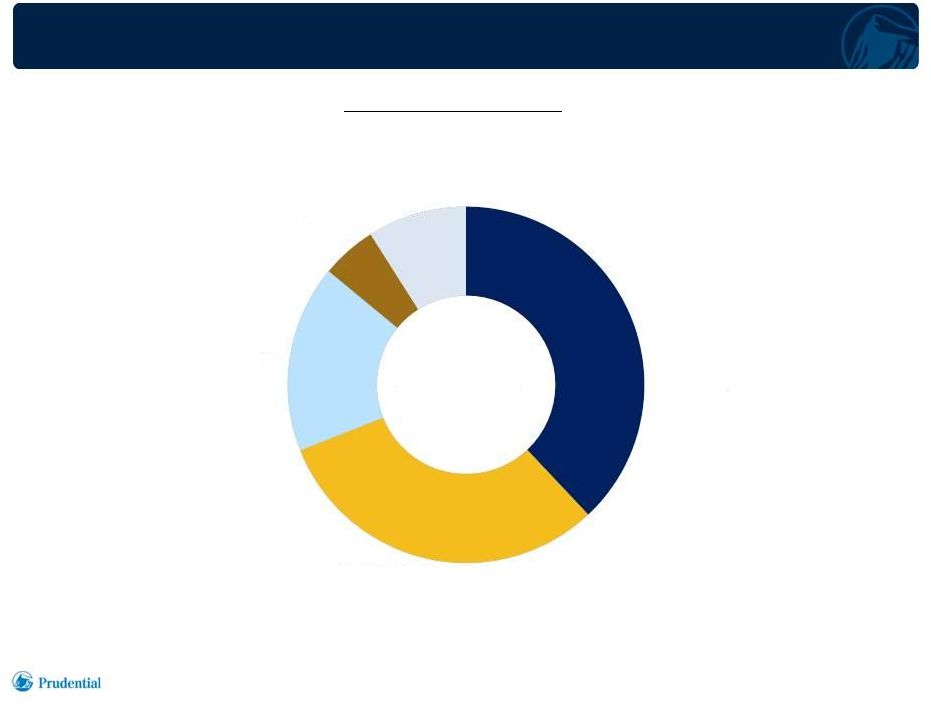 ASSET
CLASS MIX DIVERSIFIES FEE REVENUE Investor Day 6.4.2014
8
1)
Year ended 12/31/2013. Alternatives included in relevant underlying asset
classes. Asset
Management
Fees
(1)
$1.88 billion
Public Fixed
Income
38%
Public Equity
31%
Real Estate
17%
Commercial
Mortgages
5%
Private Fixed
Income
9% |
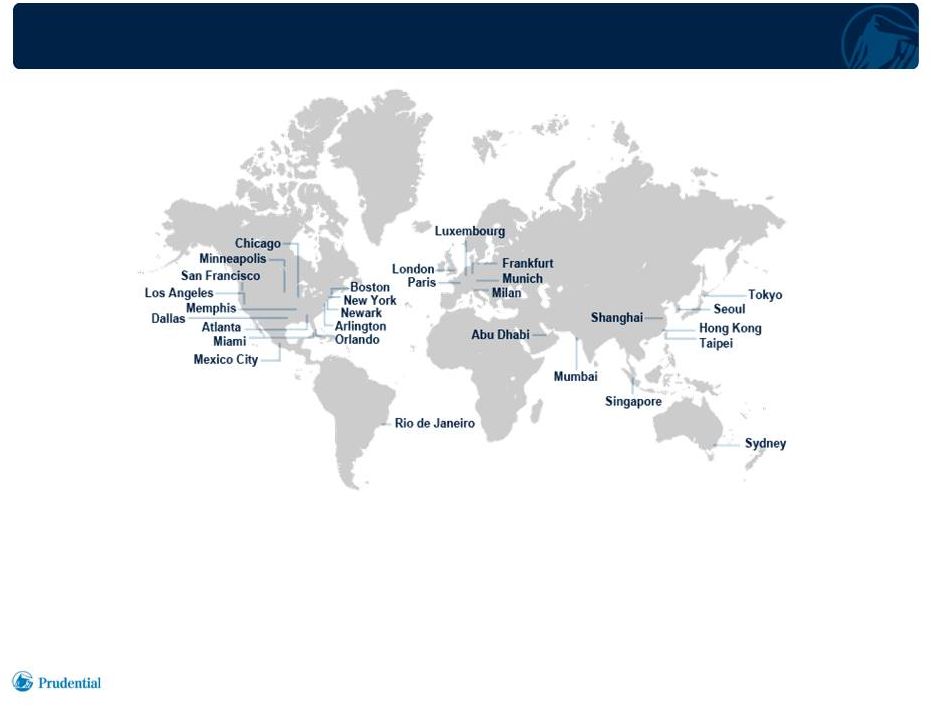 GLOBAL
FOOTPRINT Investor Day 6.4.2014
9
•
30
offices
on
5
continents
(1)
•
Broad global investment platform and client facing capability
•
Building out Global Institutional Relations Group to deepen coverage of sovereign
wealth funds and central
banks
–
currently
managing
over
$26
billion
in
assets
(1)
1)
As of 3/31/2014.
Note: Rio de Janeiro, Milan, and Shanghai are offices for joint ventures where
Prudential has a minority stake. |
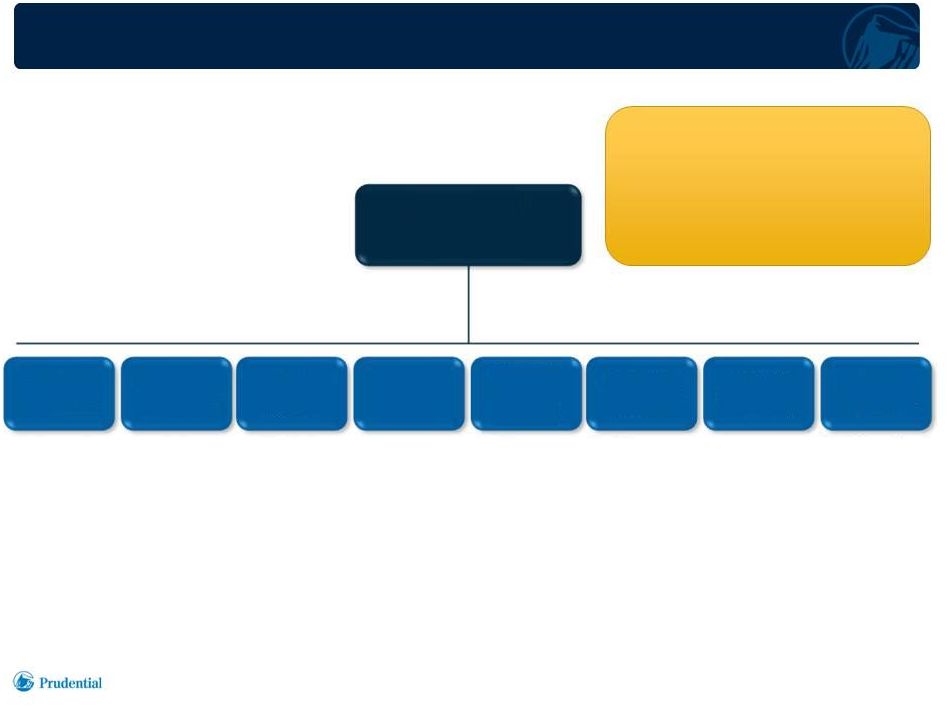 DISTINCT
MULTI-MANAGER MODEL 10
Investor Day 6.4.2014
•
Power of Focus
•
Clarity of Accountability
•
Strength of Diversification
Fundamental
Equity and Fixed
Income
Quantitative
Equity and Asset
Allocation
Public Fixed
Income
Private
Placement and
Mezzanine Debt
Real Estate
Debt
Real Estate
Equity
Local market
asset managers
in Asia, Europe
and Latin America
U.S. Mutual Fund
Distribution and
Research
Prudential
Investment
Management
Jennison
Associates
Quantitative
Management
Associates
Prudential
Fixed
Income
Prudential
Capital
Group
Prudential
International
Investments
Prudential
Real Estate
Investors
Prudential
Mortgage
Capital
Company
Prudential
Investments
•
Autonomy of investment process and business decisions
•
Product design done at affiliate level
•
Talent, culture, and people decisions made at affiliate level
|
 OUR
DISCUSSION TODAY •
Prudential is a leading global asset manager with a distinct multi-
manager model
Investor Day 6.4.2014
11
•
The Asset Management business has robust underlying
fundamentals and attractive shareholder returns
•
Asset Management is a source of competitive advantage for the other
Prudential businesses
•
Prudential continues to invest in the Asset Management business and in
its people to drive further growth |
 •
Consistent, strong investment performance for clients
•
Deep manager experience and robust investment
processes drive Alpha generation
•
26 consecutive quarters of positive institutional net flows
(1)
•
Rapidly growing retail business, including mutual funds
•
14% annual AUM growth over past 5 years
(2)
•
Earnings driven primarily and increasingly by asset
management fees
•
Strong and attractive returns with improved quality
of earnings
ROBUST UNDERLYING FUNDAMENTALS
Investor Day 6.4.2014
12
Investment
Performance
Client
Flows
Earnings
1)
Through 3/31/2014.
2)
Assets managed by the Asset Management segment as of 12/31/2013.
|
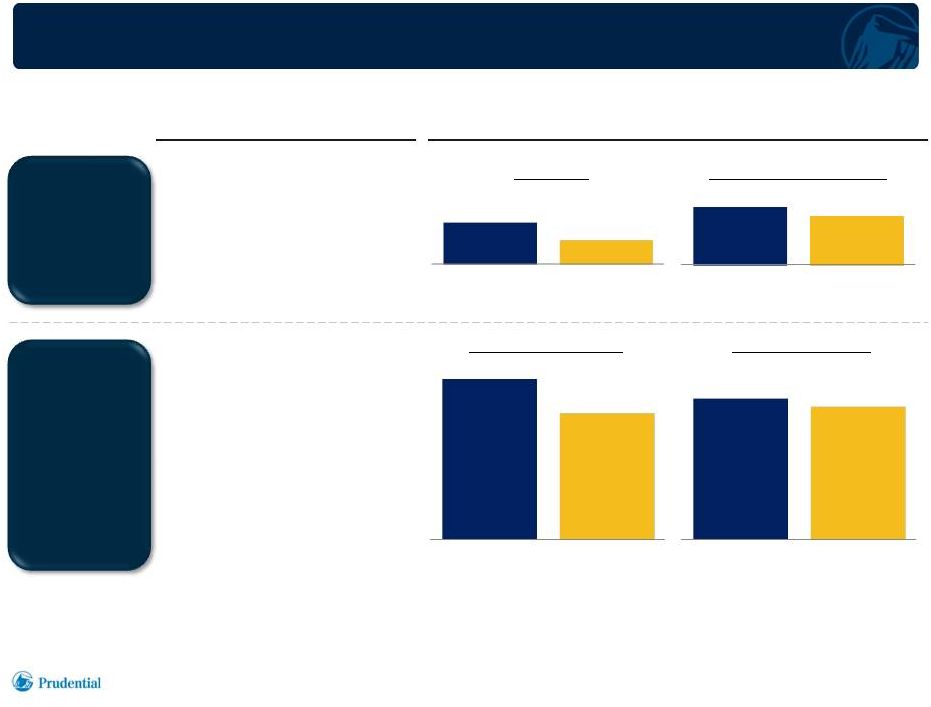 STRONG
INVESTMENT PERFORMANCE Investor Day 6.4.2014
13
Fixed
Income
%
of
AUM
above
Benchmark
(1)
Net of Fees, 3-Year Period
82%
84%
Performance
of
Select
Strategies
(2)
Net of Fees, 3-Year Period
Large Cap Growth
Core Plus
Equity
Emerging Markets Debt
U.S. Small Cap Core
20.5%
5.7%
3.3%
Asset Management
Barclays U.S.
Aggregate
7.2%
6.1%
Asset
Management
JPM EMBI Global
Diversified
15.7%
Asset
Management
Russell 2000
17.5%
16.5%
Asset
Management
Russell 1000
Growth
1)
Based on all actively managed Fixed Income and Equity AUM reported in eVestment for Jennison
Associates, Prudential Fixed Income, and Quantitative Management Associates. Composite assets
reported in eVestment assumed to represent full strategy AUM. As of 12/31/2013.
2)
Performance reported in eVestment as of 12/31/2013. Core Plus and Emerging Markets Debt managed by
Prudential Fixed Income, U.S. Small Cap Core managed by Quantitative Management Associates, and
Large Cap Growth managed by Jennison Associates. |
 DEEP
MANAGER EXPERIENCE, STRONG INVESTMENT PROCESSES
Investor Day 6.4.2014
14
•
Deep, stable, and experienced investment talent base
–
Average
manager
tenure
of
16
years
with
Prudential,
22
years
in
industry
(1)
–
Established track records
–
Long-standing
client
relationships
–
over
100
clients
for
more
than
20
years
(1)
•
Rigorous fundamental and quantitative research heritage
•
Distinct, autonomous investment processes with key common elements:
–
Consistent and team based
–
Well-defined
–
Institutional-quality
•
Robust risk management framework
1)
As of 3/31/2014. |
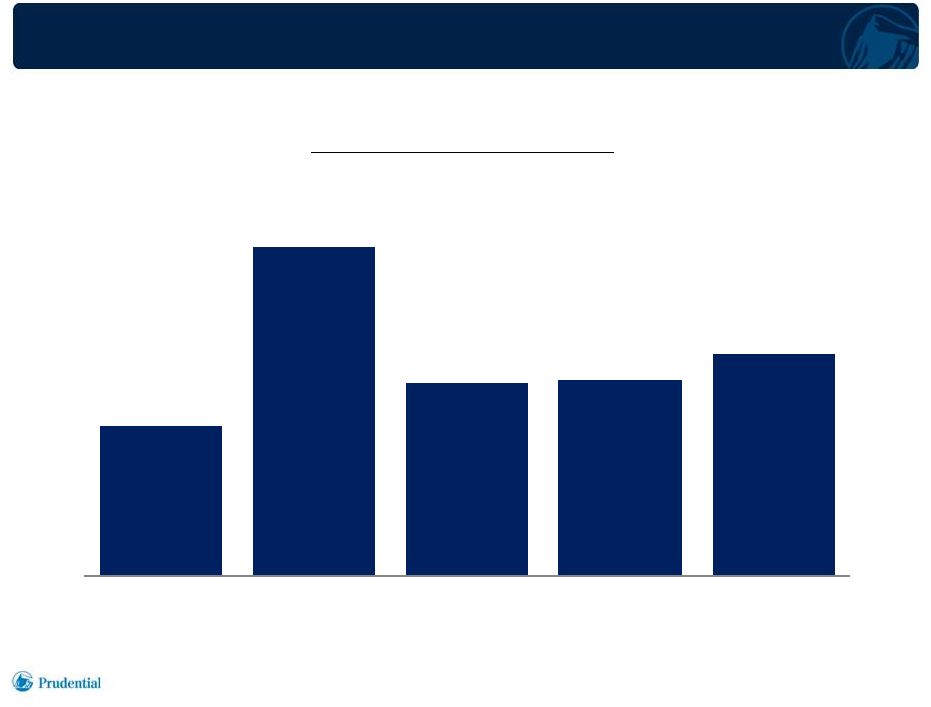 26
CONSECUTIVE QUARTERS OF POSITIVE
INSTITUTIONAL
NET
FLOWS
(1)
Investor Day 6.4.2014
15
Third
Party
Institutional
Net
Flows
(2)
($ billions)
13.2
28.7
16.9
17.2
19.4
2009
2010
2011
2012
2013
1)
Through 3/31/2014.
2)
Excludes money market activity. |
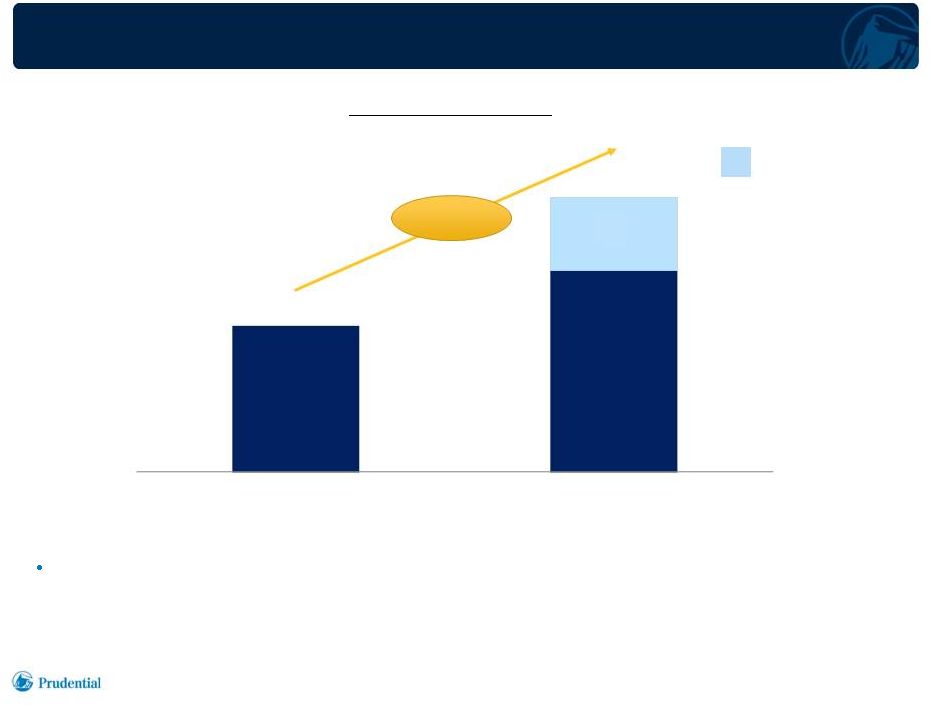 FAST
GROWING RETAIL BUSINESS DRIVEN BY NET FLOWS Investor Day 6.4.2014
16
Third
Party
Retail
AUM
(1)
($ billions)
Our retail business has grown organically over the last 5 years as we have
strengthened and diversified our distribution capabilities and product line
and realized strong investment performance AUM attributable to
net
flows,
2010-13
(2)
1)
At end of period.
2)
Excludes money market activity.
17%
CAGR
61
115
31
2009
2013 |
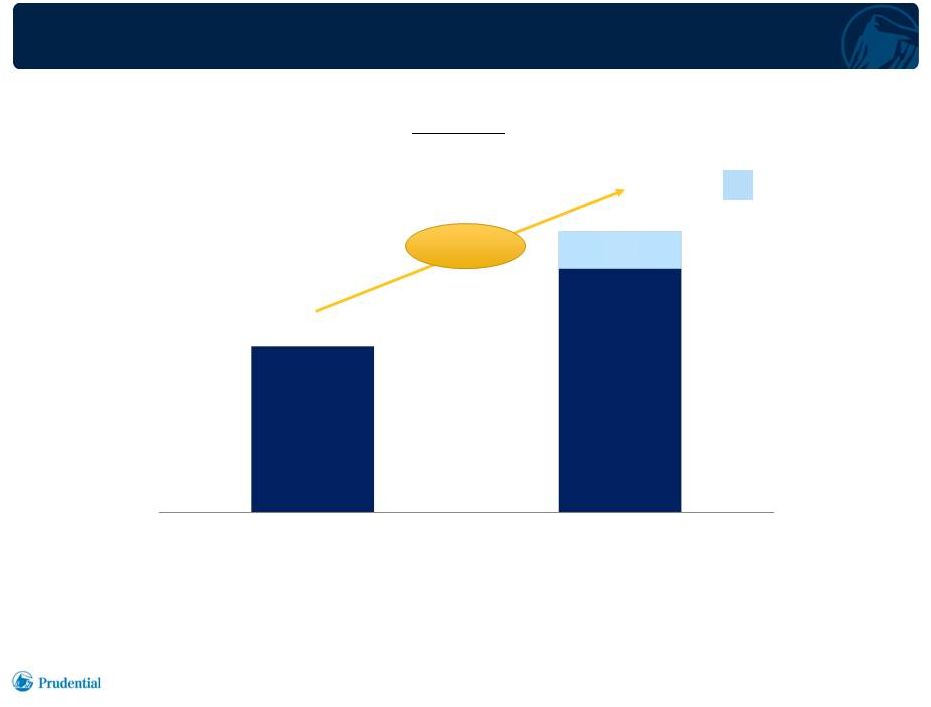 STRONG
ORGANIC GROWTH OVER THE LAST 5 YEARS Investor Day 6.4.2014
17
Total AUM
(1)
($ billions)
P&I Ranking
(3)
13
10
1)
For Asset Management segment, at end of period.
2)
Excludes money market activity.
3)
Pensions & Investments
Top Money Managers list.
AUM attributable
to third party net
flows, 2010-13
(2)
14%
CAGR
515
870
113
2009
2013 |
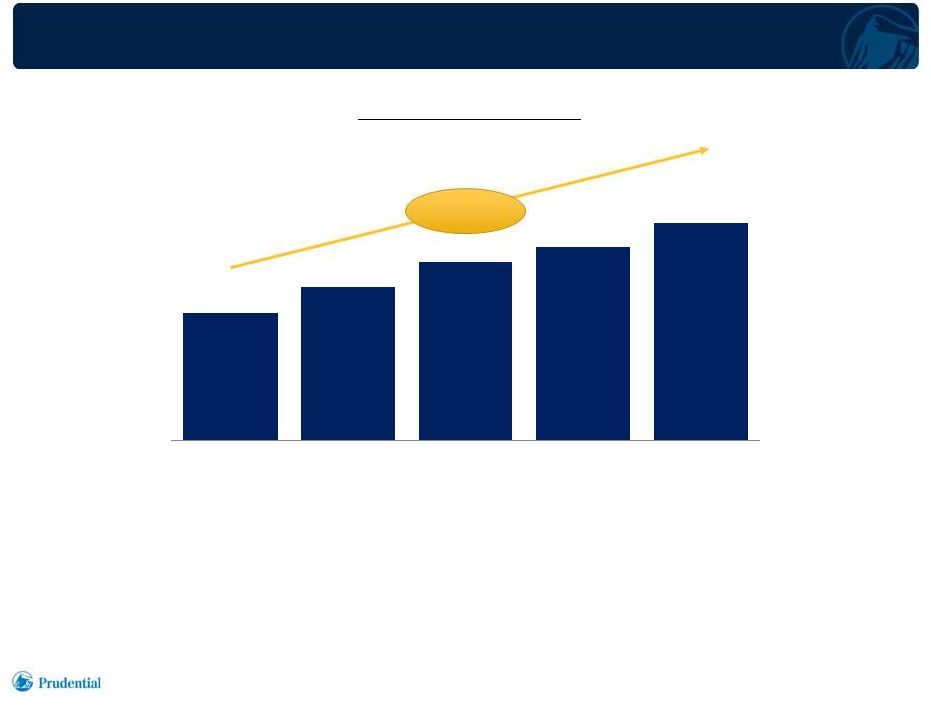 GROWING
FEE BASE Investor Day 6.4.2014
18
•
Our consistent and strong investment performance, broad client base, and
diversified product capabilities have led to strong net flows
•
Net flows, combined with market appreciation, have led to consistently higher and
stable fee- based revenues
1,097
1,326
1,541
1,667
1,881
2009
2010
2011
2012
2013
Asset
Management
Fees
($ millions)
14%
CAGR |
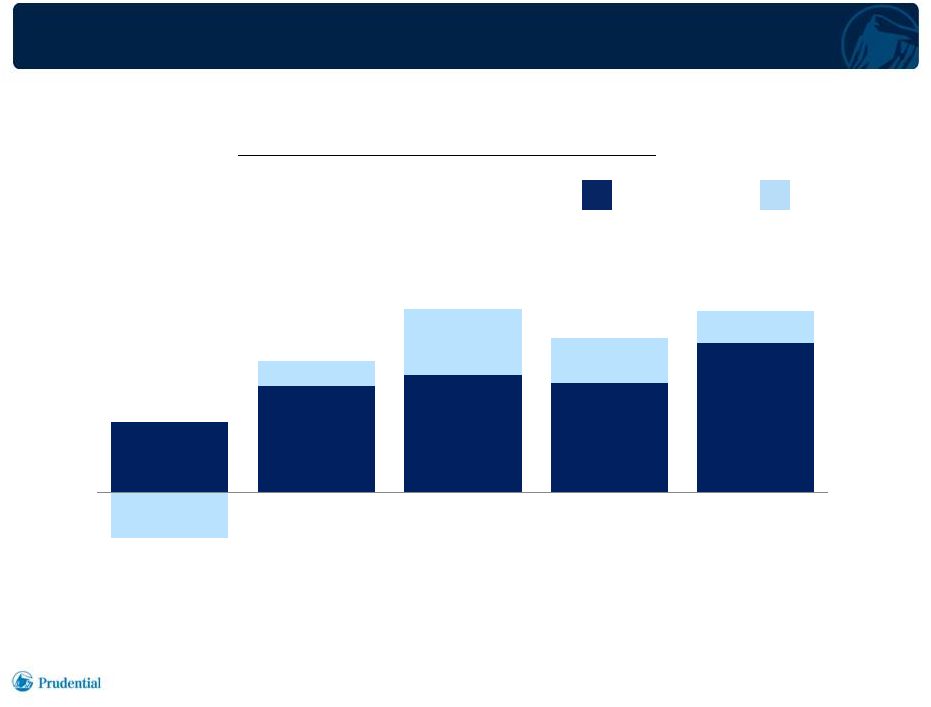 STRONG,
STABLE, FEE-BASED CONTRIBUTION TO ENTERPRISE
Investor Day 6.4.2014
19
Asset
Management
Adjusted
Operating
Income
(1)
($ millions)
1)
Pre-tax; Adjusted Operating Income (AOI) excluding market driven and
discrete items as disclosed in company earnings releases.
2)
Other Related Revenue (ORR) on AOI basis, after associated direct costs; includes
net incentive fees, net transaction fees, strategic investing AOI, and
commercial mortgage revenue, excluding agency origination activities.
Excluding ORR
(2)
ORR
(2)
2009
2010
2011
2012
2013
279
426
468
438
595
(187)
97
263
180
128
92
523
731
618
723 |
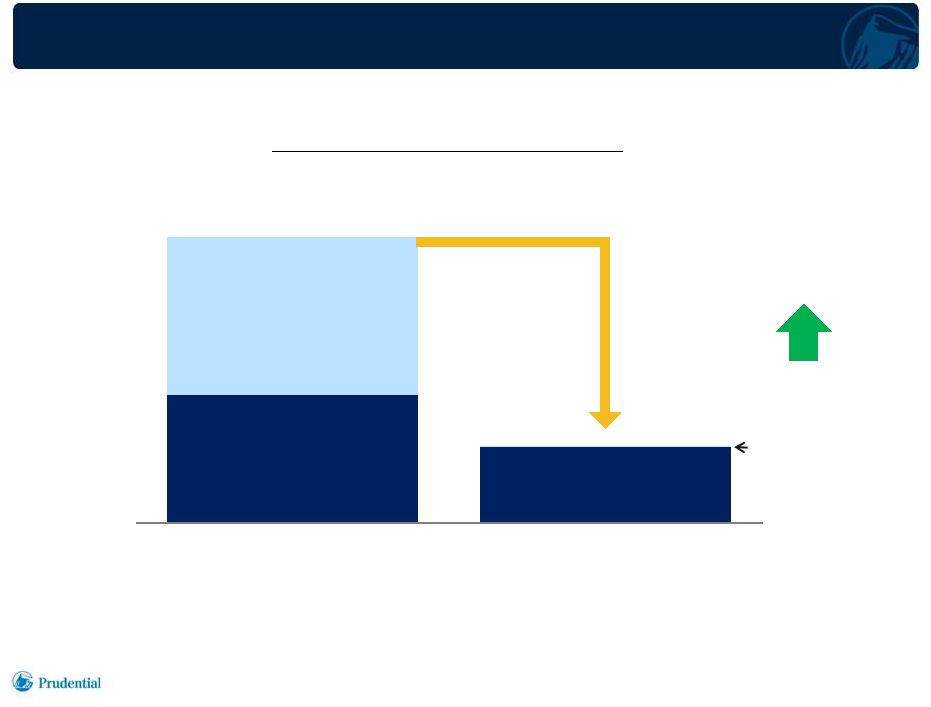 1,529
911
1,900
IMPROVING RISK PROFILE CONTRIBUTES TO
ROE PERFORMANCE
Investor Day 6.4.2014
20
Investments
and
Interim
Loan
Portfolio
Interim Loan
Portfolio
(1)
Strategic
Investments
ROE
($ millions)
$3,429
$933
Required Equity
$760
$420
1)
Principal balance of outstanding loans.
12/31/08
3/31/14
22 |
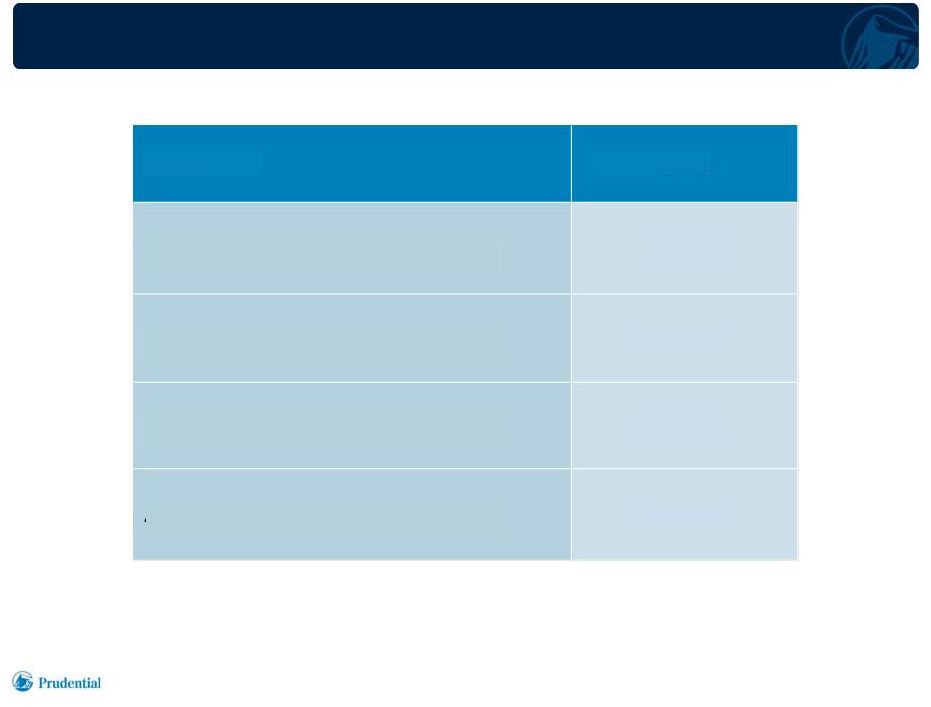 2013 KEY
FINANCIAL METRICS Investor Day 6.4.2014
21
1)
For Asset Management segment; as of 12/31/13.
Asset
Management
Fees
($
millions)
$1,881
Pre-Tax
AOI
($ millions)
$723
Operating Margin
27%
AUM
($ billions)
(1)
$870
Metric
2013 |
 OUR
DISCUSSION TODAY •
Prudential is a leading global asset manager with a distinct multi-
manager model
Investor Day 6.4.2014
22
•
The Asset Management business has robust underlying fundamentals
and attractive shareholder returns
•
Asset Management is a source of competitive advantage for the
other Prudential businesses
•
Prudential continues to invest in the Asset Management business and in
its people to drive further growth |
 COLLABORATING WITH OUR AFFILIATES
TO GENERATE ENTERPRISE VALUE
Investor Day 6.4.2014
23
•
Higher investment margins for the General Account
–
Private Fixed Income and Commercial Mortgages have historically led to
higher returns
•
Capacity
to
manage
significant
additional
General
Account
assets
with
existing infrastructure
•
Culture of product innovation, collaborating with Annuities and Retirement
to meet client needs
–
Annuities:
AST
Investment
Grade
Bond
Portfolio,
AST
Multi-Sector
Fixed
Income Portfolio
–
Retirement:
Pension
Risk
Transfer,
Stable
Value
•
Opportunity to compete on our affiliated Annuities and Retirement platforms
|
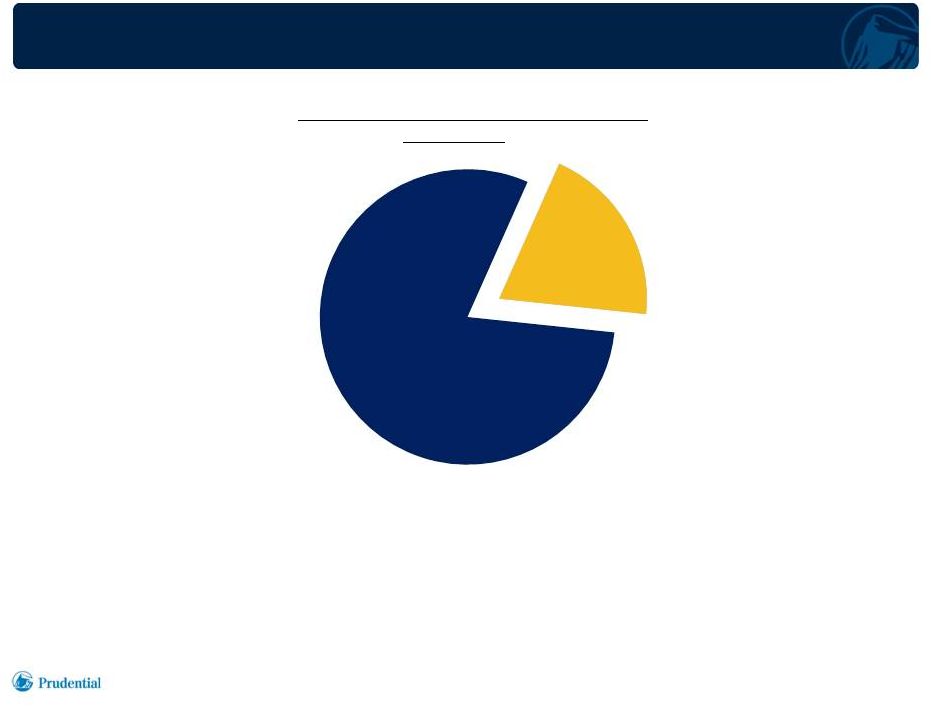 PRIVATES
IMPROVE INVESTMENT MARGIN FOR THE GENERAL ACCOUNT
Investor Day 6.4.2014
24
$334 billion
(1)
•
Asset Management capabilities and strengths in Private Fixed Income and Commercial
Mortgage originations and underwriting provide a strategic advantage to the
General Account •
Privates
have
historically
led
to
higher
returns
for
the
General
Account
versus
the
comparable
Public asset classes
Other
Investments
80%
Privates
(2)
20%
1)
General Account portfolio for the Financial Services Businesses; excludes (i) assets of our asset
management operations, including assets managed for third parties, (ii) derivative operations
and (iii) those assets classified as “Separate account assets” on our balance sheet. As of 3/31/2014; at balance sheet carrying amount.
2)
Privates, totaling $65.1 billion, includes private debt managed by Prudential Capital Group and
commercial mortgages managed by Prudential Mortgage Capital Company. General
Account
Investment
Portfolio |
 OUR
DISCUSSION TODAY •
Prudential is a leading global asset manager with a distinct multi-
manager model
Investor Day 6.4.2014
25
•
The Asset Management business has robust underlying fundamentals
and attractive shareholder returns
•
Asset Management is a source of competitive advantage for the other
Prudential businesses
•
Prudential continues to invest in the Asset Management business
and in its people to drive further growth |
 STRATEGICALLY POSITIONED FOR GROWTH
Investor Day 6.4.2014
26
•
Prudential Investment Management has made targeted investments in
our people, investment capabilities, and in other strategic areas
–
Over 50 new investment products and strategies launched since 2012
–
Over $400 million in focused seed capital committed at year-end 2013
–
Over 40 new middle and senior management positions created since
2013
•
Globalization and investors’
changing approach to asset allocation
provide a foundation for Asset Management growth opportunities
•
Prudential Investment Management is investing in new capabilities and
talent to take advantage of market trends |
 MARKET
TRENDS PROVIDE THE BACKDROP FOR GROWTH Investor Day 6.4.2014
27
•
Investor Base
•
Investments
•
Talent
•
Non-Correlated
Alternatives
•
Retirement
Income
•
Real Assets,
Infrastructure
•
Volatility
Managed
•
Solutions
•
Liability Driven
Investing
•
De-Risking
•
Outcomes
Globalization
Shift in Investment
Orientation
Broadening of
Investment
Categories |
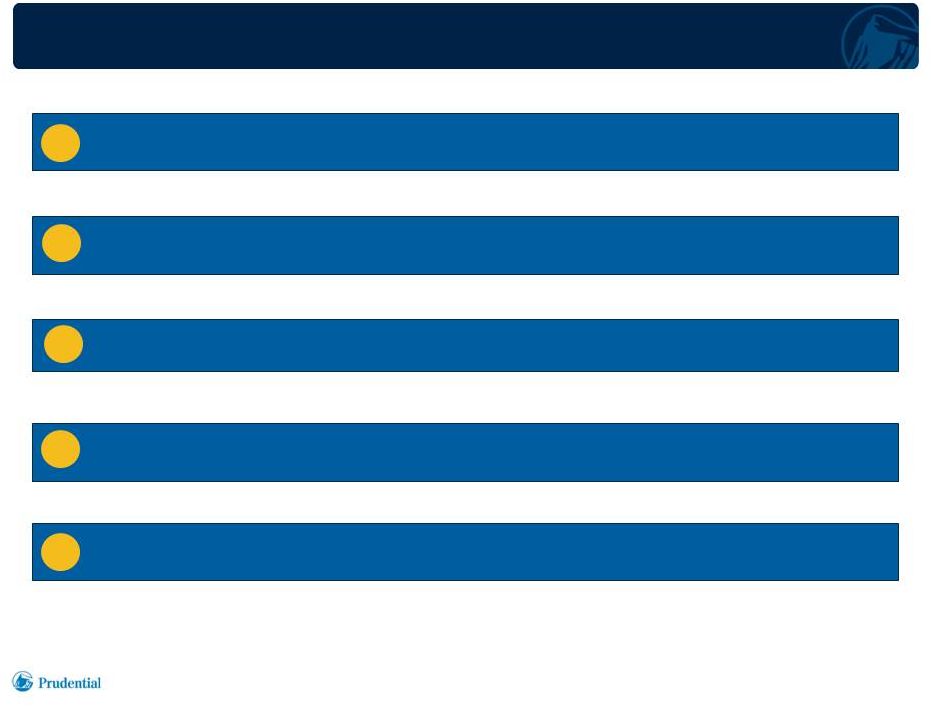 KEY
STRATEGIC PRIORITIES Investor Day 6.4.2014
28
Continue to build a more resilient, diversified business portfolio
1
Continue to globalize our product and client footprint
Develop broader solutions capability
Evaluate disciplined team lift outs and bolt on acquisitions
4
Partner
with
other
Prudential
businesses
to
leverage
enterprise
capabilities
5
2
3 |
 CONCLUSION
•
Prudential is a leading global asset manager with a distinct multi-
manager model
Investor Day 6.4.2014
29
•
The Asset Management business has robust underlying fundamentals
and attractive shareholder returns
•
Asset Management is a source of competitive advantage for the other
Prudential businesses
•
Prudential continues to invest in the Asset Management business and in
its people to drive further growth |
 CHARLES LOWREY
EXECUTIVE VICE PRESIDENT AND
CHIEF OPERATING OFFICER
INTERNATIONAL
PRUDENTIAL INTERNATIONAL INSURANCE |
 KEY
MESSAGES 2
Investor Day 6.4.2014
1)
Return on equity.
•
Proven, superior business model
•
High ROE
(1)
and low volatility earnings primarily driven by stable
mortality and expense margins
•
Captive distribution provides sustainable competitive advantage
•
Well-positioned in attractive Japanese insurance market
•
Solid risk management
•
Sustained capital generation and deployment |
 3
Investor Day 6.4.2014
AGENDA
•
Proven, Superior Business Model
•
High ROE & Low Volatility Earnings
•
Captive Distribution -
Life Planner
•
Captive Distribution -
Life Consultant
•
Supplemental Distribution Channels
•
Well-Positioned in Attractive Japanese Insurance Market
•
Risk Management, Capital Generation and Deployment |
 THE LIFE
PLANNER MODEL FOUNDATION OF OUR SUCCESS
4
Investor Day 6.4.2014
•
Began in 1988
•
Differentiated approach for the Japanese life insurance market
•
Proprietary distribution through selective, high-quality sales force
•
Emphasize protection products requiring analysis of client needs
•
Target the affluent and mass affluent consumer; serve small business
and professional markets |
 EXPANSION
THROUGH DIVERSIFICATION 5
Investor Day 6.4.2014
•
Life
Consultants
(1)
expand
proprietary
distribution
coverage
to middle-market customers, and have strong affinity
group relationships
•
Supplemental distribution through banks and independent agents
expands access to investible wealth, geographical coverage and
business market
•
Product
diversification
to
meet
clients’
financial
security
needs
over
a lifetime
•
Pursue opportunities in limited number of attractive countries
outside Japan
Maintain Discipline, Quality, Solid Execution;
Guided by Life Planner Business Model Concepts
1)
The formal name for Life Consultant is Life Plan Consultant.
|
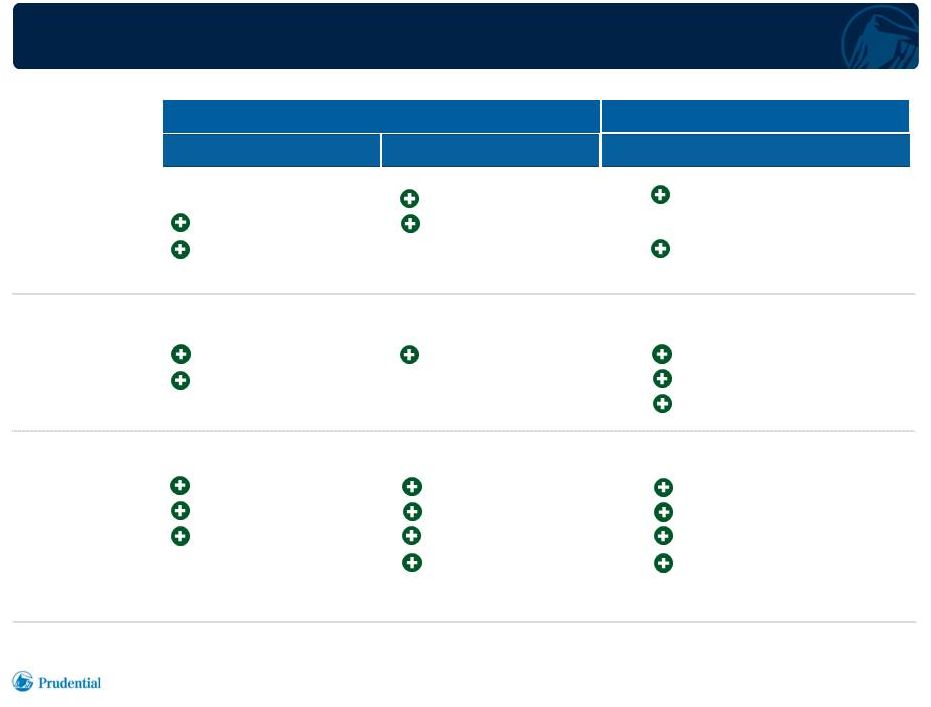 MEETING
CUSTOMER NEEDS THROUGH PRODUCT AND CHANNEL EXPANSION
6
Investor Day 6.4.2014
Customer
Segment
Primary
Customer
Needs
Product
Solution
Captive Channels
Life Planner
Distribution
Affluent
Death protection
Whole life & Term
Middle-market
Affinity groups
Life Consultant
Death protection
Retirement
Whole life & Term
Retirement income
USD products
Accident & Health
Multi-currency fixed
annuities
Death protection
Mass affluent
Business and
professional market
Retirement
Business planning
Retirement income
USD products
Accident & Health
Third Party Channels
Bank / Independent Agency
High net worth
Business and
professional market
Retirement
Business planning
Savings
Whole life & Term
Retirement income
USD products
Accident & Health
Multi-currency fixed
annuities |
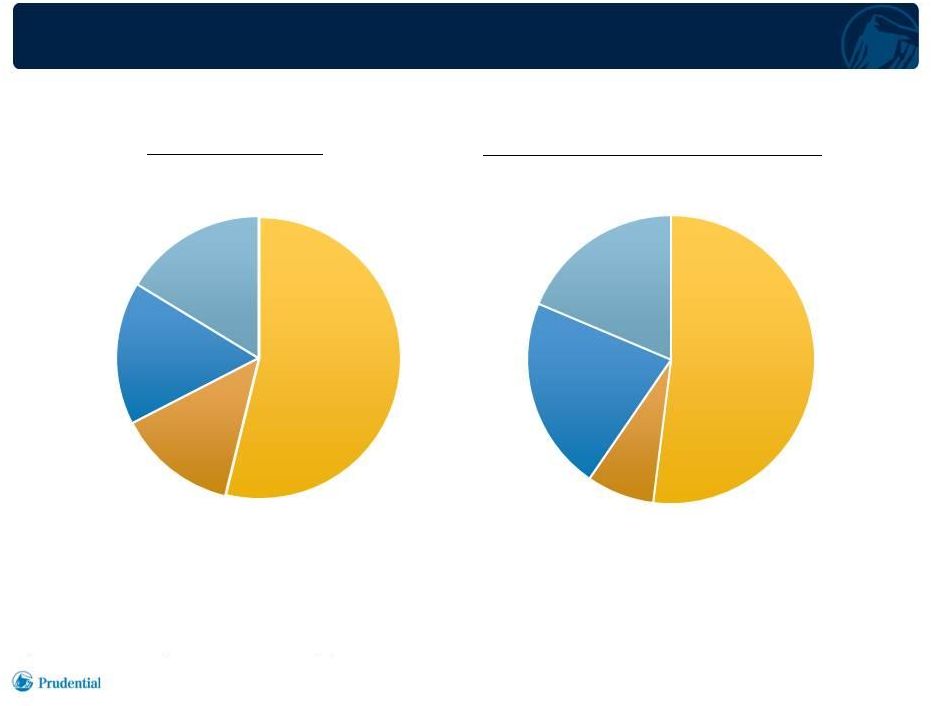 EMPHASIS
ON PROTECTION PRODUCTS 7
Investor Day 6.4.2014
Savings
(4)
18%
Accident
& Health
8%
Retirement
22%
Death
Protection
52%
1)
As of 12/31/2013. Annualized premiums in force, including paid-up
policies and 10% of single premium. Japan only. 2)
Foreign denominated activity translated to U.S. dollars at uniform exchange rates
for all periods presented; including Japanese yen 82 per U.S. dollar.
U.S. dollar denominated activity is included based on the amounts as transacted in
U.S. dollars. 3)
For the year ended 12/31/2013. Japan only.
4)
Includes annuities and yen based bank channel single premium whole life.
Premiums
In
Force
(1),(2)
Annualized
New
Business
Premiums
(2),(3)
Savings
(4)
16%
Retirement
16%
Accident &
Health
14%
Death
Protection
54% |
   SUCCESSFUL
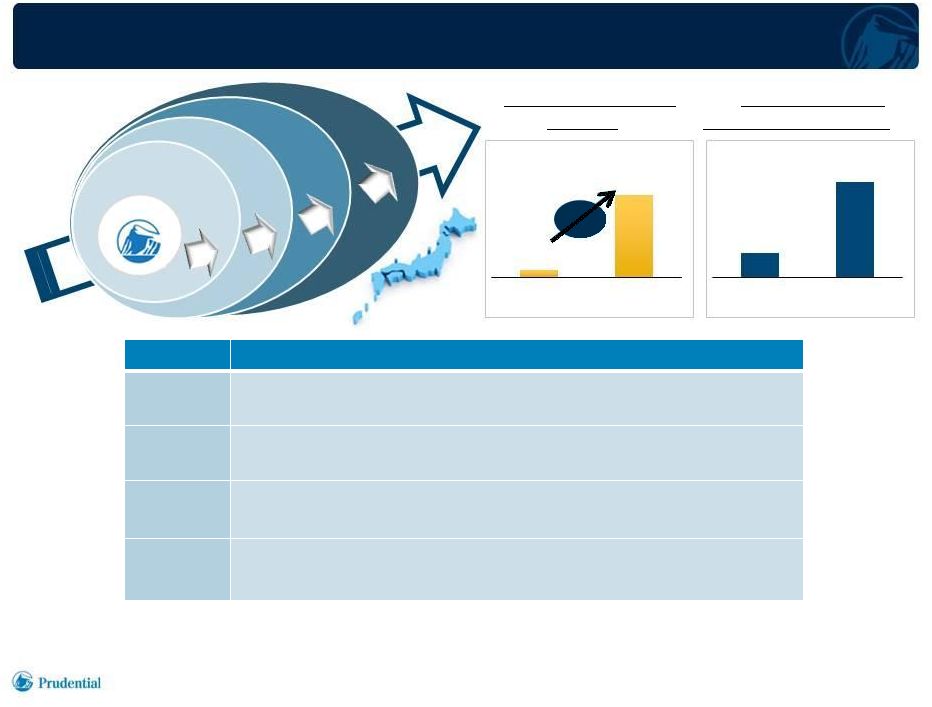
TRACK RECORD OF ACQUISITIONS AND BUSINESS INTEGRATIONS
8
Number of In Force
Policies
(1)
Investor Day 6.4.2014
Kyoei
Aoba
Yamato
Star /
Edison
POJ
(millions)
11x
Annualized New
Business
Premiums
(1),(2)
($ millions)
Timeline
Timeline
Acquisitions
Acquisitions
2001
•
Kyoei
Life,
Japan
–
acquired
in
bankruptcy
•
Predecessor of today’s Gibraltar Life
2004
•
Aoba Life, Japan
•
Integrated into Prudential of Japan
2009
•
Yamato Life, Japan
•
Integrated into Gibraltar Life
2011
•
AIG Star Life & AIG Edison Life, Japan
•
Merged into Gibraltar Life
0.9
10.2
3/31/2001
3/31/2014
713
2001
2013
2,773
1)
Japan only.
2)
Foreign denominated activity translated to U.S. dollars at uniform exchange rates for all periods
presented; Japanese yen 82 per U.S. dollar. |
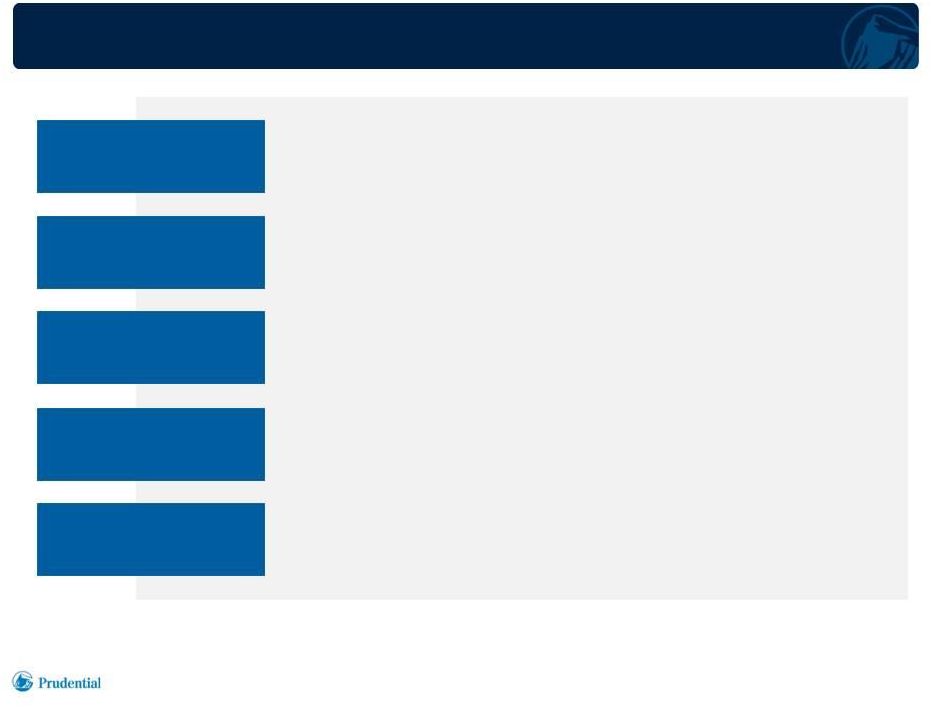 STAR/EDISON INTEGRATION SUBSTANTIALLY COMPLETE
9
Investor Day 6.4.2014
Integration Costs
Integration Costs
Cost Savings
Cost Savings
More Productive
More Productive
Sales Force
Sales Force
•
Incurred $340 million through 2013; total expected
approximately $400 million, down $100 million from
original estimate
•
Substantially achieved targeted $250 million
annualized cost savings as of fourth quarter 2013
•
Implemented agent training program, productivity
standards and variable compensation
Integrated Product
Integrated Product
Portfolio
Portfolio
•
Replaced lower margin product portfolio with higher
margin products
•
Investment portfolio composition aligned with
Prudential quality standards
De-risked
Investment Portfolio |
 10
Investor Day 6.4.2014
AGENDA
•
Proven, Superior Business Model
•
High ROE & Low Volatility Earnings
•
Captive Distribution -
Life Planner
•
Captive Distribution -
Life Consultant
•
Supplemental Distribution Channels
•
Well-Positioned in Attractive Japanese Insurance Market
•
Risk Management, Capital Generation and Deployment |
 11
Investor Day 6.4.2014
1)
Pre-tax adjusted operating income (AOI) excludes market driven and discrete
items as disclosed in company earnings releases. 2)
Hedged foreign currency exchange rate for Japanese yen per U.S. dollar.
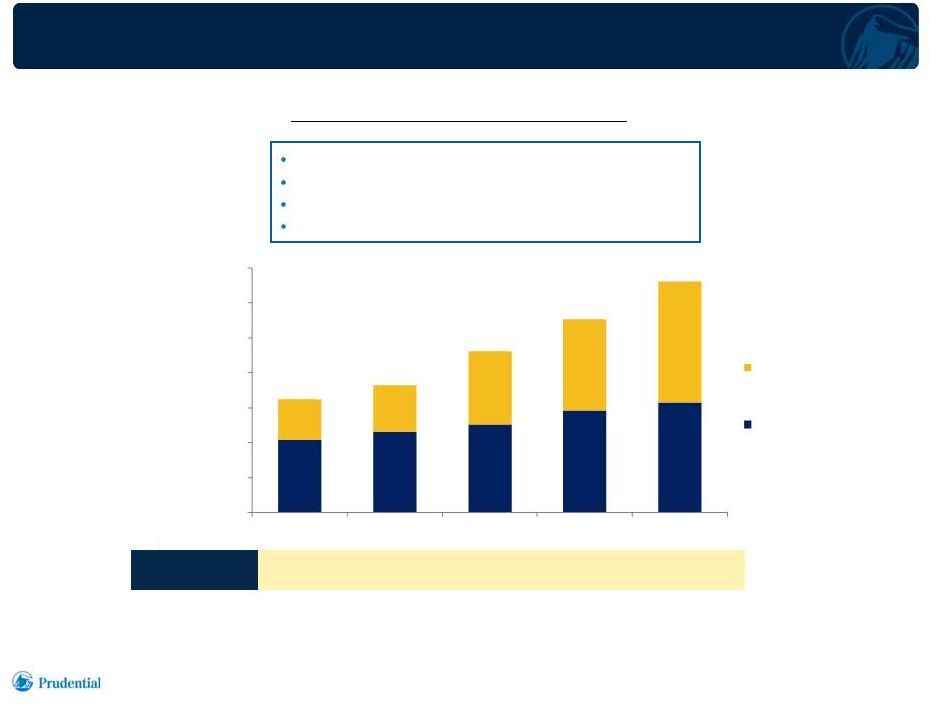
SUSTAINED EARNINGS GROWTH
Pre-Tax
Adjusted
Operating
Income
(1)
($ millions)
1,622
1,821
2,308
2,762
3,304
Organic growth
Star/Edison acquisition
Favorable hedged currency trend through 2013
Other “tailwinds”
in 2013
106
AOI FX Rate
(2)
99
92
85
80
$0
$500
$1,000
$1,500
$2,000
$2,500
$3,000
$3,500
2009
2010
2011
2012
2013
Gibraltar Life and
Other Operations
Life Planner
Operations |
 HIGH
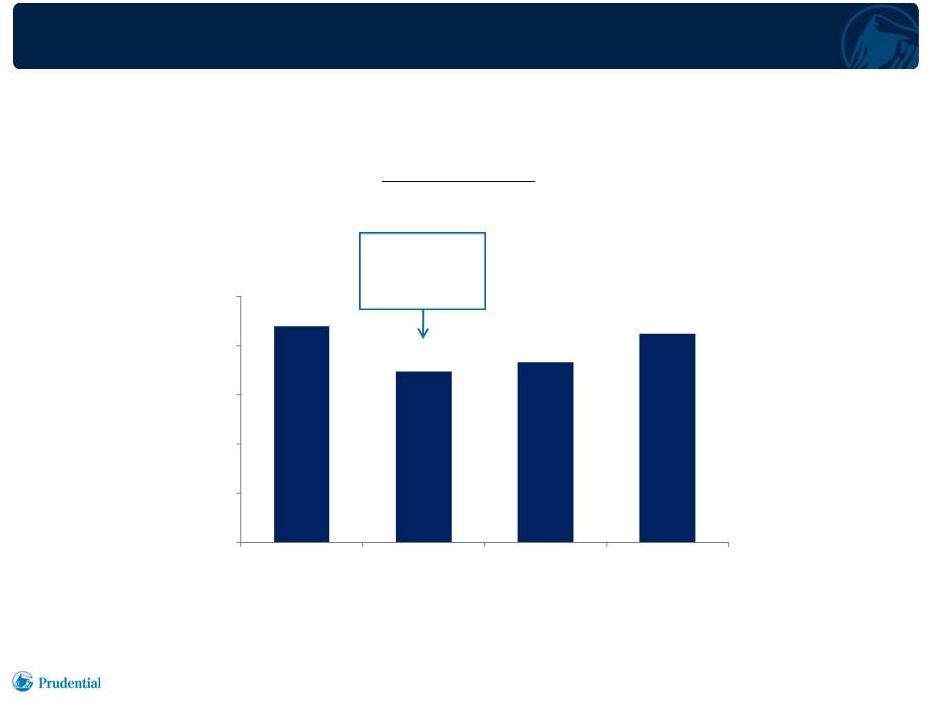
RETURN ON EQUITY DRIVEN BY FUNDAMENTALS 12
Investor Day 6.4.2014
1)
Based on after-tax AOI of our International Insurance operations, excluding
market driven and discrete items as disclosed in company earnings releases, using
overall effective tax rate for the Financial Services Businesses, and associated
attributed equity excluding accumulated other comprehensive income and the
impact of foreign currency exchange rate remeasurement.
•
ROE has improved including Star/Edison business integration following
2011 acquisition
Return
on
Equity
(1)
22.0%
17.4%
18.3%
21.2%
February 2011
Star/Edison
Acquisition
0.0%
5.0%
10.0%
15.0%
20.0%
25.0%
2010
2011
2012
2013 |
 13
Investor Day 6.4.2014
•
Proven, Superior Business Model
•
High ROE & Low Volatility Earnings
•
Captive Distribution -
Life Planner
•
Captive Distribution -
Life Consultant
•
Supplemental Distribution Channels
•
Well-Positioned in Attractive Japanese Insurance Market
•
Risk Management, Capital Generation and Deployment
AGENDA |
 CAPTIVE
DISTRIBUTION PROVIDES SUSTAINABLE COMPETITIVE ADVANTAGE
14
Investor Day 6.4.2014
•
Affluent and mass affluent
consumers
•
Business and professional market
•
Mass middle-market
•
Affinity group relationships
•
Broad geographical coverage
Life Planner
Prudential of
Japan
Life Consultant
Gibraltar Life |
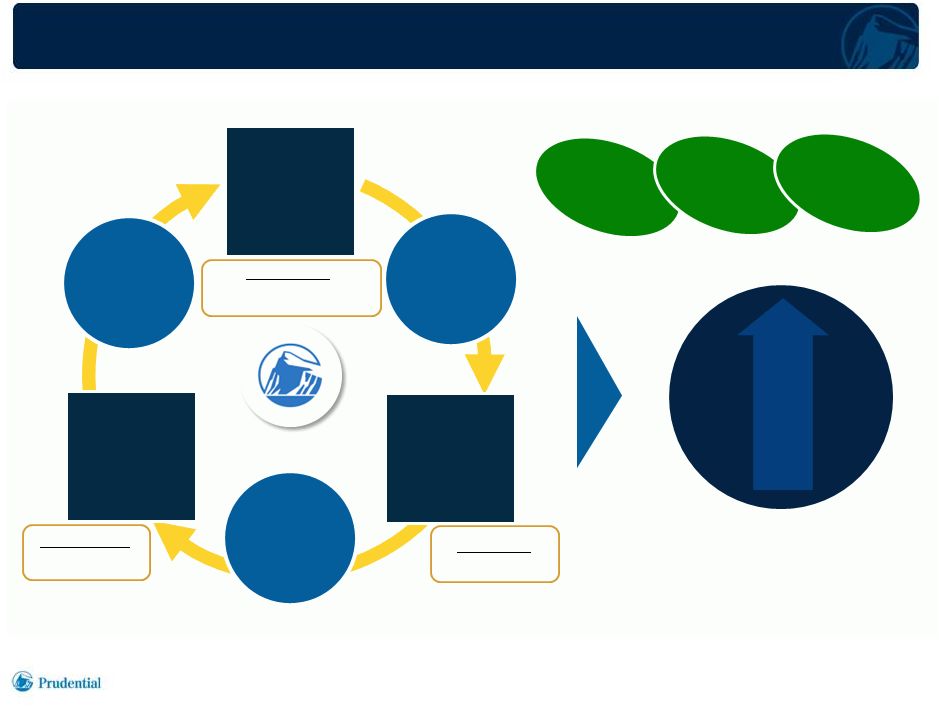 BENEFICIAL CYCLE OF LIFE PLANNER MODEL
15
Investor Day 6.4.2014
Superior
Returns &
Steady
Growth
High Income
for Life
Planner
Quality
Referrals
Productivity
$22,600 AP per LP month
7.3 policies per LP month
High Life
Planner
Retention
High Life
Planner
Productivity
High Policy
Persistency
Quality
People
Quality
Products
Quality
Service
High
Customer
Satisfaction
Retention
89.6%
(1)
Persistency
95.2%
(1)
(1)
•
Providing financial security over customers’
lifetime drives our beneficial cycle
1)
Data based on 2013 Prudential of Japan (POJ). Annualized new business premiums (AP) produced by
each Life Planner (LP) in a month; foreign denominated activity translated to U.S. dollars at
uniform exchange rate, Japanese yen 82 per U.S. dollar. Number of new policies sold per LP per month, including medical
policies. Total retention for agents in all service years. 13 month policy persistency
measured based on face amount, 12 month rolling average data for 2013. |
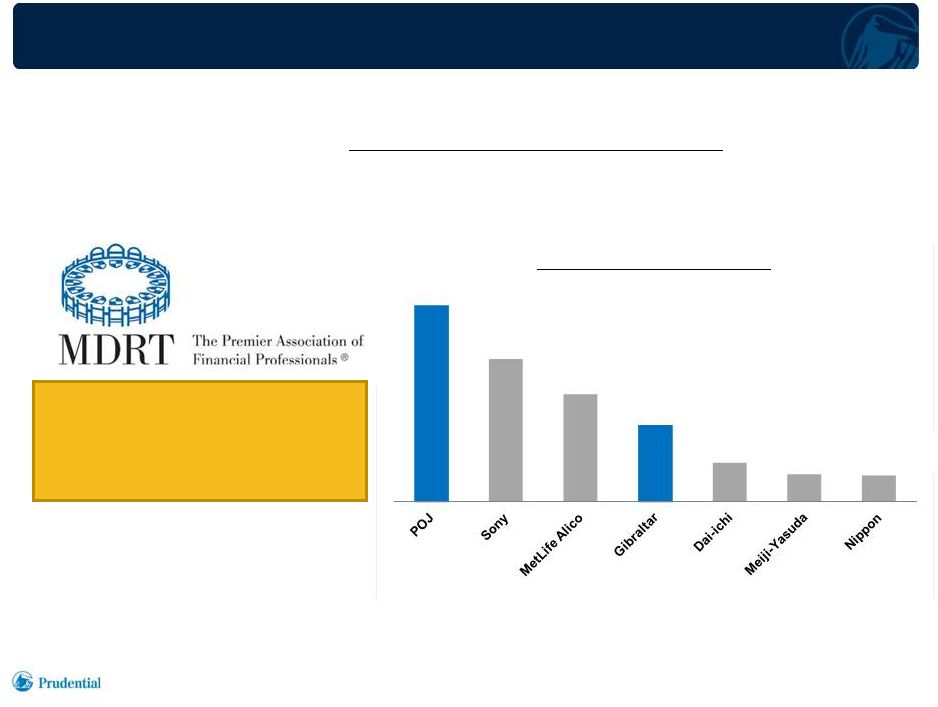 QUALITY
PEOPLE 16
Investor Day 6.4.2014
MDRT
Japan
Membership
(1)
24% of POJ Life Planners
are MDRT members
(1)
•
Industry leading Million Dollar Round Table memberships
•
Prudential
of
Japan
has
the
highest
number
of
MDRT
members
in
the
Japanese
industry for 17 consecutive years
(1)
837
607
458
326
164
117
110
1)
Source: Million Dollar Round Table Association, Japan - membership data as of 4/14/2014. |
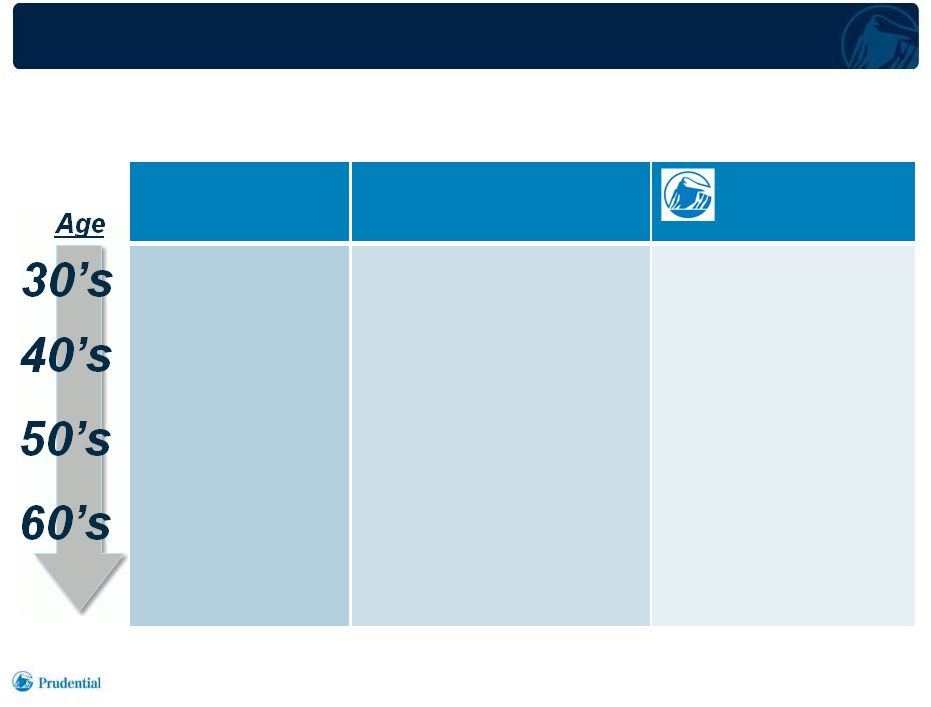 QUALITY
PRODUCTS OVER A LIFETIME 17
Investor Day 6.4.2014
•
Needs-based selling over customer’s life cycle
Note: Specific needs and solutions will vary by customer
Young household,
early professional
career
Mid career,
pre-retirement
Retirement
•
Premature death
income replacement
•
Income loss and expenses
due to accident or sickness
•
Accumulation of funds
for retirement
•
Lifetime retirement
income
•
Term insurance
•
Accident and health
policies and riders
•
Whole life insurance
•
Life insurance based
retirement income
products
Client
Life Cycle
Financial Risk
Protection Needs
Prudential
Solutions |
 QUALITY
SERVICE 18
Investor Day 6.4.2014
1)
Life
Support
Insurance
segment
of
J.D.
Power
Asia
Pacific
2011
-
2014
Japan
Life
Insurance
Contract
Customer
Satisfaction
Studies
SM
.
Contract
Customer
Satisfaction Study based on a total of 4,647 life insurance policyholders who
purchased or renewed coverage during the past year. japan.jdpower.com
2)
13 month policy persistency measured based on face amount, 12 month rolling average
data for 2013. #1
Customer
Satisfaction
(1)
POJ Policy
Persistency
(2)
95%
2011
2012
2013
#1
#1
•
According to J.D. Power Asia Pacific, Prudential of Japan is the
highest in
customer satisfaction
(1)
for four years in a row
•
Satisfied customers drive high policy persistency
#1
2014 |
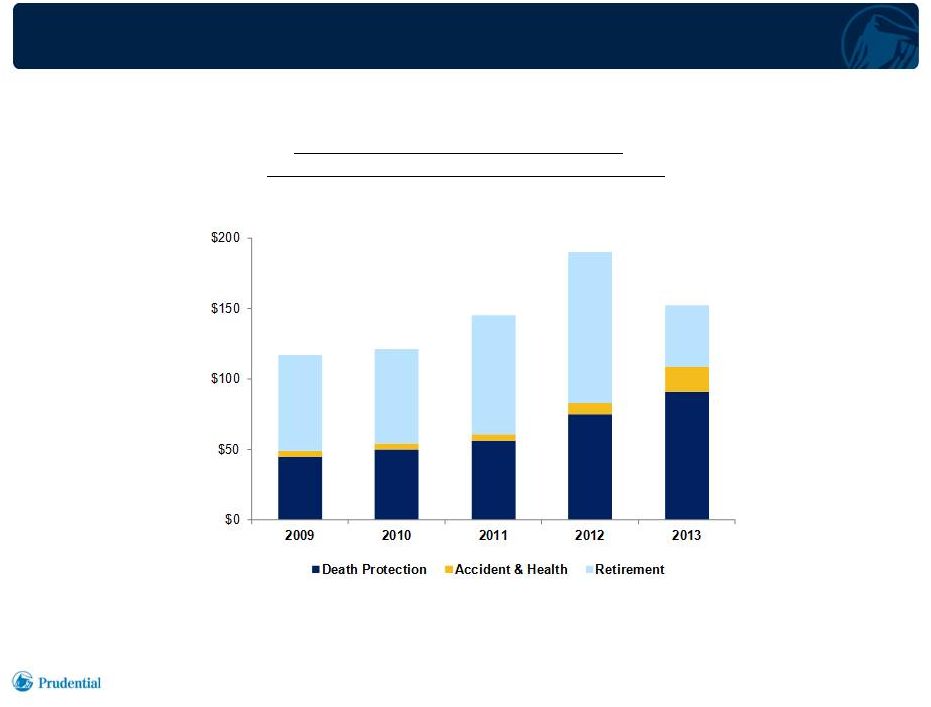 19
Investor Day 6.4.2014
LIFETIME CLIENT RELATIONSHIPS
DRIVE SUBSEQUENT SALES OPPORTUNITIES
Annualized
New
Business
Premiums
(1)
POJ
Second
Sales
to
Existing
Customers
($ millions)
117
121
145
191
152
1)
Data based on Prudential of Japan sales to individual market; foreign denominated activity translated
to U.S. dollars at uniform exchange rates; Japanese yen 82 per U.S. dollar. |
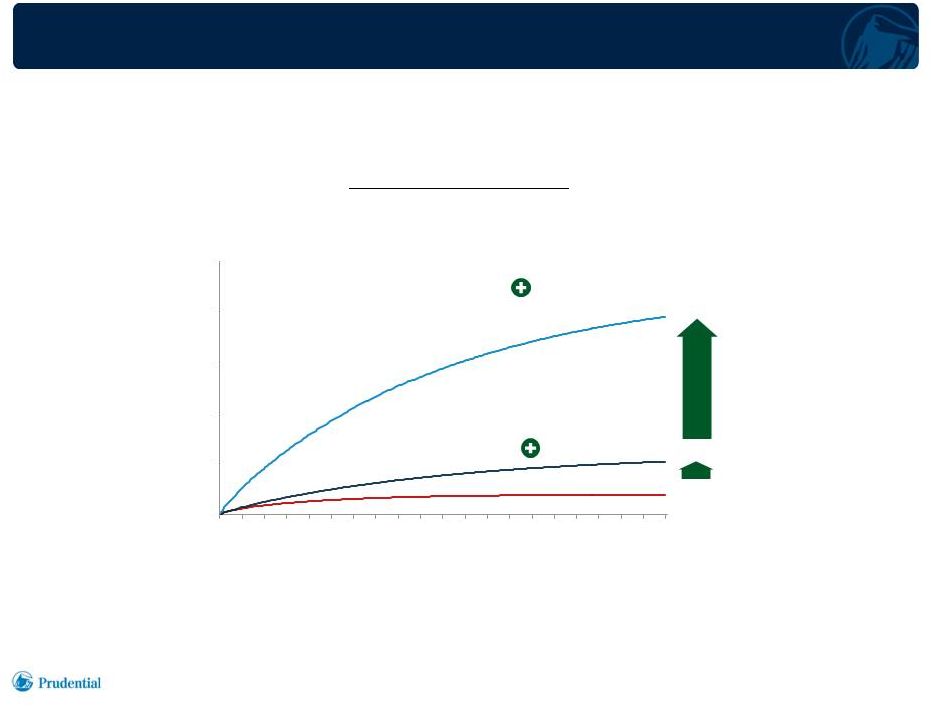 PAYOFF
FROM QUALITY 20
Investor Day 6.4.2014
•
Superior business drivers of Life Planner model significantly increase the lifetime
production of agents
Lifetime
Sales
of
Agents
(1)
Traditional Agent
1)
Sales represent annualized new business premiums. Assumptions for traditional
agent: AP Productivity = $6,000 per month; Agent Retention (Year 1/ Year 2/
Year 3+) = 55%/ 60%/ 80%; POJ Life Planner: AP Productivity = $22,600 per month; Agent Retention (Year
1/ Year 2/ Year 3+) = 83%/ 82%/ 90%.
LP Retention
LP Productivity
and Retention
0.2
0.5
1.9
0.0
0.5
1.0
1.5
2.0
2.5
0
1
2
3
4
5
6
7
8
9
10
11
12
13
14
15
16
17
18
19
20
Cumulative
Sales
($ millions )
Service Year |
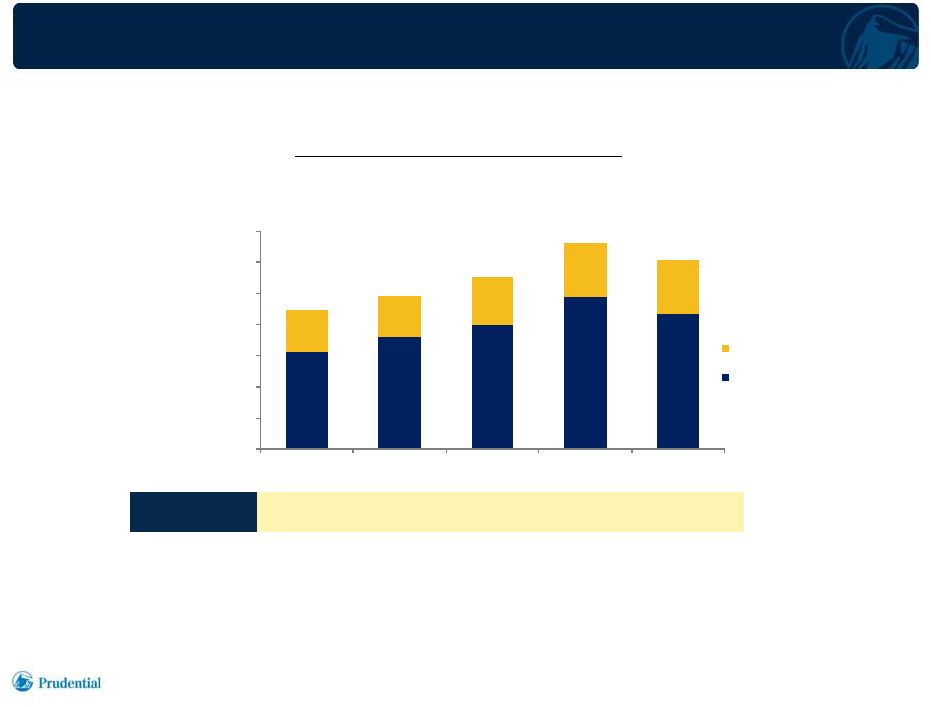 $0
$200
$400
$600
$800
$1,000
$1,200
$1,400
2009
2010
2011
2012
2013
Other Countries
Japan
21
Investor Day 6.4.2014
1)
Foreign denominated activity translated to U.S. dollars at uniform exchange rates
for all periods presented; including Japanese yen 82 per U.S. dollar, Korean
won 1,150 per U.S. dollar. 2)
As of end of period.
LIFE PLANNER OPERATIONS –
ANNUALIZED NEW BUSINESS PREMIUMS
Annualized
New
Business
Premiums
(1)
($ millions)
6,609
983
1,107
1,321
1,214
Life Planner
Count
(2)
6,565
6,792
7,058
7,248
892 |
 22
Investor Day 6.4.2014
Proven, Superior Business Model
High ROE & Low Volatility Earnings
Captive Distribution -
Life Planner
Captive Distribution -
Life Consultant
Supplemental Distribution Channels
Well-Positioned in Attractive Japanese Insurance Market
Risk Management, Capital Generation and Deployment
AGENDA |
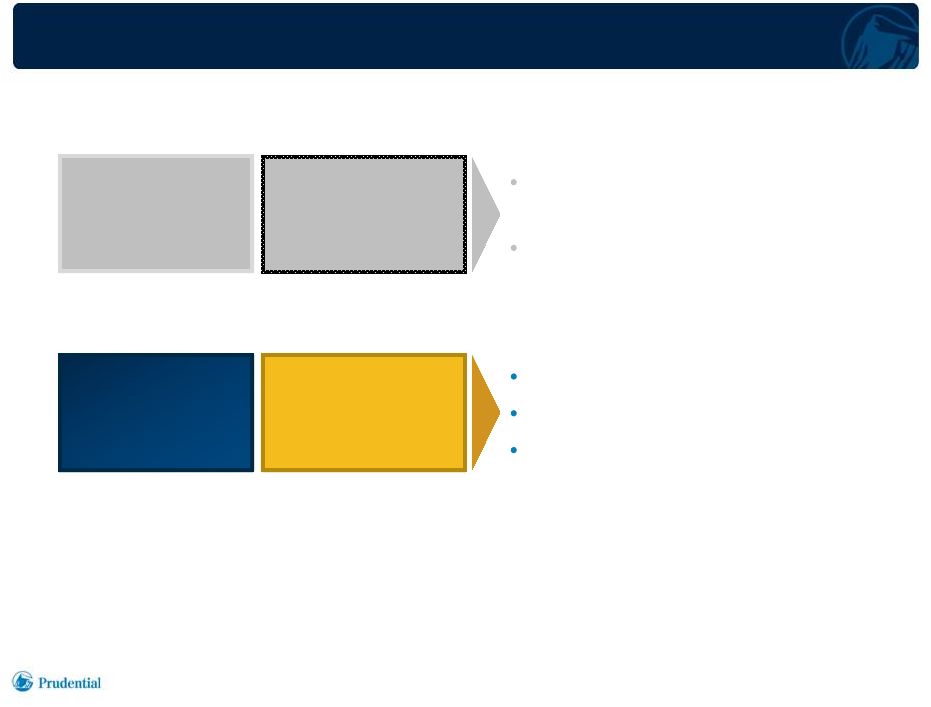   CAPTIVE
DISTRIBUTION PROVIDES SUSTAINABLE COMPETITIVE ADVANTAGE
23
Investor Day 6.4.2014
Affluent and mass affluent
consumers
Business and professional market
Mass middle-market
Affinity group relationships
Broad geographical coverage
Life Planner
Prudential of
Japan
Life Consultant
Gibraltar Life |
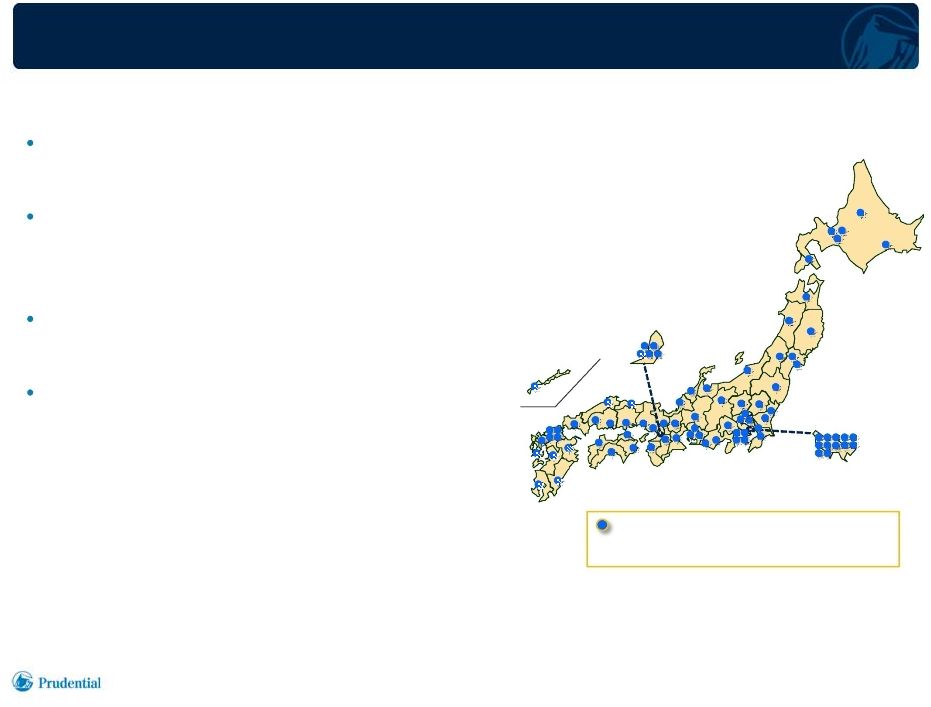 LIFE
CONSULTANT
DISTRIBUTION
-
BROAD
MARKET
COVERAGE
WITH ACCESS TO NEARLY ALL OF JAPANESE POPULATION
24
Investor Day 6.4.2014
Branch offices established in substantially
all prefectures
Prudential training supports emphasis on
death protection products and needs-based
selling
Serving expanding need for retirement
income security products
Teachers Association and other affinity
group relationships provide recurring
sources of new business
1)
As of 4/1/2014.
Tokyo area
Osaka area
83 branch offices
supporting*
Life*Consultants
(1) |
 LIFE
CONSULTANT
DISTRIBUTION
-
TEACHERS
MARKET
25
Investor Day 6.4.2014
Member eligibility:
Public school teachers
and
support employees
•
Relationship since 1952
•
Access to approximately 950,000
(1)
active teachers
and support employees of public schools through 47
prefectural (local) associations and 35,000 schools
(1)
1)
As of 5/1/2013, based on the latest annual data published.
2)
For 2013. Foreign denominated activity translated to U.S. dollars at uniform
exchange rate; Japanese yen 82 per U.S. dollar. 3)
•
Life Consultants serve teachers’
financial security needs
–
–
$216 million, 25% of Life Consultant sales
Annualized
new
business
premiums
(2)
:
–
Out
of
$216
million,
~12%
of
sales
were
from
retiring
teachers
(3)
Japanese Educational Mutual Aid
Association of Welfare Foundation
(Teachers Association)
–
–
For those teachers who retired in March 2013 and purchased our single premium products during April
– June 2013 period.
|
 TEACHERS
ASSOCIATION: PERENNIAL SALES OPPORTUNITIES
1)
As of 5/1/2013, based on the latest annual data published. Includes support
employees of public schools. 2)
As of 5/1/2014.
Active Market
Retiree Market
26
Investor Day 6.4.2014
~950,000
Active Teachers
(1)
~200,000
Retired Teachers
Association Members
(2)
~36,000
new retirees
each year
~33,000
new hires
each year |
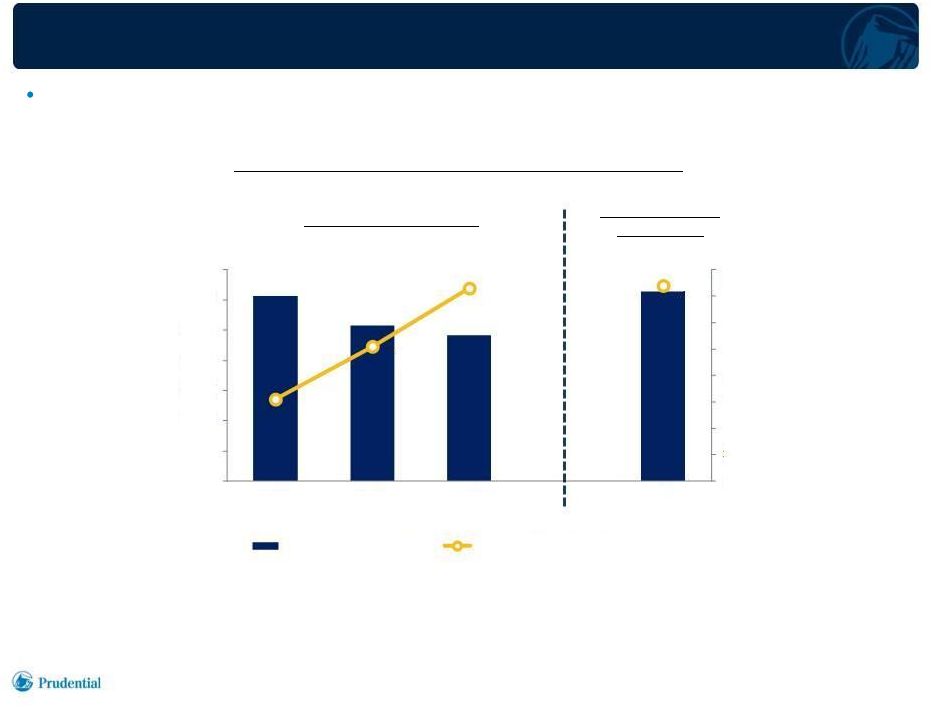 GIBRALTAR LIFE –
POST KYOEI ACQUISITION
27
Investor Day 6.4.2014
Acquired Kyoei Life in 2001 –
Life Consultant count reduced while
productivity grew
Historical
Life
Consultant
Count
&
AP
Productivity
(1)
Post-Kyoei Acquisition
Pre-Star/Edison
Acquisition
Life Consultant Count
3,100
5,100
7,300
7,400
$0
$1,000
$2,000
$3,000
$4,000
$5,000
$6,000
$7,000
$8,000
0
1,000
2,000
3,000
4,000
5,000
6,000
7,000
2001
2002
2003
2010
Life Consultant Count
Life Consultant AP Productivity
Foreign denominated activity translated to U.S. dollars at uniform exchange rates for all periods
presented; Japanese yen 82 per U.S. dollar. Annualized new business premium per Life
Consultant per month.
1) |
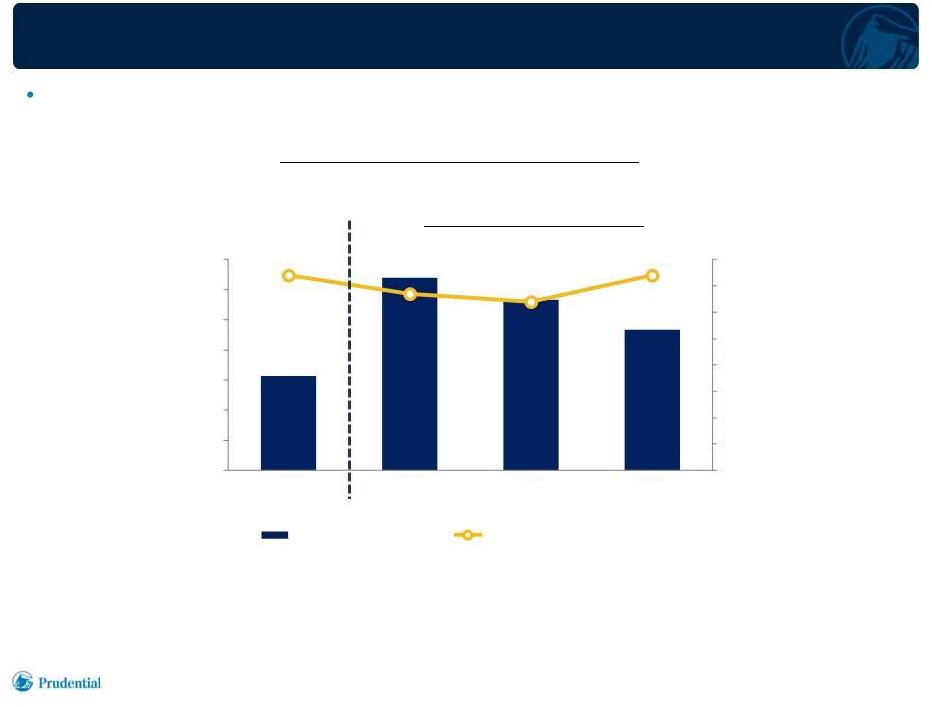 GIBRALTAR LIFE –
POST STAR/EDISON ACQUISITION
28
Investor Day 6.4.2014
Acquired Star and Edison in 2011, added 7,300 agents upon acquisition
Life
Consultant
Count
&
AP
Productivity
(1)
Post-Star/Edison Acquisition
Life Consultant Count
7,400
6,700
6,400
7,400
$0
$1,000
$2,000
$3,000
$4,000
$5,000
$6,000
$7,000
$8,000
0
2,000
4,000
6,000
8,000
10,000
12,000
14,000
2010
2011
2012
2013
Life Consultant Count
Life Consultant AP Productivity
Foreign denominated activity translated to U.S. dollars at uniform exchange rates for all periods
presented; Japanese yen 82 per U.S. dollar. Annualized new business premium per
Life Consultant per month.
1) |
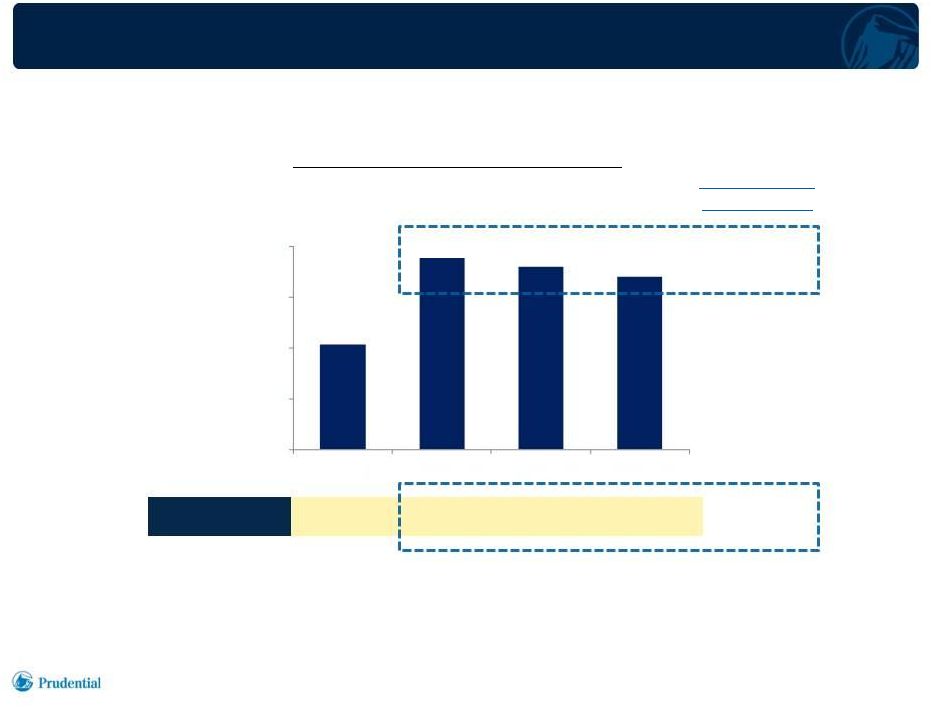 29
Investor Day 6.4.2014
1)
Foreign denominated activity translated to U.S. dollars at uniform exchange rates
for all periods presented; including Japanese yen 82 per U.S. dollar.
2)
As of end of period.
LIFE CONSULTANT DISTRIBUTION –
ANNUALIZED NEW BUSINESS PREMIUMS
Annualized
New
Business
Premiums
(1)
($ millions)
519
943
898
849
Life Consultant
Count
(2)
6,281
12,791
11,333
9,327
-10%
-27%
Change from
2011 to 2013
$0
$250
$500
$750
$1,000
2010
2011
2012
2013 |
 30
Investor Day 6.4.2014
Proven, Superior Business Model
High ROE & Low Volatility Earnings
Captive Distribution -
Life Planner
Captive Distribution -
Life Consultant
Supplemental Distribution Channels
Well-Positioned in Attractive Japanese Insurance Market
Risk Management, Capital Generation and Deployment
AGENDA |
 Sales can be volatile due to
changes in interest rates and
competitor actions
Less influence over distribution
Profitability can vary with
changes in product mix
Manage to bottom line, not
top line
Balance profitability and
business mix
BANK AND INDEPENDENT AGENCY DISTRIBUTION
BRINGS GROWTH OPPORTUNITIES AND CHALLENGES
31
Investor Day 6.4.2014
Enhances access to expanded
customer base and investable
wealth
Growth potential through
development of distribution
relationships
Competitive product portfolio
meets customer needs
Strong brand name attracts
security focused customers
Leverages infrastructure costs
Advantages
Challenges |
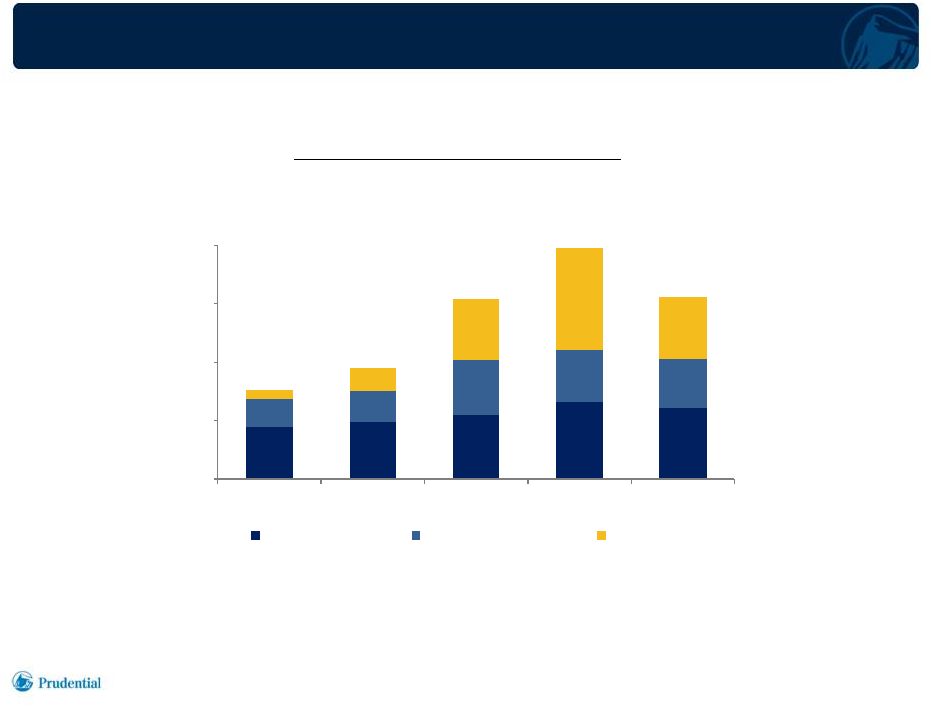 $0
$1,000
$2,000
$3,000
$4,000
2009
2010
2011
2012
2013
Life Planner
Life Consultant
Third Party
SUPPLEMENTAL DISTRIBUTION CHANNELS
EXPAND MARKET ACCESS, CONTRIBUTE OPPORTUNISTIC SALES
32
Investor Day 6.4.2014
1)
Foreign denominated activity translated to U.S. dollars at uniform exchange rates
for all periods presented, including Japanese yen 82 per U.S. dollar, Korean
won 1,150 per U.S. dollar. 2)
Represents Bank and Independent Agency distribution.
Annualized
New
Business
Premiums
(1)
($ millions)
1,519
1,898
3,083
3,956
3,118
(2) |
 33
Investor Day 6.4.2014
Proven, Superior Business Model
High ROE & Low Volatility Earnings
Captive Distribution -
Life Planner
Captive Distribution -
Life Consultant
Supplemental Distribution Channels
Well-Positioned in Attractive Japanese Insurance Market
Risk Management, Capital Generation and Deployment
AGENDA |
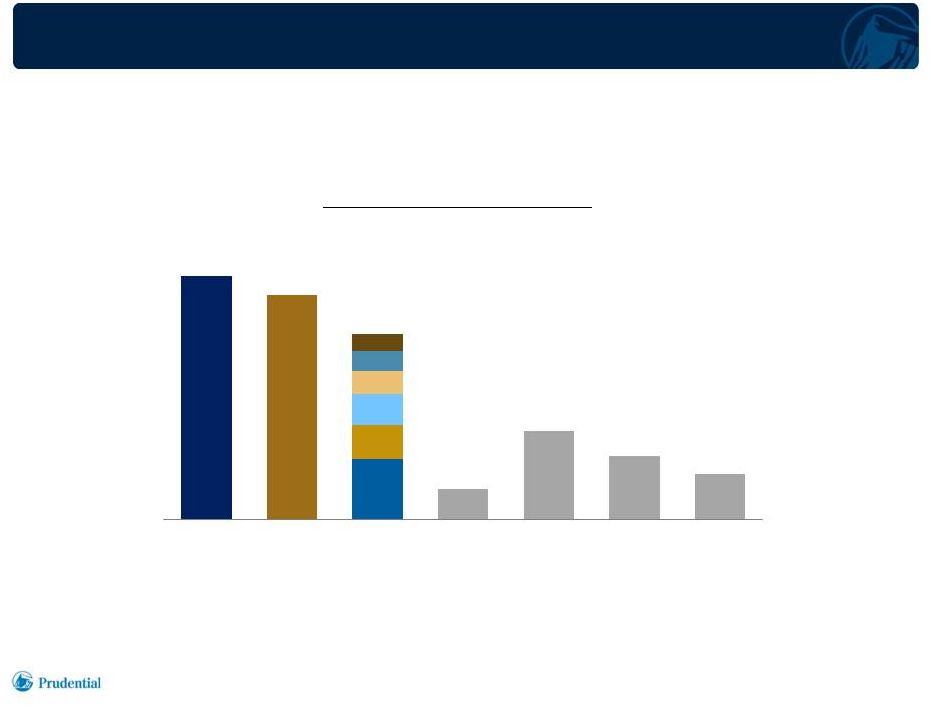 WORLD
LIFE INSURANCE MARKETS 34
Investor Day 6.4.2014
•
Japan is the second largest market in the world
•
Southeast Asia is growing fast, but the market size is still small (< 2% of
world) 2012
Life
Insurance
Premiums
(1)
($ billions)
China
Korea
Taiwan
India
SE Asia
Other
433
568
524
72
206
149
106
United States
Japan
Asia ex-
Japan
Latin
America
United
Kingdom
France
Germany
1)
Source: Swiss Re. Based on 2012 life premium volume, foreign denominated activity translated to U.S.
dollars at average exchange rates for 2012. World total life premiums are $2,621
billion. This chart is not inclusive of the remainder of Europe, Africa, Oceania and Canada.
|
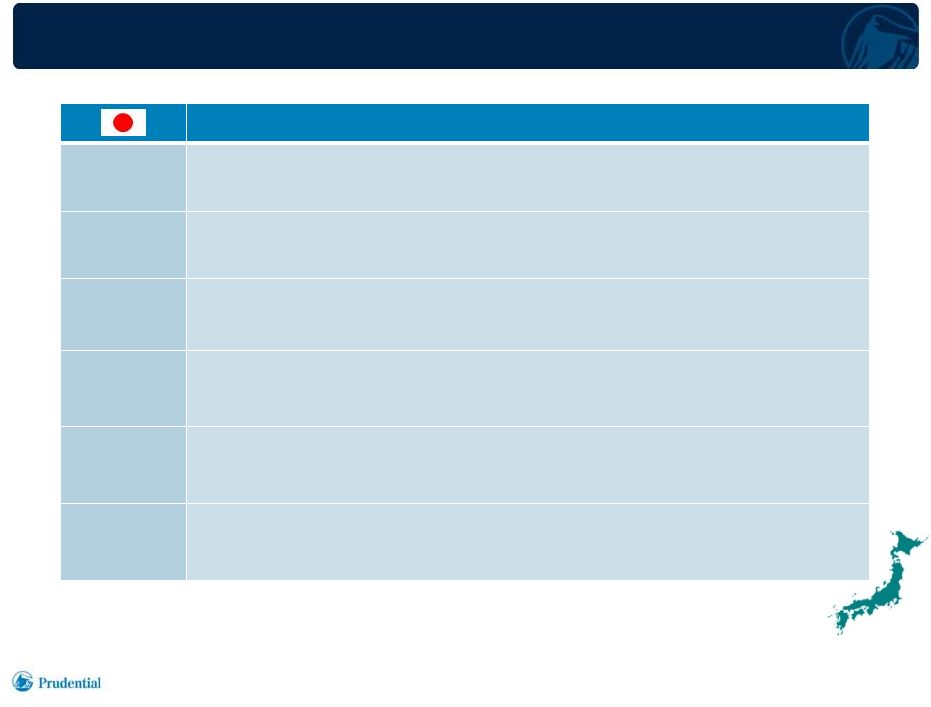 JAPAN:
SUBSTANTIAL GROWTH OPPORTUNITIES IN AN ATTRACTIVE MARKET
35
Investor Day 6.4.2014
Market Context
Market Context
Market Size
•
World’s second largest life insurance market:
Life premiums $524 billion
(1)
Household
Wealth
•
Household
sector
wealth
¥1,645
trillion
($15.6
trillion)
(2)
Investable
Asset Pool
•
¥874 trillion ($8.3 trillion) household pool of currency and deposits is
among the world’s largest
(2)
Retirement
Market
•
Expanding retirement market driven by aging population, increased
emphasis on individual responsibility for financial security
Product
Trend
•
Customers prefer insurance products to equities for savings
and investments
Distribution
Trend
•
Growing distribution opportunities include banks and independent
distributors
1)
2)
Based
on
12/31/2013
data;
Sources:
Bank
of
Japan,
Oanda.
Yen
to
the
U.S.
dollar
translation
at
the
spot
currency
FX
rate
as
of
12/31/2013.
Source: Swiss Re - World Insurance in 2012, based on 2012 life insurance premiums. |
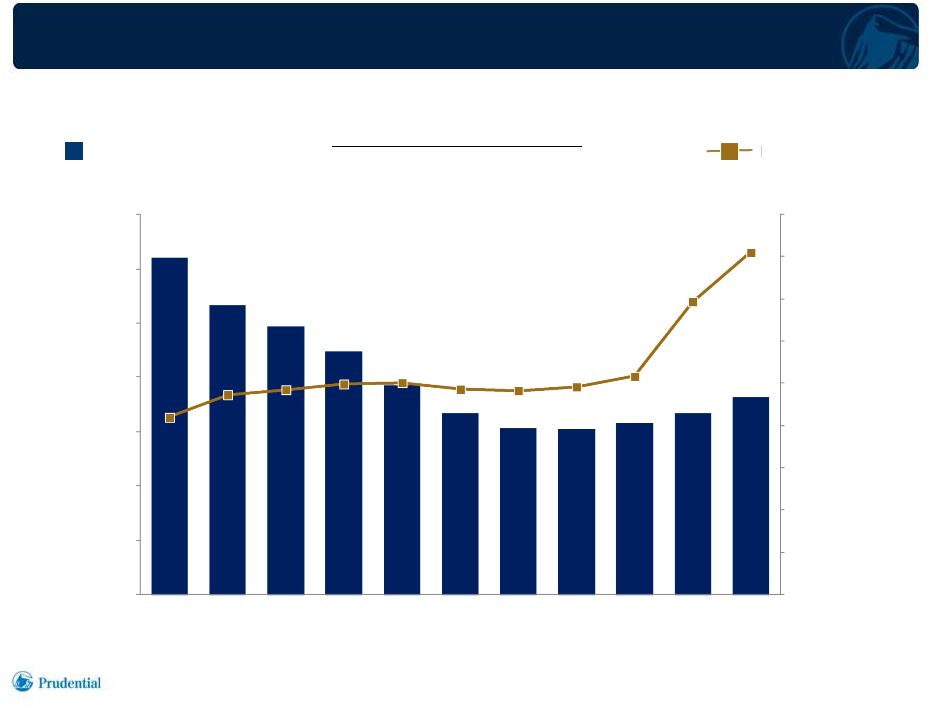 New
Business
Face
Amount
(1)
PRUDENTIAL’S GROWTH IN JAPAN
CONTRASTS TO INDUSTRY TREND
(¥
trillions)
Industry
36
Investor Day 6.4.2014
1)
Source: The Life Insurance Association of Japan. Fiscal year starting April
1. Industry data excludes Japan Post Insurance; includes policy conversions.
(¥
billions)
124
107
99
89
67
61
61
63
67
73
4,197
4,732
4,848
5,018
4,861
4,826
4,917
5,170
6,935
8,099
-
1,000
2,000
3,000
4,000
5,000
6,000
7,000
8,000
9,000
-
20
40
60
80
100
120
140
2002
2003
2004
2005
2006
2007
2008
2009
2010
2011
2012
77
Prudential Japanese
Insurance Operations
4,984 |
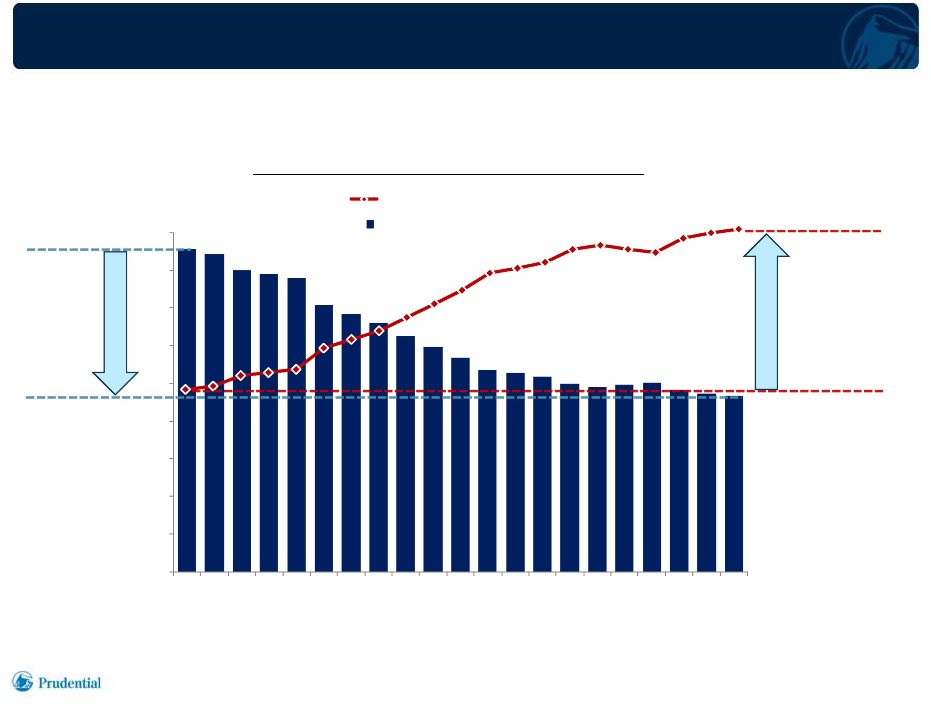 JAPAN
INDUSTRY – NUMBER OF CAPTIVE AGENTS
37
Investor Day 6.4.2014
1)
Source: Japan Institute of Life Insurance. Data as of fiscal year end March
31. Some former captive agents continue their career in life insurance industry as
independent sales agents.
•
Fewer captive agents to meet customer needs
Captive agents
(thousands)
Population
per agent
increased
88%
Industry
agent
count
declined
45%
-
50
100
150
200
250
300
350
400
450
1992
1994
1996
1998
2000
2002
2004
2006
2008
2010
2012
Number of captive agents
291
546
-
200
300
400
Population per captive agent
Number
of
Life
Insurance
Captive
Agents
(1) |
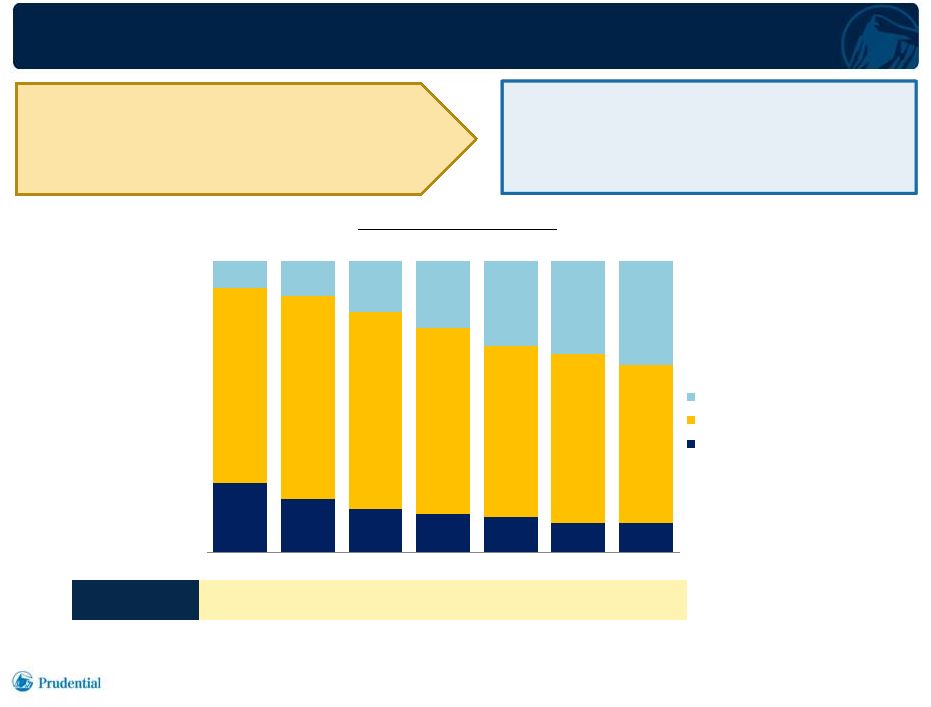 1980
1990
2000
2010
2020
2030
2040
65 and over
15-64 years old
0-14 years old
Japan
Demographics
(1)
JAPAN DEMOGRAPHIC CHANGE –
CUSTOMERS’
CHANGE OF NEEDS BY DEMOGRAPHIC SHIFT
38
Investor Day 6.4.2014
1)
Source: Japan Statistics Bureau, as of January, 2012.
67%
9%
24%
19%
15%
12%
10%
10%
12%
69%
23%
29%
32%
36%
68%
59%
58%
54%
•
Retirement income needs
•
Healthcare needs
•
Inheritance needs
13%
64%
17%
118
Population
(in millions)
124
127
128
124
117
107
We have experienced agents
who can help customers meet
their evolving needs |
 LEADING
POSITION IN ATTRACTIVE MARKET 39
Investor Day 6.4.2014
•
New business face amount
•
Annualized new business premiums
•
In force face amount
•
Premium
income
(2)
•
Total assets
Ranking Category
Rank
(1)
Prudential is a leading life insurer in Japan
10.1%
7.8%
7.4%
6.9%
5.3%
#3
#5
#5
#5
#6
Market
Share
(1)
1)
Source: Company data published in individual company websites. Industry / market share data
excludes Japan Post Insurance. Nine months ended 12/31/2013. 2)
Prudential’s premium income amount was adjusted down for internal reinsurance transactions.
|
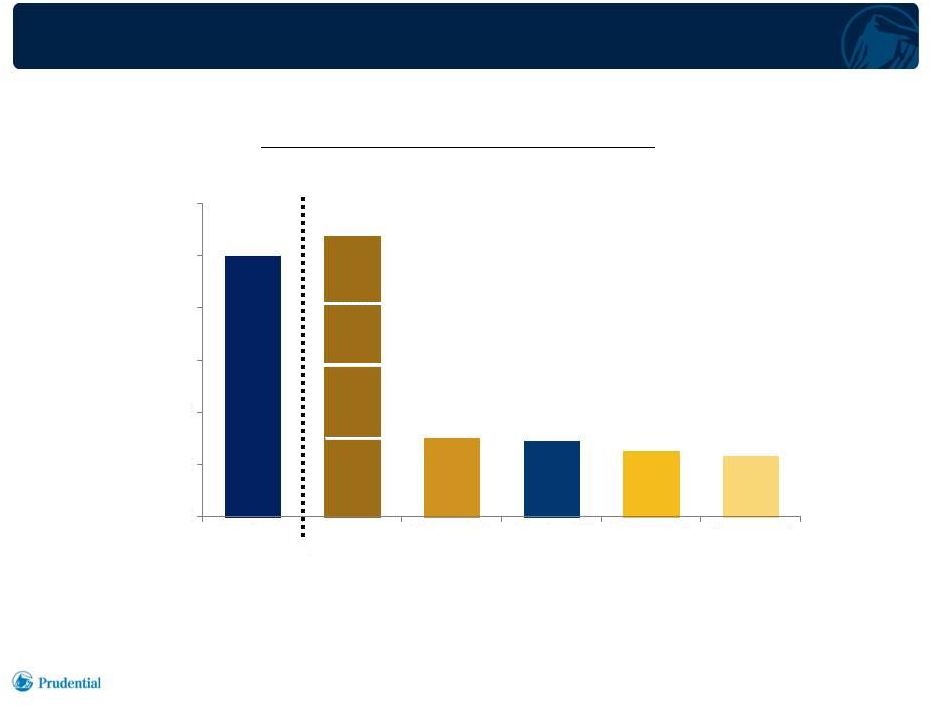 PRUDENTIAL SALES IN JAPAN VS.
U.S. LIFE INSURERS SALES IN U.S.
40
Investor Day 6.4.2014
1)
U.S. individual insurance sales (annualized premium with 10% excess premium) based
on LIMRA; Prudential Japan foreign currency denominated activity translated
to U.S. dollars at uniform exchange rates; Japanese yen 82 per U.S. dollar. Annuities excluded.
2)
The combined Top 4 U.S. companies include Northwestern Mutual, Prudential (U.S.),
New York Life and Lincoln National. 2013
Annualized
New
Business
Premiums
(1)
($ millions)
(2)
$0
$500
$1,000
$1,500
$2,000
$2,500
$3,000
Pru Japan
Top 4 U.S.
Companies
Company 1
Prudential
(U.S.)
Company 3
Company 4 |
 PURSUING
OPPORTUNITIES IN LIMITED NUMBER OF ATTRACTIVE COUNTRIES OUTSIDE JAPAN
41
Investor Day 6.4.2014
•
Well established operation in Korea
–
Annualized new business premiums, $167 million
(1)
–
Approximately 1,800 Life Planners
(2)
–
Adjusted operating income, $251 million
(1)
•
Cultivating Life Planner operation in Brazil
–
Annualized new business premiums, $83 million
(1)
–
Approximately 850 Life Planners
(2)
•
Joint Ventures: Footholds of future potential opportunities
–
India, China, Malaysia
1)
For the year ended 12/31/2013.
2)
As of 3/31/2014. |
 42
Investor Day 6.4.2014
Proven, Superior Business Model
High ROE & Low Volatility Earnings
Captive Distribution -
Life Planner
Captive Distribution -
Life Consultant
Supplemental Distribution Channels
Well-Positioned in Attractive Japanese Insurance Market
Risk Management, Capital Generation and Deployment
AGENDA |
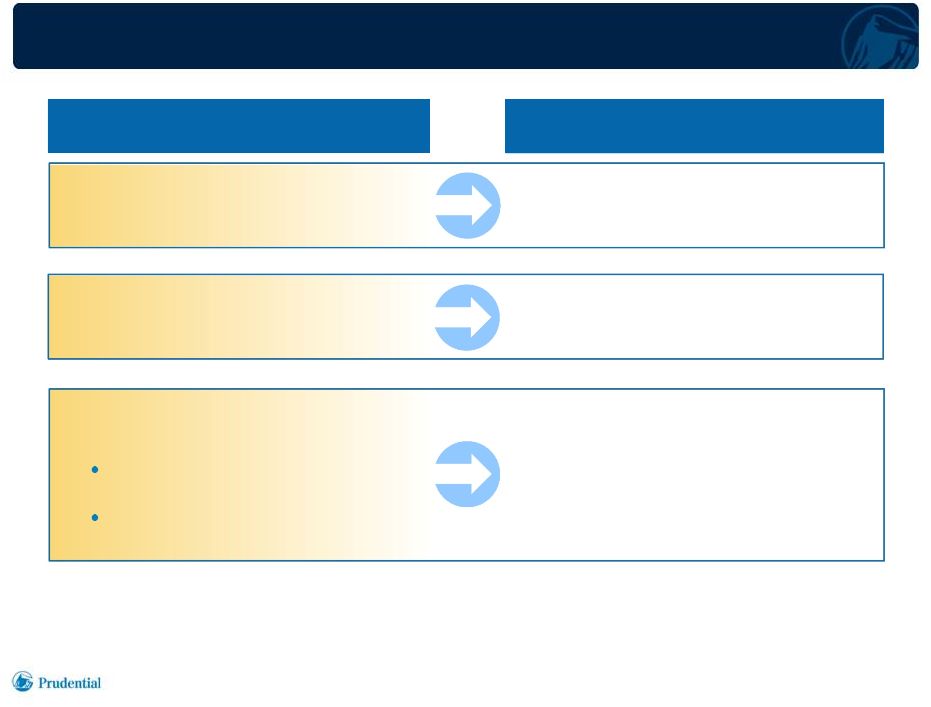 FOREIGN
CURRENCY RISK MANAGEMENT 43
Investor Day 6.4.2014
Potential Exposure
Risk Management
Asset-Liability
Management
Well Matched FX
Shareholder Value in US$
Comprehensive
Hedging Program
Income and Cash Flow
Equity Value
Accounting
Remeasurement
Non-Economic Noise |
 JAPANESE
YEN INCOME HEDGE 44
Investor Day 6.4.2014
1)
For 2013.
2)
Percentage of expected yen-based AOI hedged as of 3/31/2014.
•
Roughly 50% of Japan’s AOI is Yen-based
(1)
•
Yen-based AOI is hedged over a 36 month rolling period using a series of FX
forwards with laddered maturities
•
The Yen plan rate is derived from the weighted average hedged rate
•
Hedging Yen-based AOI protects the USD value of Japan capital
repatriation Income Hedges
2014
2015
2016
2017
%
of
Yen
AOI
Hedged
(2)
100%
88%
37%
3%
Plan Rates (¥/$)
¥82 |
 INTEREST
RATE ENVIRONMENT Protection products provide stable
earnings from mortality and
expense margins
Fixed annuity products designed to
mitigate interest rate risk
–
Pricing updates bi-weekly
–
Early surrenders subject to market
value adjustments (MVA)
45
Investor Day 6.4.2014
0%
1%
2%
3%
4%
5%
6%
7%
8%
1997
1999
2001
2003
2005
2007
2009
2011
2013
JGB
UST
Interest rates have been low in Japan for more than fifteen years
–
Majority of POJ’s in force business was written in a low rate
environment –
Rehabilitation measures lowered crediting rates of legacy business of
Gibraltar High-quality long duration investment portfolio
Repriced products to maintain profitability
10-Year Government Bond Yield |
 SOLVENCY
MARGIN RATIO 46
Investor Day 6.4.2014
•
Solvency
margin
position
of
Prudential’s
Japanese
companies
–
well
capitalized
and financially secure
Stressed Scenario
~680%
Down 55%
Down 35%
Strengthening 20%
Up 100 bps
Stressed
Scenario
(2)
March 31, 2014
777%
Prudential of Japan
Gibraltar Life
(1)
955%
SMR
1)
Gibraltar Life consolidated basis.
2) Represents indicated change applied to asset valuation as of
3/31/14. ~800%
•
Japan Equity
•
Real Estate
•
USD & AUD Exchange Rates
•
Interest Rates |
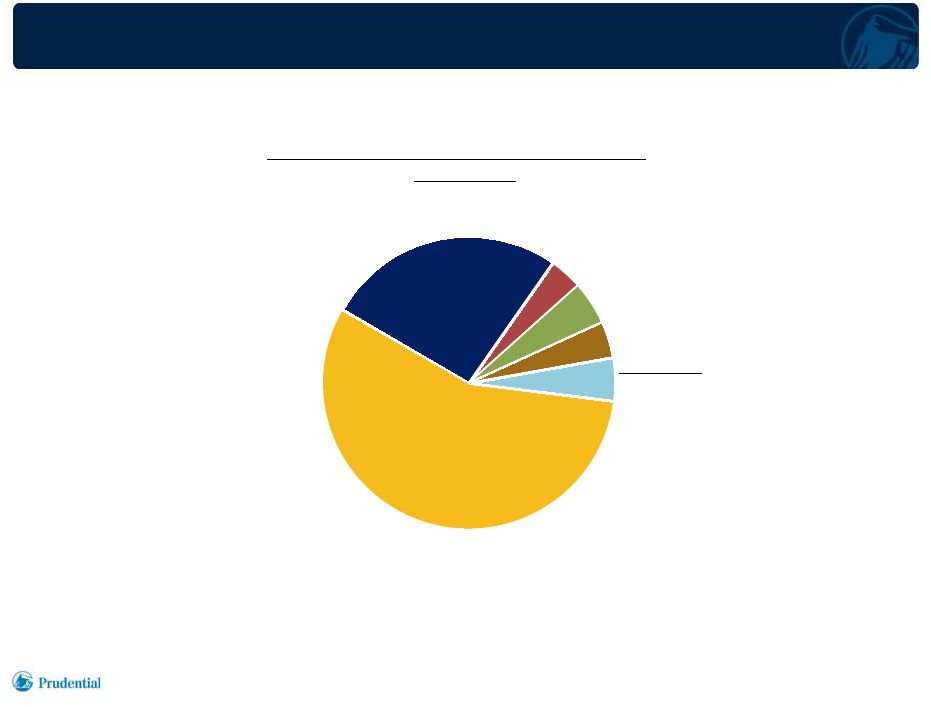 HIGH
QUALITY INVESTMENT PORTFOLIO 47
Investor Day 6.4.2014
1)
As of 3/31/2014, at balance sheet carrying amount.
2)
Includes commercial/residential mortgage-backed securities and asset-backed
securities. 3)
Includes commercial/residential mortgage loans.
4)
Includes trading account assets supporting insurance liabilities, policy loans,
other trading account assets and short-term investments. Japanese
Insurance
Operations
Portfolio
(1)
$143 billion
Corporate Bonds
(Investment Grade)
2% Corporate Bonds (Below Investment Grade)
2% Equities
1% Other Long Term Investments
Structured
Securities
(2)
Commercial
Loans
(3)
Risk Assets
Other
(4)
Government
(JGB & UST)
26%
4%
5%
4%
5%
56% |
 HISTORICAL CAPITAL REDEPLOYMENT
48
Investor Day 6.4.2014
Historical
Capital
Redeployment
($ billions)
•
International Insurance operations have redeployed excess capital of more than
60% of after-tax AOI since 2009
1)
Years 2009 –
2011 have been restated for U.S. GAAP accounting standards applicable to deferred
policy acquisition costs (DAC) effective 1/1/2012. After-tax AOI
is based on overall FSB effective tax rates. Forms
of
Cumulative
Redeployment
Over 60%
of after-tax
AOI
$1.2
$1.4
$1.7
$2.0
$2.3
$0.7
$0.4
$1.6
$1.3
$1.5
2009
2010
2011
2012
2013
Capital Redeployed
$8.6
$5.5
Cumulative 2009 -
2013
Dividends
16%
Debt
Repayment
21%
Affiliate
Lending
18%
Acquisition
Funding
and Other
45%
After-tax
AOl
(1) |
 KEY
TAKEAWAYS 49
Investor Day 6.4.2014
Proven, superior business model
High ROE & low volatility earnings primarily driven by stable mortality
and expense margins
Captive distribution provides sustainable competitive advantage
Well-positioned in attractive Japanese insurance market
Solid risk management
Sustained capital generation and deployment |