EX-99.1
Published on
 PRUDENTIAL
FINANCIAL,
INC. 2015
FINANCIAL
STRENGTH
SYMPOSIUM
JUNE
23, 2015 Exhibit 99.1 |
 PRUDENTIAL
FINANCIAL,
INC. 2015
FINANCIAL
STRENGTH
SYMPOSIUM
MARK
FINKELSTEIN
SENIOR
VICE
PRESIDENT
INVESTOR
RELATIONS |
 FORWARD-LOOKING STATEMENTS AND NON-GAAP MEASURE
3 Financial Strength Symposium 6.23.2015 Certain of the statements included in this presentation constitute forward-looking statements within the meaning of the U. S. Private
Securities Litigation Reform Act of 1995. Words such as
“expects,” “believes,” “anticipates,” “includes,” “plans,” “assumes,” “estimates,” “projects,” “intends,” “should,” “will,” “shall,” or variations of such words are generally part of forward-looking statements. Forward-looking statements are made based on management’s current expectations and beliefs concerning future developments and
their potential effects upon Prudential Financial, Inc. and its
subsidiaries. There can be no assurance that future developments
affecting Prudential Financial, Inc. and its subsidiaries will be those anticipated by
management. These forward-looking statements are not a guarantee of
future performance and involve risks and uncertainties. Certain important factors that could cause actual results to differ, possibly materially, from expectations or estimates reflected in such forward-looking statements can be found in the “Risk Factors” section included in Prudential Financial, Inc.’s Annual Report on Form 10-K for the year ended December 31,
2014. Prudential Financial, Inc. does not intend, and is under no
obligation, to update any particular forward-looking statement included in this presentation. This presentation also includes references to “adjusted operating income” and return on equity, which is based on adjusted operating
income. Adjusted operating income is a measure of performance that
is not calculated based on accounting principles generally accepted in
the United States of America (GAAP). For additional information about adjusted operating income and the comparable GAAP measure, including a reconciliation between the two, please refer to our Annual Reports on Form 10-K and
Quarterly Reports on Form 10-Q, which are available on our Web site at www.investor.prudential.com.
A reconciliation is also included as part of this presentation. _______________________________________________________________________________
Prudential Financial, Inc. of the United States is not affiliated with Prudential PLC
which is headquartered in the United Kingdom. |
 RECONCILIATIONS BETWEEN
ADJUSTED OPERATING INCOME AND THE COMPARABLE GAAP MEASURE (1) 4 Financial Strength Symposium 6.23.2015 1) Represents results of former Financial Services Businesses. 2) As originally reported. 3) Reflects restatement for the Company's retrospective adoption in 2012 of amended accounting guidance for deferred policy acquisition costs and a
discretionary change in accounting principle related to the Company's
pension plans. Does not reflect restatement for the Company's retrospective adoption in 2013 of a discretionary changein accounting principle for recognition of performance based incentive fee revenue.
4) 2002 includes certain costs related to former sales practices. ($ millions) 2002 (2) 2007 (3) 2009 2013 2014 Pre-tax adjusted operating income 1,780 $ 3,916 $ 2,997 $ 6,369 $ 5,892 $ Income taxes, applicable to adjusted operating income 598 1,066 736 1,783 1,537 After-tax adjusted operating income 1,182 2,850 2,261 4,586 4,355 Reconciling items: Realized investment losses, net, and related charges and adjustments (859) (88) (1,669) (8,149) (4,130) Investment gains (losses) on trading account assets supporting insurance liabilities, net
- - 1,601 (250) 339 Change in experience-rated contractholder liabilities due to asset value changes
- 13 (899) 227 (294) Divested businesses (4) (100) 339 2,101 29 167 Equity in earnings of operating joint ventures and earnings attributable to noncontrolling interests - (354) (2,387) 28 44 Total reconciling items, before income taxes (959) (90) (1,253) (8,115) (3,874) Income taxes, not applicable to adjusted operating income (518) (99) (663) (2,857) (1,082) Total reconciling items, after income taxes (441) 9 (590) (5,258) (2,792) Income (loss) from continuing operations (after-tax) before equity in earnings
of operating joint ventures
741 2,859 1,671 (672) 1,563 Equity in earnings of operating joint ventures, net of taxes and earnings attributable to
noncontrolling interests
- 179 1,580 (48) (41) Income (loss) from continuing operations attributable to Prudential Financial, Inc.
741 3,038 3,251 (720) 1,522 Earnings attributable to noncontrolling interests - 67 (57) 107 57 Income (loss) from continuing operations (after-tax) 741 3,105 3,194 (613) 1,579 Income (loss) from discontinued operations, net of taxes (62) 217 (19) 7 11 Net income (loss) 679 3,322 3,175 (606) 1,590 Less: Income attributable to noncontrolling interests - 67 (57) 107 57 Net income (loss) attributable to Prudential Financial, Inc. 679 $ 3,255 $ 3,232 $ (713) $ 1,533 $ |
 5 Financial Strength Symposium 6.23.2015 RECONCILIATION FOR PRE -TAX ADJUSTED OPERATING INCOME EXCLUDING MARKET DRIVEN AND DISCRETE ITEMS (1) 1) Adjusted Operating Income (AOI) excluding market driven and discrete items as disclosed in company earnings conference call presentations and
earnings releases
available at www.investor.prudential.com.
2) Includes adjustments to reflect updated estimates of profitability based on market performance in relation to our assumptions, as well as annual
reviews of actuarial assumptions and refinements of reserves and
amortization of deferred policy acquisition and other costs. ($
millions) 2002
2007 2013 2014 Pre-tax adjusted operating income 1,780 $ 3,916 $ 6,369 $ 5,892 $ Reconciling items: Unlockings and experience true-ups (2) - 130 574 (420) Gains on sales of business/investments - 51 66 - Integration costs - - (79) (32) Write off of bond issue costs - - (27) - Other - (5) - - Sub-total - 176 534 (452) Pre-tax adjusted operating income excluding market driven and discrete items 1,780 $ 3,740 $ 5,835 $ 6,344 $ |
 RECONCILIATION FOR
INTERNATIONAL
INSURANCE
PRE -TAX ADJUSTED OPERATING INCOME EXCLUDING MARKET DRIVEN AND DISCRETE ITEMS (1) 6 Financial Strength Symposium 6.23.2015 1) AOI excluding market driven and discrete items as disclosed in company earnings conference call presentations and earnings releases available at
www.investor.prudential.com. 2) Includes refinements of reserves and amortization of deferred policy acquisition and other costs.
($ millions) 2009 2010 2011 2012 2013 2014 International Insurance pre-tax adjusted operating income 1,651 $ 1,887 $ 2,263 $ 2,704 $ 3,152 $ 3,252 $ Reconciling items: Annual review of actuarial assumptions and reserve refinements (2) 14 - - 20 (190) (95) Gains on sales of investment - 66 237 60 66 - Impact of earthquake in Japan - - (69) - - - Integration costs for Star/Edison - - (213) (138) (28) - Other 15 - - - - - Sub-total 29 66 (45) (58) (152) (95) International Insurance pre-tax adjusted operating income excluding market driven and discrete items 1,622 $ 1,821 $ 2,308 $ 2,762 $ 3,304 $ 3,347 $ |
 RECONCILIATION FOR
U.S. BUSINESSES
PRE -TAX ADJUSTED OPERATING INCOME EXCLUDING MARKET DRIVEN AND DISCRETE ITEMS (1) 7 Financial Strength Symposium 6.23.2015 1) AOI excluding market driven and discrete items as disclosed in company earnings conference call presentations and earnings releases available at
www.investor.prudential.com. 2) Includes adjustments to reflect updated estimates of profitability based on market performance in relation to our assumptions, as well as annual
reviews of actuarial assumptions and refinements of reserves and
amortization of deferred policy acquisition and other costs.
3) Includes gain on sale of investment in Afore XXI, as well as an impairment and gains on certain other investments.
($ millions) 2010 2011 2012 2013 2014 U.S. Businesses pre-tax adjusted operating income 2,694 $ 2,789 $ 2,661 $ 4,587 $ 3,988 $ Reconciling items: Unlockings and experience true-ups (2) 384 (202) 48 764 (306) Gains on sales of business/investments (3) - 157 (34) - - Integration costs for Hartford Life - - (15) (51) (32) Other - - 11 - - Sub-total 384 (45) 10 713 (338) U.S. Businesses pre-tax adjusted operating income excluding market driven and discrete items 2,310 $ 2,834 $ 2,651 $ 3,874 $ 4,326 $ |
 RECONCILIATION FOR
SELECTED
BUSINESSES
PRE -TAX ADJUSTED OPERATING INCOME EXCLUDING MARKET DRIVEN AND DISCRETE ITEMS (1) 8 Financial Strength Symposium 6.23.2015 1) AOI excluding market driven and discrete items as disclosed in company earnings conference call presentations and earnings releases available at
www.investor.prudential.com. 2) Includes adjustments to reflect updated estimates of profitability based on market performance in relation to our assumptions, as well as annual
reviews of actuarial assumptions and refinements of reserves and
amortization of deferred policy acquisition and other costs. ($
millions) Individual Life &
Group Insurance Retirement Individual Annuities & Asset Management Individual Life & Group Insurance Retirement Individual Annuities & Asset Management Pre-tax adjusted operating income 656 $
565 $
1,473 $ 521 $
1,215 $
2,252 $
Reconciling items: Unlockings and experience true-ups (2) 38 (15) 361 (179) 2 (129) Integration costs for Hartford Life - - - (32) - - Sub-total 38 (15) 361 (211) 2 (129) Pre-tax adjusted operating income excluding market driven and discrete items 618 $
580 $
1,112 $ 732 $
1,213 $
2,381 $
2010 2014 |
 RECONCILIATION FOR
EARNINGS PER SHARE EXCLUDING MARKET DRIVEN AND DISCRETE ITEMS (1) 9 Financial Strength Symposium 6.23.2015 1) As disclosed in company earnings conference call presentations and earnings releases available at www.investor.prudential.com.
2) Includes adjustments to reflect updated estimates of profitability based on market performance in relation to our assumptions, as well as annual
reviews of actuarial assumptions and refinements of reserves and
amortization of deferred policy acquisition and other costs. Adjusted
Operating Income basis: 2010
2014 Earnings Per Share 5.64 $ 9.21 $ Reconciling items: Unlockings and experience true-ups (2) 0.52 (0.59) Gains on sales of businesses/investments 0.09 - Integration costs for Hartford Life - (0.04) Sub-total 0.61 (0.63) Earnings Per Share - excluding market driven and discrete items 5.03 $ 9.84 $ |
 PRUDENTIAL
FINANCIAL,
INC. 2015
FINANCIAL
STRENGTH
SYMPOSIUM
ROBERT
FALZON
EXECUTIVE
VICE
PRESIDENT
CHIEF
FINANCIAL
OFFICER |
   EXECUTING ON
OUR
STRATEGY
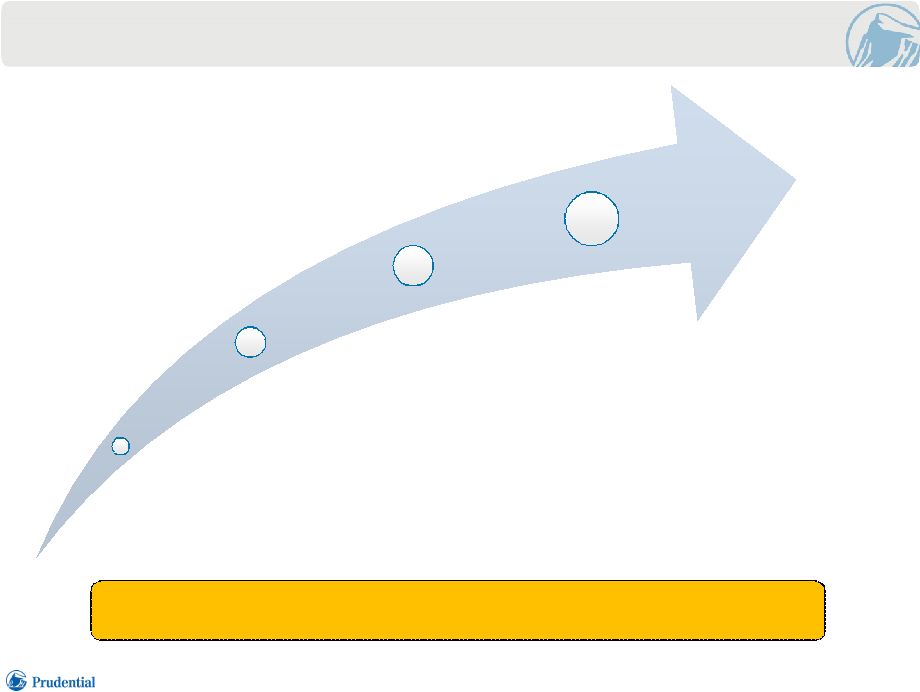
1999-2004: Repositioned Company 2005-2007: Enhanced Business Performance 2008-2009: Navigated Crisis 2010-2014: Capitalized on Market Dislocation 2 Prudential has successfully navigated change. We are stronger than ever before and well positioned to thrive in the face of evolving competitive, market and regulatory dynamics. Financial Strength Symposium 6.23.2015 Fortify Leadership Position |
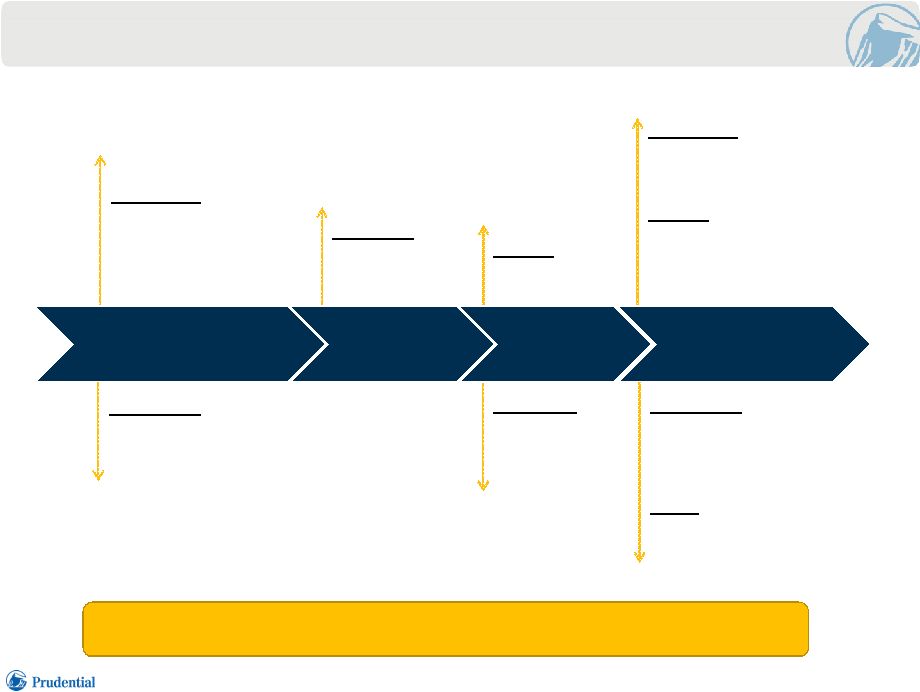 Disposition: • Sale of JV Interest in Wells Fargo EVOLUTION OF OUR BUSINESS 3 Acquisitions: • Kyoei Life (now Gibraltar) • American Skandia Variable Annuities • CIGNA Retirement Dispositions: • Healthcare • Property and Casualty Acquisition: • Allstate Variable Annuities Dispositions: • Global Commodities • Prudential Real Estate and Relocation • Prudential Bank and Trust • Wealth Management Solutions Exited: • Long Term Care Acquisitions: • Star / Edison • Hartford Individual Life • Uni.Asia Life (Joint Venture) Entered: • China Insurance Market with Fosun • Large case PRT Market with GM and Verizon Entered: • India Insurance Market Financial Strength Symposium 6.23.2015 Disciplined execution has included redeployment of resources into growing our core businesses and out of non-strategic businesses. 1999-2004 2005-2007 2008-2009 2010-2014 |
 ATTRACTIVE
MIX
OF BUSINESSES AND RISKS 4 Financial Strength Symposium 6.23.2015 1) Adjusted operating income (AOI) excluding market driven and discrete items as shown in disclosure section; exhibit excludes Corporate & Other
Operations pre-tax loss of $1.3 billion.
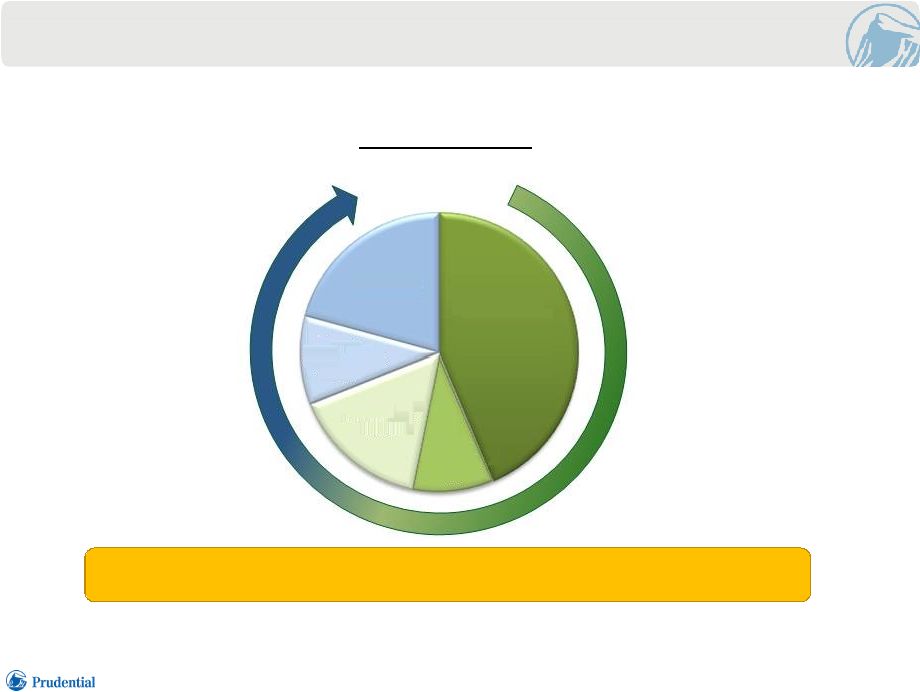
2) Includes U.S. Individual Life and Group Insurance. Insurance Risk Market Risk (2) Focus on Protection, Retirement and Asset Management produces diversified and balanced mix of insurance and market risks. Full Year 2014 Pre-tax Earnings International Insurance 44% U.S. Insurance 9% Retirement 16% Individual Annuities 21% Asset Management 10% (1) $6.3 Billion |
 EARNINGS AND
ROE GROWTH
5 Financial Strength Symposium 6.23.2015 1) Pre-tax AOI excluding market driven and discrete items as shown in disclosure section.
2) ROE based on after-tax AOI excluding market driven and discrete items as shown in disclosure section; gives effect to direct equity
adjustment for earnings per share calculation. Based on average
attributed equity of the former Financial Services Businesses (FSB) excluding accumulated other comprehensive income (AOCI) and adjusted to remove amount included for foreign currency exchange rate remeasurement.
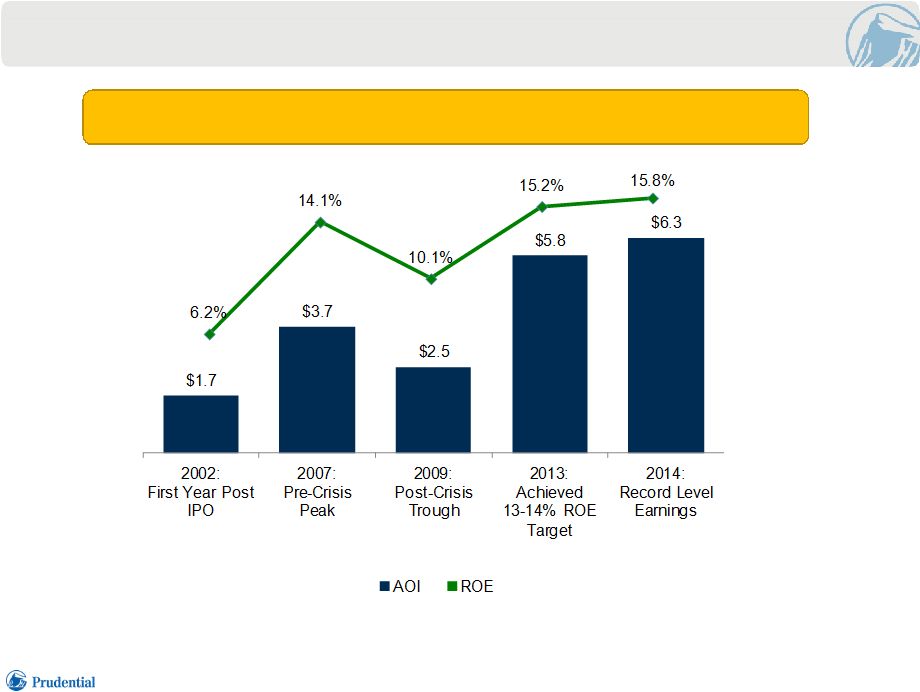
($ billions) (1) (2) Earnings are at record levels (1) with a superior business mix and a more conservative balance sheet, generating a sustainable ROE of 13% to 14%. |
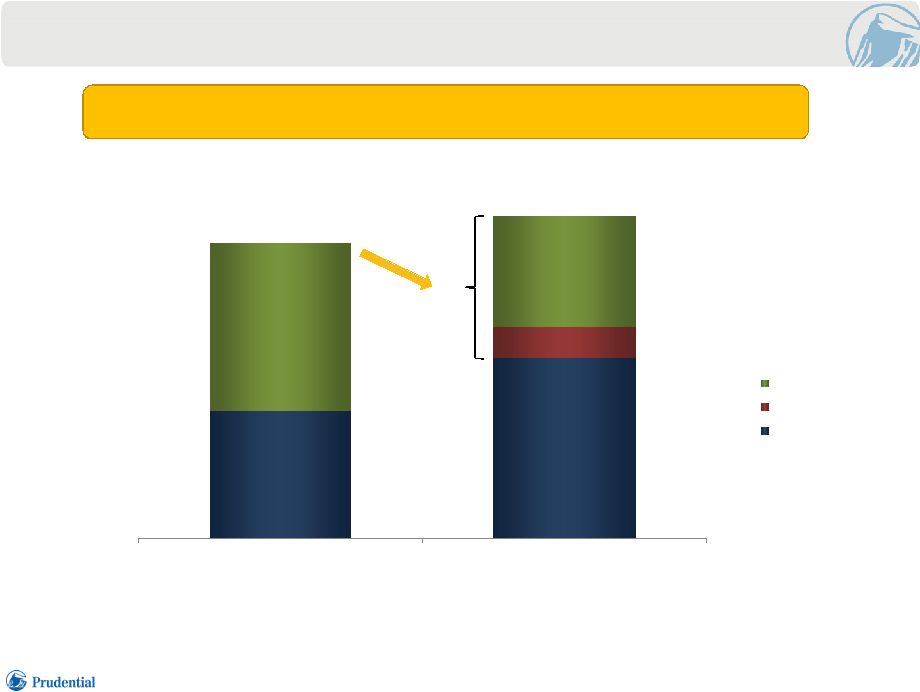 43% 56% 9% 57% 35% 12/31/2007 3/31/2015 Senior Debt Hybrids GAAP Equity 44% STRENGTHENED BALANCE SHEET 6 Financial Strength Symposium 6.23.2015 (1) 1) Excludes the impact of the foreign currency exchange rate remeasurement, non-performance risk (net of deferred policy
acquisition costs), and AOCI on GAAP Equity.
2) For the former FSB. Total Debt and Equity $47.1B Total Debt and Equity $51.6B Reduced debt and a more conservative capital structure have strengthened our balance sheet. (2) |
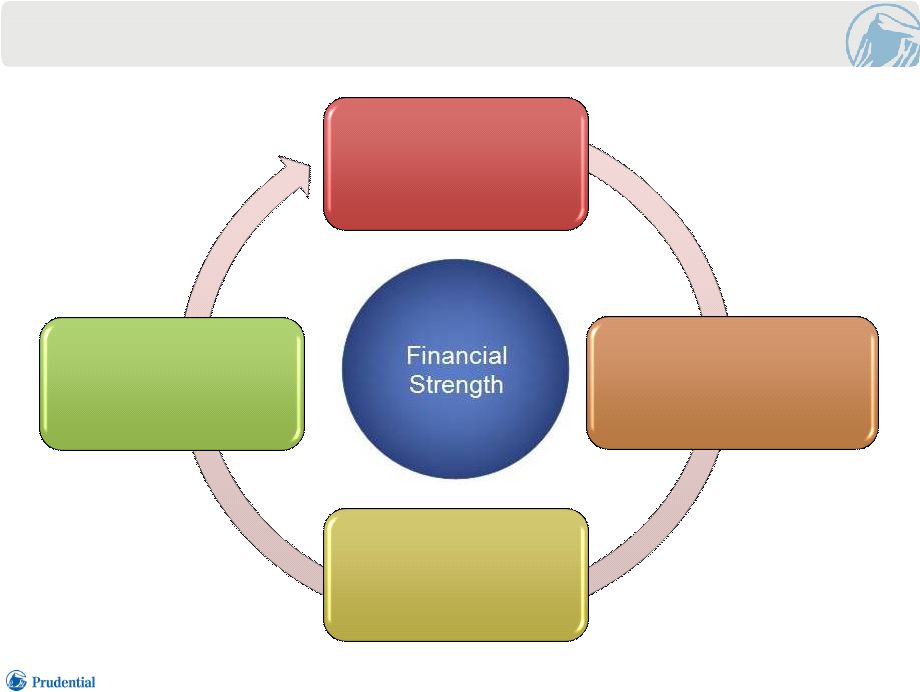 2015 AND
BEYOND:
FORTIFY
LEADERSHIP
POSITION
7 Financial Strength Symposium 6.23.2015 Focus on Protection, Retirement and Asset Management Invest in growth, innovation, capabilities and infrastructure Constructively navigate enhanced regulatory environment Enrich talent and culture |
 FINANCIAL
STRENGTH
8 Financial Strength Symposium 6.23.2015 • Diversified and complementary mix of insurance and market risks • Strong balance sheet - capital, liquidity and leverage • Sustainable ROE of 13-14% over a market cycle • Consistent cash flows from earnings supporting balanced capital deployment • Growth in earnings and book value with reduced volatility |
 KEY
TAKEAWAYS
9 Financial Strength Symposium 6.23.2015 • We are significantly stronger than ever before, and we continue to fortify our leadership position • We have a demonstrated history of successfully navigating change. We are positioned to thrive in the face of changing competitive, market and regulatory dynamics • We manage to ‘AA’ standards as financial strength remains core to our value
proposition to customers, employees, and investors
• Our consistent strategic focus has produced a diversified and balanced mix of insurance and market risks that generate a sustainable ROE of 13-14% • Our brand and talent management are competitive advantages and are well recognized across the industry • We are investing to maintain our competitive advantage in our targeted markets, which will further solidify our business and financial profile |
 PRUDENTIAL
FINANCIAL,
INC.
INTERNATIONAL
INSURANCE
CHARLES
LOWREY
EXECUTIVE
VICE
PRESIDENT
CHIEF
OPERATING
OFFICER |
 KEY
MESSAGES
2 • Superior execution • Emphasize death protection • Core proprietary and complementary third party distribution • Strong capital management • Growing retirement and inheritance needs • Rising income and wealth • Expanding markets • Growing third party distribution Challenges • Economic environment • Currency and interest rate risks • Aging population in Japan Growth Prospects Sustainable High Returns Financial Strength Symposium 6.23.2015 |
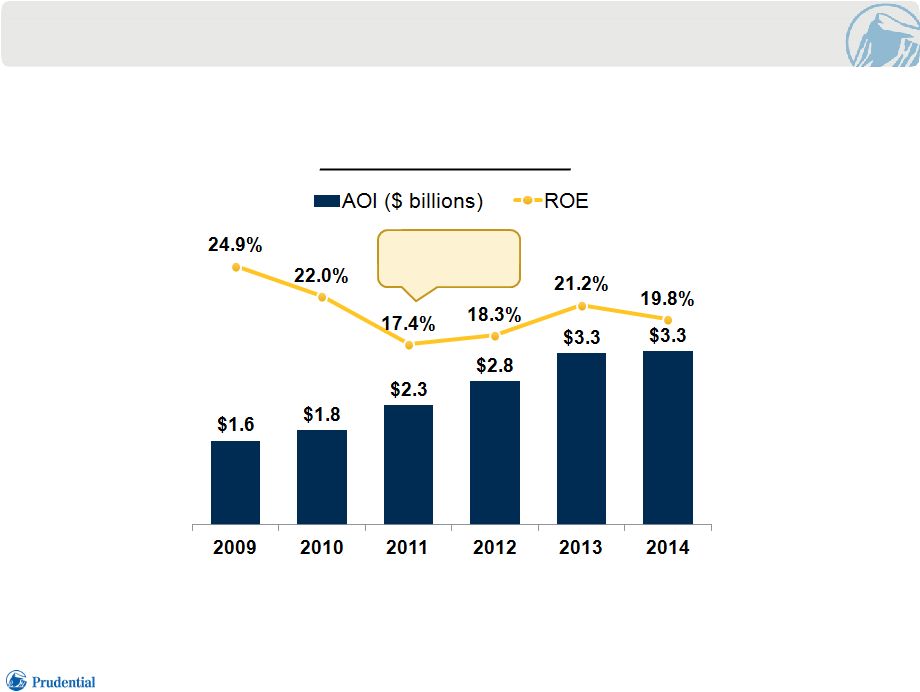 HIGH
RETURN
BUSINESS
Historical Earnings (1) & ROE (2) • International Insurance operations generate sustainable high ROE and strong earnings 1) Pre-tax adjusted operating income (AOI) excluding market driven and discrete items as shown in disclosure section.
2) Return on equity (ROE) based on after-tax AOI as adjusted herein using an overall effective rate for the former Financial Services Businesses
(FSB), and average attributed equity excluding accumulated other
comprehensive income and is adjusted to remove the impact of foreign currency exchange rate remeasurement. 3 Financial Strength Symposium 6.23.2015 Star & Edison Acquisition |
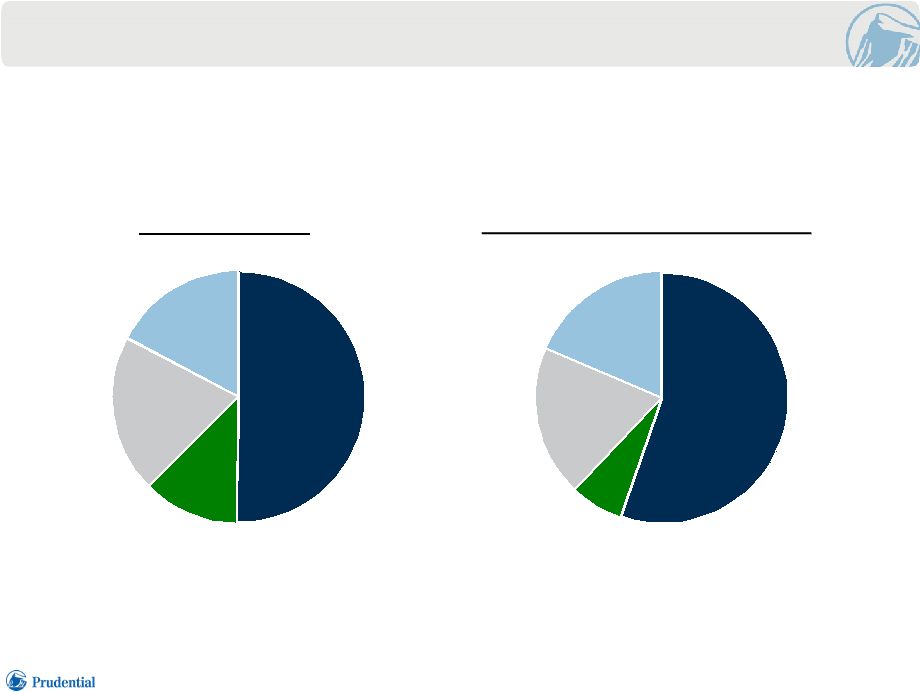 FOCUS ON
PROTECTION
PRODUCTS
• High margin protection products • Retirement financial security needs • Lifetime customer relationships 4 Death Protection 51% A&H 12% Retirement 20% Savings 17% (4) Premiums In Force (1)(2) Death Protection 55% A&H 7% Retirement 19% Savings 19% Annualized New Business Premiums (1)(3) 1) Japan only. Foreign denominated activity translated to U.S. dollars at uniform exchange rates for all periods presented; including Japanese
yen 91 per U.S. dollar. U.S. dollar denominated activity is
included based on the amounts as transacted in U.S. dollars.
2) As of 12/31/14. Annualized premiums in force, including paid-up policies and 10% of single premium. Percentages
approximate. 3)
For the year ended 12/31/14.
4) Savings includes annuities and yen based bank channel single premium whole life. Sales of yen based bank channel single premium whole life were
discontinued in 2013.
(4) Financial Strength Symposium 6.23.2015 |
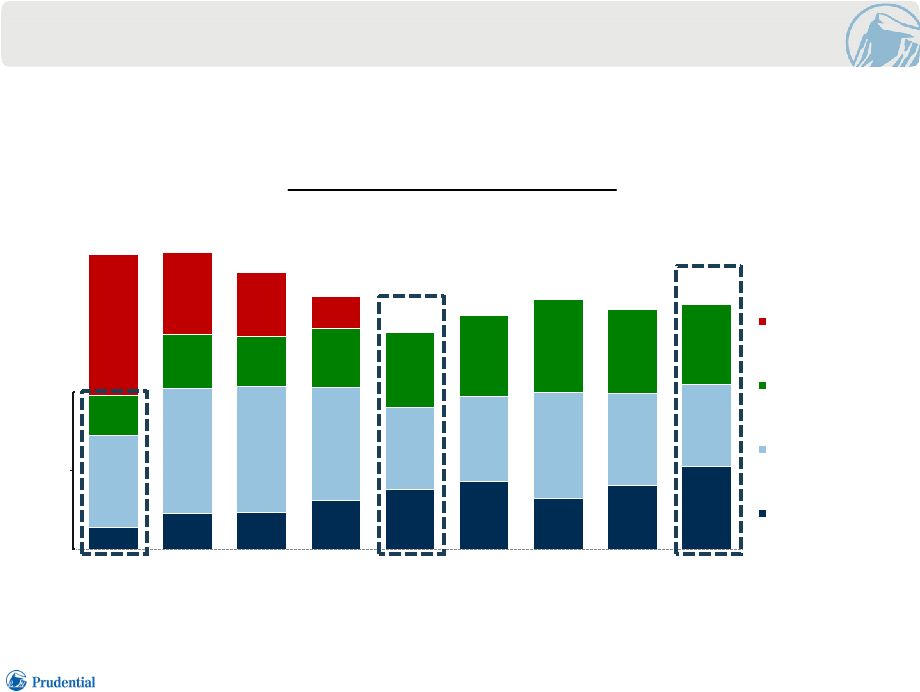 96
56 44 22 1Q13 2Q13 3Q13 4Q13 1Q14 2Q14 3Q14 4Q14 1Q15 Discontinued Yen Based SPWL Single Premium - All Other 3 and 5 Pay Whole Life 10 Pay and Longer Whole Life FOCUS ON PROTECTION PRODUCTS – BANK CHANNEL • Excluding discontinued yen savings product (1) , our bank channel sales are growing steadily 5 Annualized New Business Premiums (2) 1) Represents discontinued yen based single premium whole life product (SPWL). 2) Foreign denominated activity translated to U.S. dollars at uniform exchange rates for all periods; Japanese yen 91 per U.S. dollar. Japanese bank
channel results only.
($ millions) $202 $204 $190 $173 $149 $160 $172 $165 $168 $106 Financial Strength Symposium 6.23.2015 |
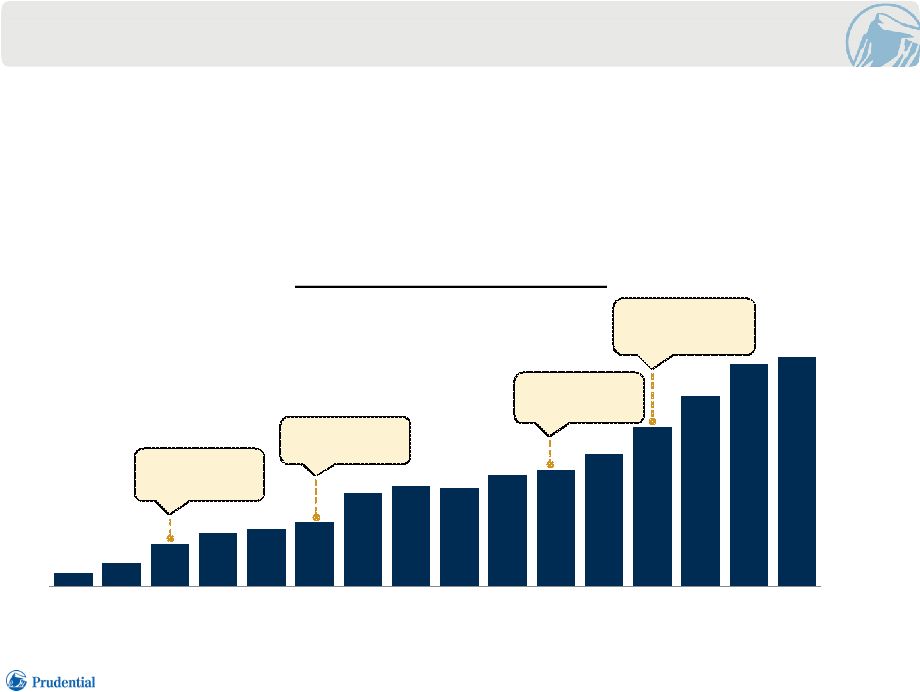         $0.2 $0.3 $0.6 $0.8 $0.8 $0.9 $1.3 $1.4 $1.4 $1.6 $1.7 $1.9 $2.3 $2.7 $3.2 $3.3 1999 2000 2001 2002 2003 2004 2005 2006 2007 2008 2009 2010 2011 2012 2013 2014 HISTORY OF GROWTH • Majority of our earnings come from Japan operations • Sustained track record of earnings growth despite volatile financial markets and challenging Japan macro environment International Insurance Pre-tax AOI (1) 6 ($ billions) Star & Edison Acquisition Yamato Acquisition Aoba Acquisition Kyoei Acquisition • Driven by a combination of organic growth, M&A, and successful business integrations 1) Not adjusted for market driven and discrete items. Financial Strength Symposium 6.23.2015 |
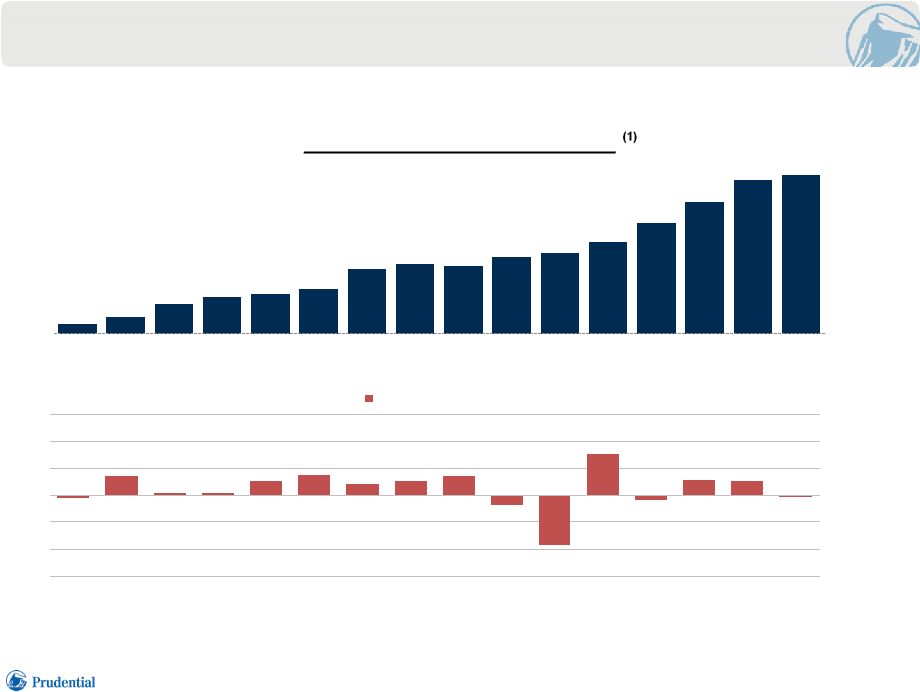 $0.2 $0.3 $0.6 $0.8 $0.8 $0.9 $1.3 $1.4 $1.4 $1.6 $1.7 $1.9 $2.3 $2.7 $3.2 $3.3 1999 2000 2001 2002 2003 2004 2005 2006 2007 2008 2009 2010 2011 2012 2013 2014 HISTORY OF GROWTH • Sustained earnings growth despite low/negative GDP growth in Japan International Insurance Pre-tax AOI 7 ($ billions) -0.2% 2.3% 0.4% 0.3% 1.7% 2.4% 1.3% 1.7% 2.2% -1.0% -5.5% 4.7% -0.5% 1.8% 1.6% 0.0% -9% -6% -3% 0% 3% 6% 9% Japan GDP Growth Rate (2) 1) Not adjusted for market driven and discrete items. 2) Source: Economic and Social Research Institute, Cabinet Office. Based on annual real gross domestic product (GDP).
Financial Strength Symposium 6.23.2015 |
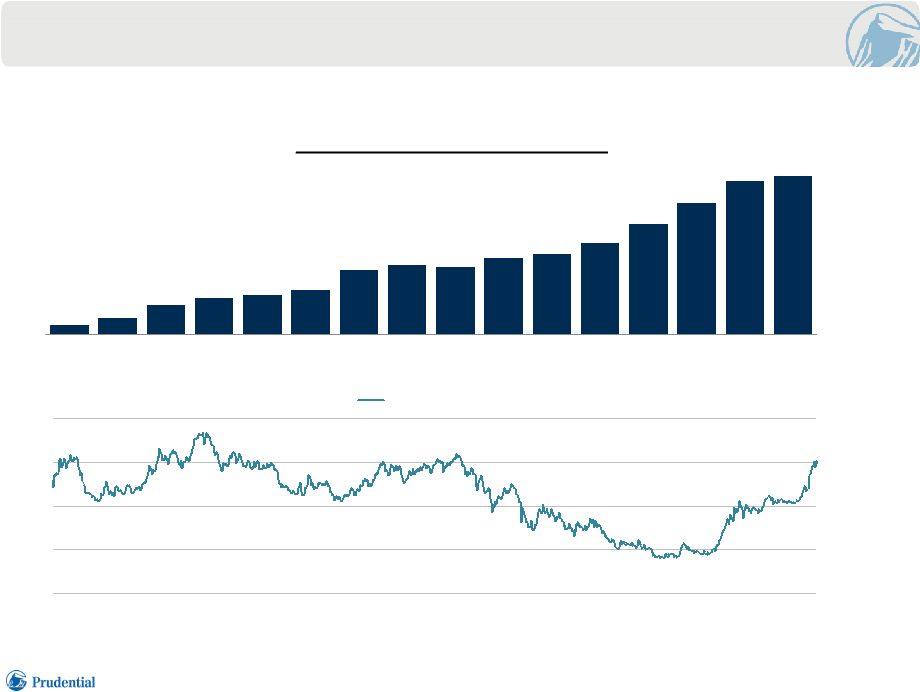 $0.2 $0.3 $0.6 $0.8 $0.8 $0.9 $1.3 $1.4 $1.4 $1.6 $1.7 $1.9 $2.3 $2.7 $3.2 $3.3 1999 2000 2001 2002 2003 2004 2005 2006 2007 2008 2009 2010 2011 2012 2013 2014 120 60 80 100 120 140 1999 2000 2001 2002 2003 2004 2005 2006 2007 2008 2009 2010 2011 2012 2013 2014 JPY/USD FX rate HISTORY OF GROWTH • Sustained earnings growth despite foreign exchange (FX) rate volatility (¥) International Insurance Pre-tax AOI (1) 8 ($ billions) 1) Not adjusted for market driven and discrete items. Financial Strength Symposium 6.23.2015 |
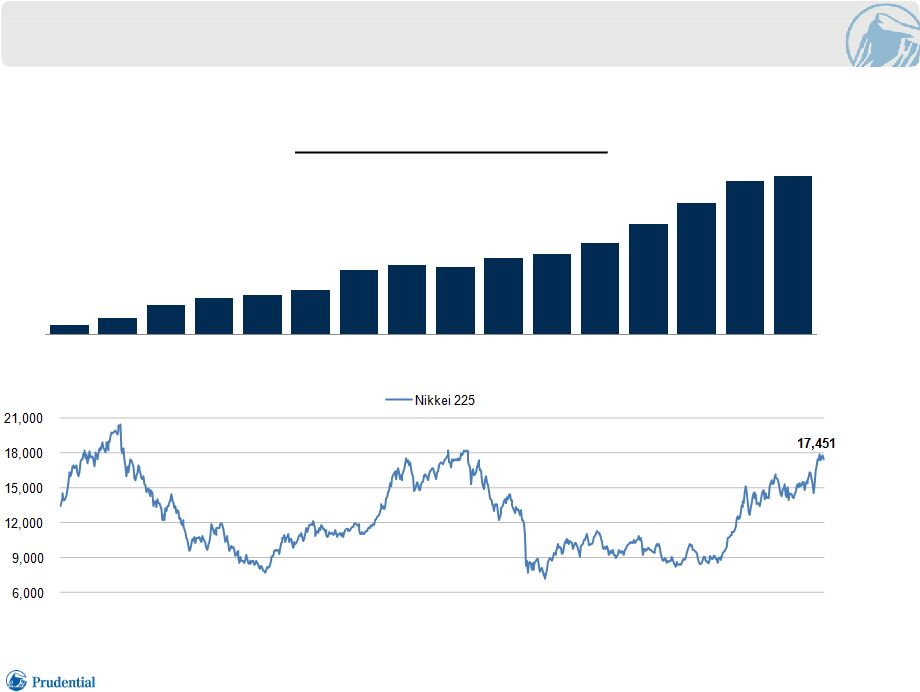 $0.2 $0.3 $0.6 $0.8 $0.8 $0.9 $1.3 $1.4 $1.4 $1.6 $1.7 $1.9 $2.3 $2.7 $3.2 $3.3 1999 2000 2001 2002 2003 2004 2005 2006 2007 2008 2009 2010 2011 2012 2013 2014 HISTORY OF GROWTH • Sustained earnings growth despite Japanese equity market volatility (Index) International Insurance Pre-tax AOI (1) 9 ($ billions) 1) Not adjusted for market driven and discrete items. Financial Strength Symposium 6.23.2015 |
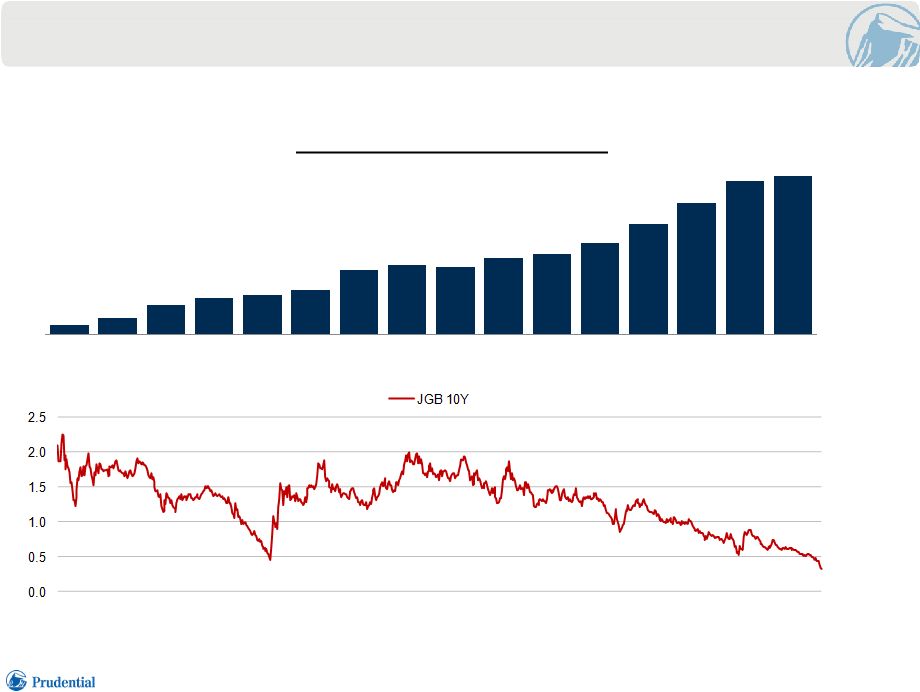 $0.2 $0.3 $0.6 $0.8 $0.8 $0.9 $1.3 $1.4 $1.4 $1.6 $1.7 $1.9 $2.3 $2.7 $3.2 $3.3 1999 2000 2001 2002 2003 2004 2005 2006 2007 2008 2009 2010 2011 2012 2013 2014 HISTORY OF GROWTH • Sustained earnings growth despite declining interest rates (% Yield) International Insurance Pre-tax AOI (1) 10 ($ billions) 1) Not adjusted for market driven and discrete items. Financial Strength Symposium 6.23.2015 .3% |
 FOUR
PILLARS
FOR PROFITABLE GROWTH 11 Superior Execution in Existing Business Product Development to Meet Customer Needs Distribution Expansion in Proprietary and Third Party Channels Complementing Organic Growth with M&A Our Growth Strategies Financial Strength Symposium 6.23.2015 |
 CORE
FUNDAMENTAL
GROWTH
OPPORTUNITIES
12 Life Planner Operations • Continuing Life Planner force growth • Expansion in selected markets • Inheritance market opportunity in Japan Gibraltar Life & Other Operations • Life Consultant force stabilized and poised to grow • Expansion in selected markets and third party distribution • Inheritance market opportunity in Japan Financial Strength Symposium 6.23.2015 |
 CHALLENGES AND
POSITIONING
13 Challenges • Selectivity limits pace of growth of Life Planner force • Expected gradual attrition of large acquired blocks of business partly offsets business growth • Aging Japanese population • Currency risk • Interest rate risk Prudential Positioning • Expanding complementary third party distribution • Building operations in selected growth markets • Proven track record of M&A and business integrations • Product solution for retirement financial security and inheritance protection needs • Lifetime client relationships support subsequent sales for changing needs • Currency hedging programs for income and equity • Limited portfolio turnover, strong asset liability management, emphasis on mortality and expense margins Financial Strength Symposium 6.23.2015 |
 PRUDENTIAL
FINANCIAL,
INC.
INTERNATIONAL
INSURANCE
JOHN
HANRAHAN
SENIOR
VICE
PRESIDENT
CHIEF
FINANCIAL
OFFICER |
 KEY
MESSAGES
15 • Exposure • Sensitivity • Risk mitigation Interest Rate • Exposure • Sensitivity • Risk mitigation FX Capital Management • Generation • Utilization • Solvency margin ratios Financial Strength Symposium 6.23.2015 |
 CURRENCY
EXPOSURE
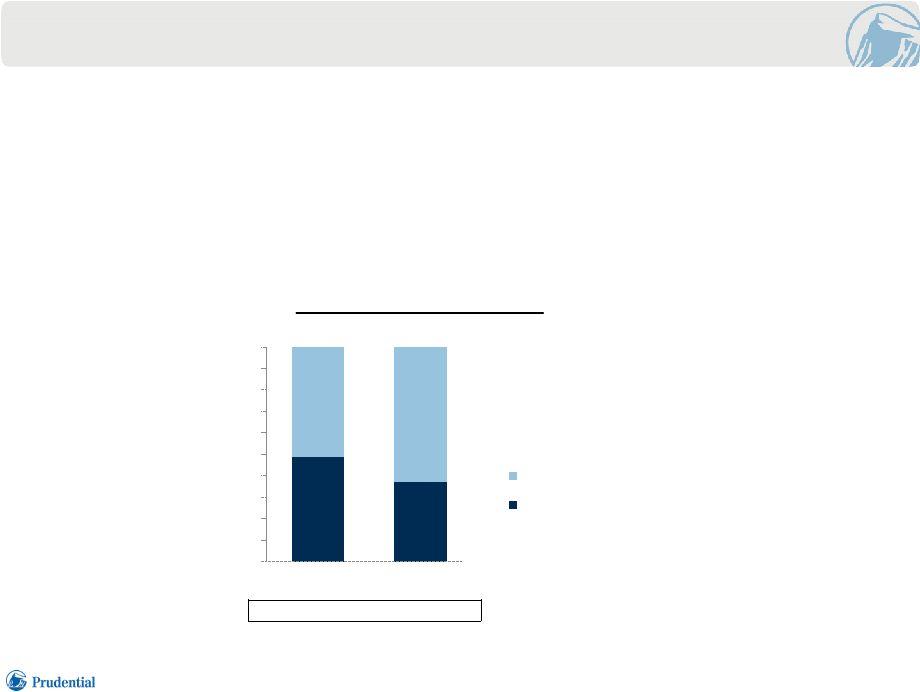
• Less than half of Japan’s earnings are yen sensitive – Certain expenses related to non-yen denominated business are paid in yen and are
reducing exposure of earnings to yen value changes
• Contributing factors to declining yen AOI as a percentage of total AOI include increase in USD investments, disproportionately higher yen expenses, and weaker
yen currency exchange rate
16 1) Percentage based on pre-tax AOI excluding market driven and discrete items for our Japanese insurance operations.
49% 37% 51% 63% 0% 10% 20% 30% 40% 50% 60% 70% 80% 90% 100% 2013 1Q15 Non-Yen Yen USD/JPY Plan Rate 80 91 Japan Earnings (1) (Currency Mix) Financial Strength Symposium 6.23.2015 |
 CURRENCY
SENSITIVITY
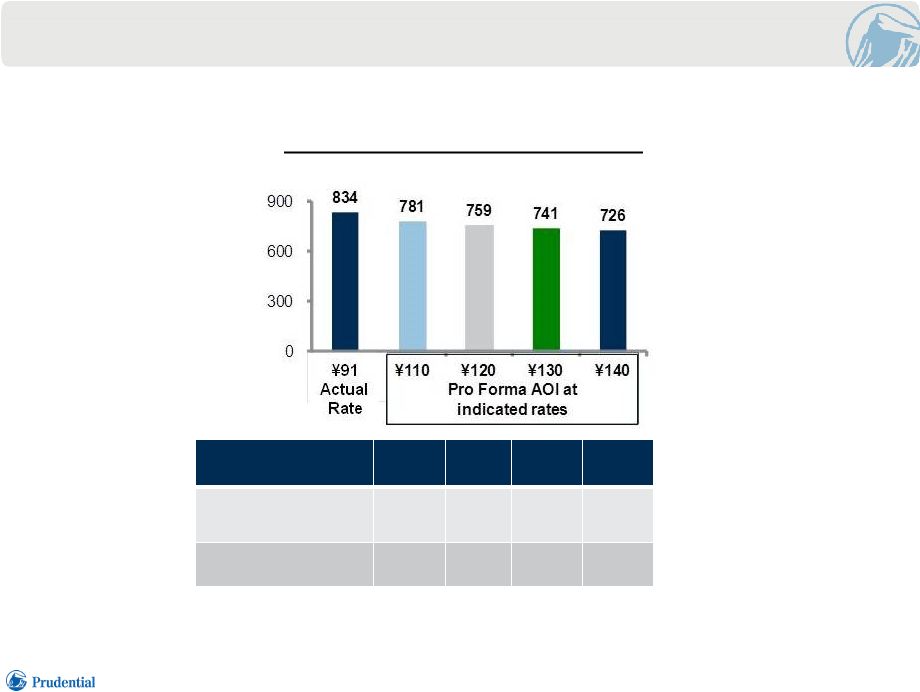
International Insurance 1Q 2015
Earnings at Different Yen Hedging Rates (1) 1) Based on actual and alternative assumed hedging rates for Japanese yen income to U.S. dollars.
17 Hypothetical Hedging Rates ¥110 ¥120 ¥130 ¥140 Difference from Actual Hedging Rate 21% 32% 43% 54% Pro Forma Impact to AOI (6)% (9)% (11)% (13)% ($ millions) Financial Strength Symposium 6.23.2015 |
 HEDGING
OBJECTIVES
18 • Protect Enterprise Earnings and ROE • Protect Long-term Value • Insulate Solvency Margin Ratio Financial Strength Symposium 6.23.2015 |
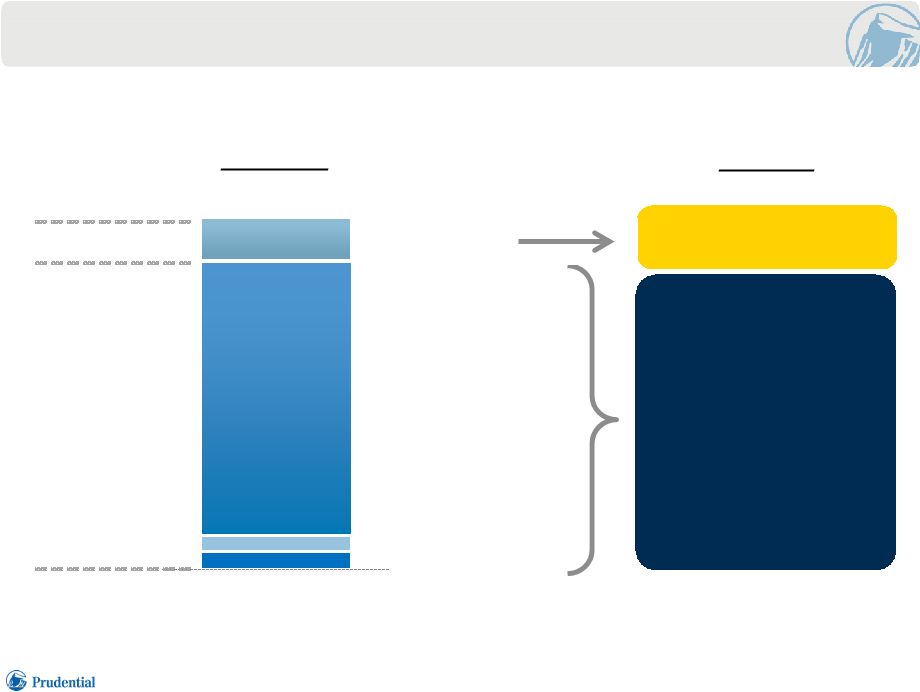 HEDGING
CURRENCY
EXPOSURE
19 • Yen Hedging Strategy Existing Hedges as of 3/31/15 $1.9 $15.5 $12.1 $0.7 $0.8 Hedge Type Forwards USD Assets Yen Debt Dual Currency Bonds Protects Long-term Value Protects Near-term Earnings and Cash Flow Protection Income Hedge Equity Hedge ($ billions) Financial Strength Symposium 6.23.2015 |
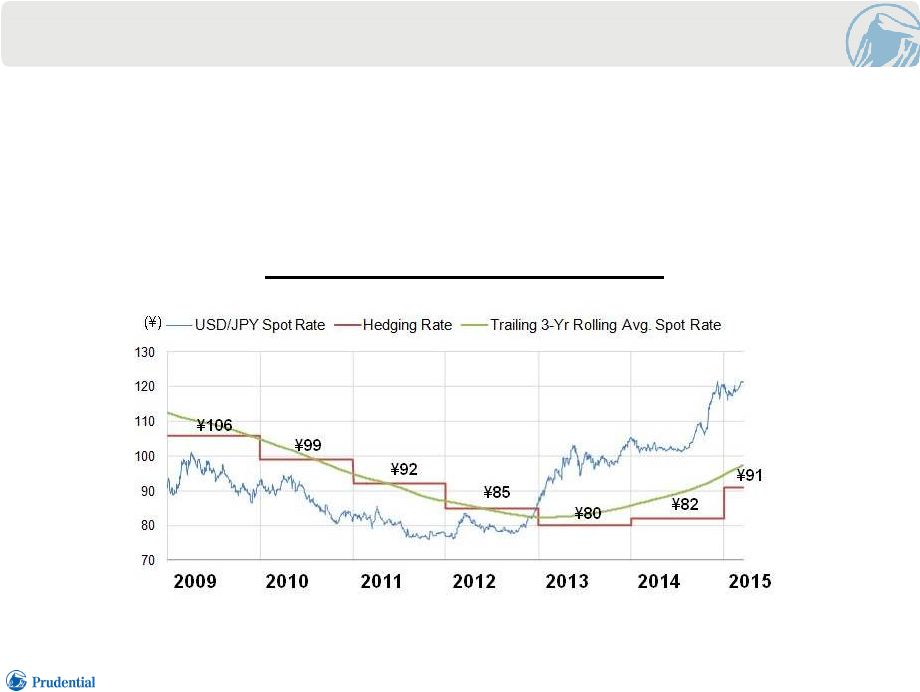 YEN
EARNINGS
HEDGE
Historical Yen Spot Rates vs. Hedging Rates
• Expected yen-based AOI is hedged over a 36 month rolling period using a series of FX forwards with laddered maturities • Each quarter’s expected yen earnings are hedged over the preceding 9 quarters. The hedged rate is an average of these transactions 20 Financial Strength Symposium 6.23.2015 |
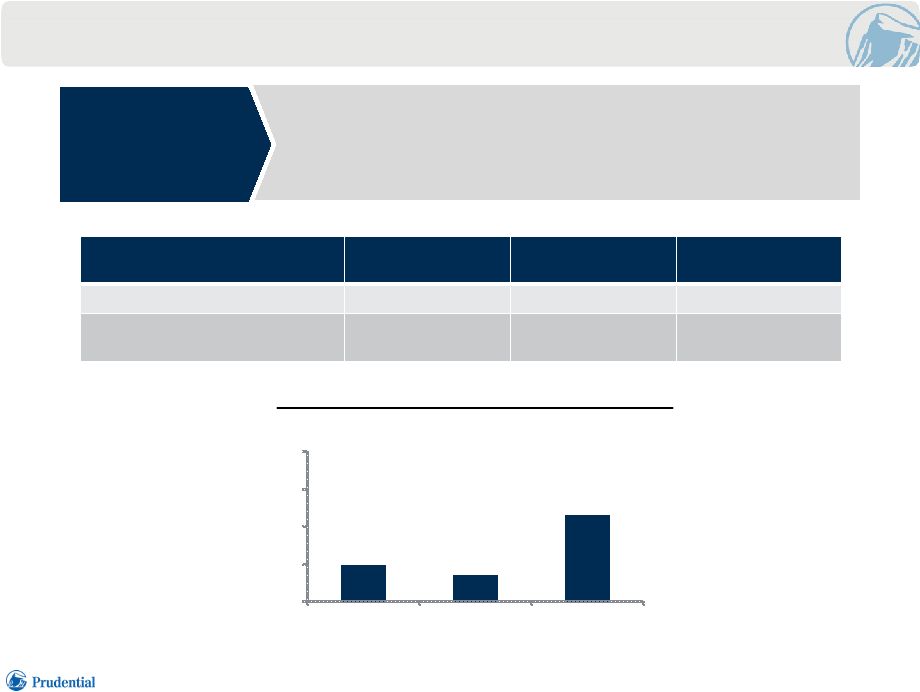 FAIR
VALUE
OF YEN EQUITY HEDGE (1) Equity Hedges 1) As of 3/31/15. 21 Equity Hedge FX Sensitivity Spot Rate as of 3/31/15 10% JPY Appreciation 10% JPY Depreciation USD/JPY Rate ¥120 ¥108 ¥132 Fair Value of Equity Hedges ($ billions) 2.4 1.2 3.7 24% 18% 58% 0% 25% 50% 75% 100% 2015 2016 2017 + Maturity Profile of Equity Hedge Settlements • $13.6 billion “notional” value of yen exposure - $2.4 billion fair value of PFI hedges - Cash is realized over time as settlements occur Financial Strength Symposium 6.23.2015 |
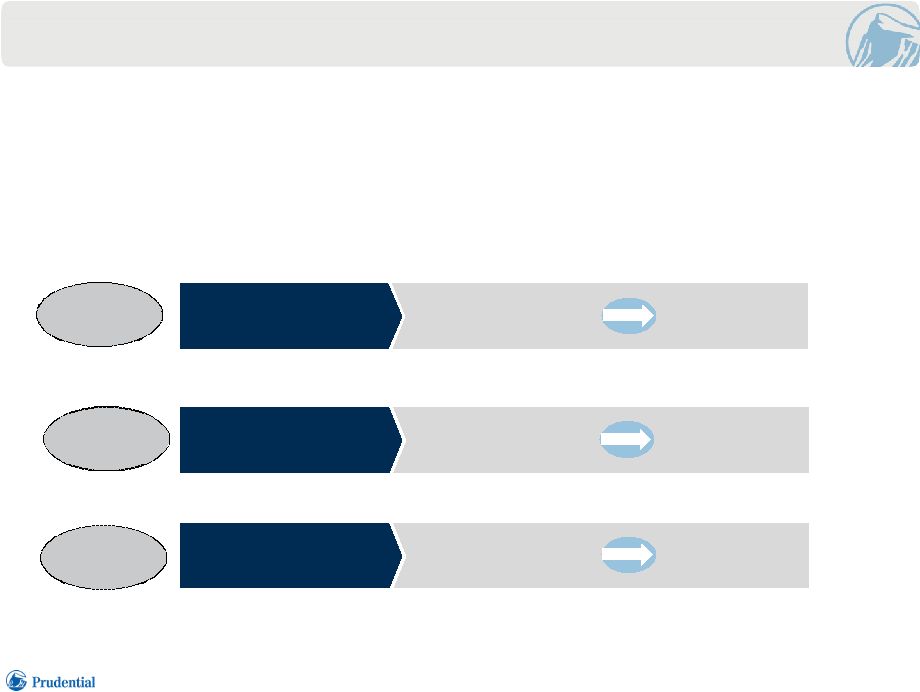       YEN
EQUITY
HEDGE
ILLUSTRATION
(1) 22 Weakening Yen USD Assets Worth More ¥ Cash from Japan Stable Yen Strengthening Yen • We protect our equity investment in Japan by primarily purchasing U.S. dollar investments in Japan • We hedge these bonds primarily internally, to insulate Solvency Margin Ratios from FX volatility. This can create cash flow transfers between Japan
and the U.S. ~800% SMR ~800% SMR ~800% SMR 1) Broadly equivalent solvency margin ratio (SMR) over time. USD Assets Worth Same ¥ No Cash Movement USD Assets Worth Less ¥ Cash to Japan Financial Strength Symposium 6.23.2015 |
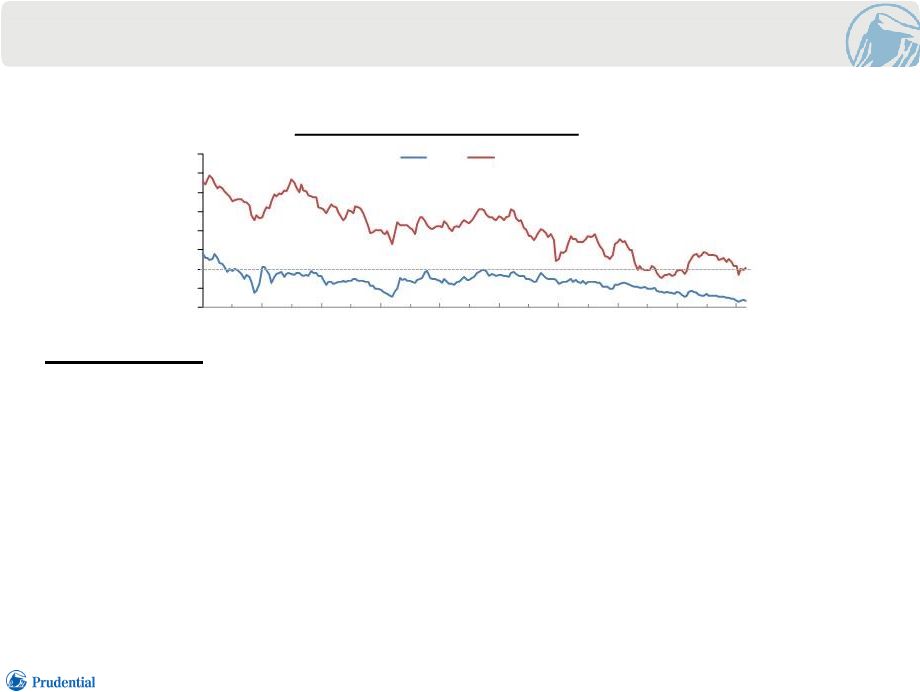 KEY
MITIGANTS
FOR INTEREST RATE EXPOSURE • Low portfolio turnover • Strong asset liability management • Emphasis on protection products – stable earnings from mortality and expense margins • Reprice new business when appropriate to maintain margins • Fixed annuity products designed to mitigate interest rate risk (i.e., bi-weekly repricing for new business, market value adjustments) 23 Key Mitigants 10 Year Government Bond Yield • Interest rates have been low in Japan for many years Financial Strength Symposium 6.23.2015 0% 1% 2% 3% 4% 5% 6% 7% 1997 1999 2001 2003 2005 2007 2009 2011 2013 JGB UST 8% 2015 |
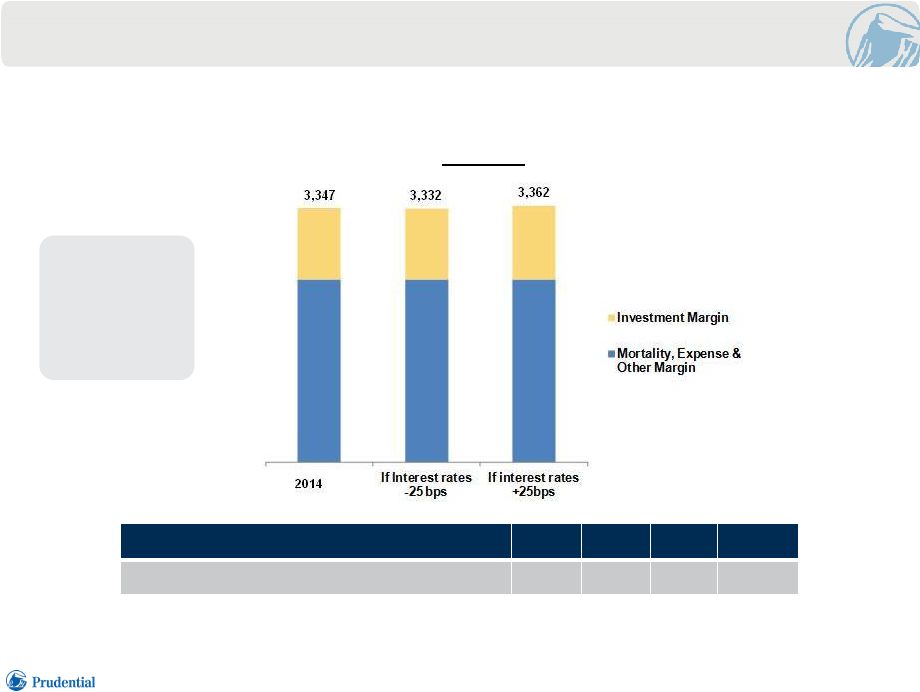 IMPACT OF
CHANGING
INTEREST
RATE
ENVIRONMENT
Earnings (1) +/- 25 bps = ~$15 million in near-term 24 Sensitivity of AOI to Interest Rate (-25 bp) 2014 2015 2016 2017 Pro Forma Impact to 2014 Pre-tax AOI ($ millions) (15) (45) (75) (105) Financial Strength Symposium 6.23.2015 ($ millions) • In the near-term, earnings are not materially impacted by modest changes in interest rates 1) Pre-tax AOI excluding market driven and discrete items as shown in disclosure section. The analysis represents assumed investment of renewal
premiums and reinvestment of investment income and proceeds from maturing
investments at market interest rates 25 bps higher or lower than actual rates during the year. |
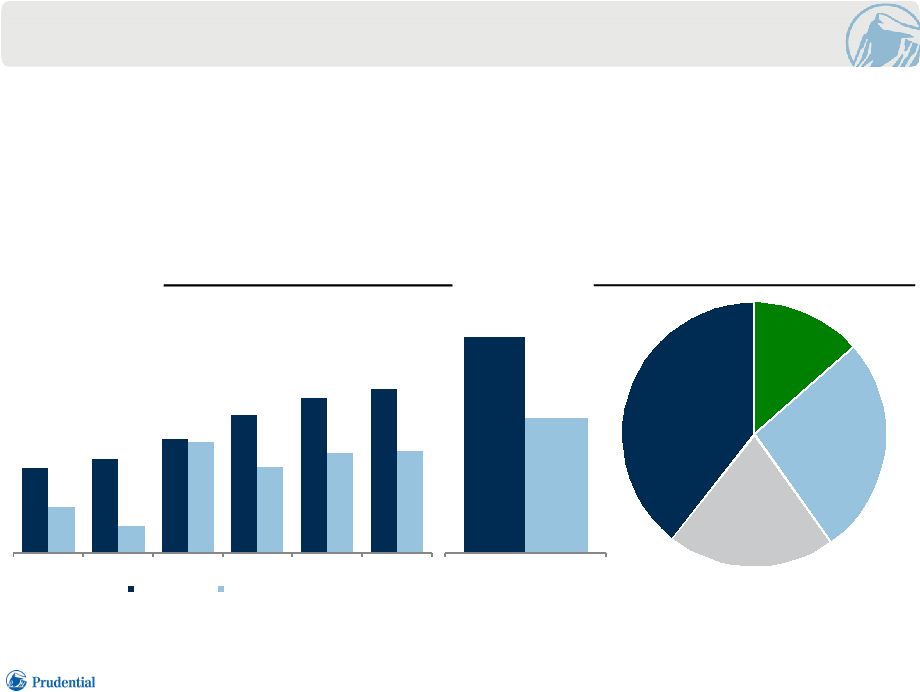 • Redeployed excess capital of more than 60% of after-tax AOI since 2009 (1) • As the Japan business matures, we expect capital returned to increase relative to earnings
as less capital will be needed to support growth
• Japan returns capital to the U.S. through diverse means and in accordance with regulatory
standards HISTORICAL CAPITAL GENERATION AND REDEPLOYMENT 25 ($ billions) Historical Capital Redeployment 1) Through 2014. 2) After-tax AOI reflects the effective tax rate of the former FSB. Forms of Cumulative Redeployment Dividends 13% Debt Repayment 27% Affiliate Lending 21% Acquisition Funding and Other 39% (2) $7.0 Financial Strength Symposium 6.23.2015 $11.0 Cumulative 2009 - 2014 $1.2 $1.4 $1.7 $2.0 $2.3 $2.4 $0.7 $0.4 $1.6 $1.3 $1.5 $1.5 2009 2010 2011 2012 2013 2014 After-Tax AOI Capital Redeployed |
 SOLVENCY
MARGIN
RATIO
26 SMR (1) March 31, 2015 Stressed Scenario Prudential of Japan 844% ~745% Gibraltar Life (2) 882% ~740% 1) Based on Japanese statutory accounting and risk measurement standards applicable to regulatory filings as of 3/31/15.
2) Gibraltar consolidated basis. 3) Represents indicated change applied to asset valuations. • Solvency margin position of Prudential’s Japanese insurance companies – well capitalized and financially secure • Well above our target SMR of 600% - 700% Stressed Scenario (3) • Japan Equity • Real
Estate • USD & AUD FX Rates • Interest Rates
Down 55% Down 35% Strengthening 20% Up 100 bps Financial Strength Symposium 6.23.2015 |
 PRUDENTIAL
FINANCIAL,
INC. U.S.
BUSINESSES
STEPHEN
PELLETIER
EXECUTIVE
VICE
PRESIDENT
CHIEF
OPERATING
OFFICER |
 EXECUTIVE
SUMMARY
• Prudential’s U.S. business portfolio has been designed to: – Generate sustainable earnings and attractive returns – Be resilient in the face of headwinds – Provide diversification and facilitate risk management – Position us for growth opportunities • We integrate our distinctive set of investment and insurance capabilities to deliver a range of solutions to meet changing customer needs • We invest within and across businesses to enhance the customer experience and enable new growth opportunities 2 Financial Strength Symposium 6.23.2015 |
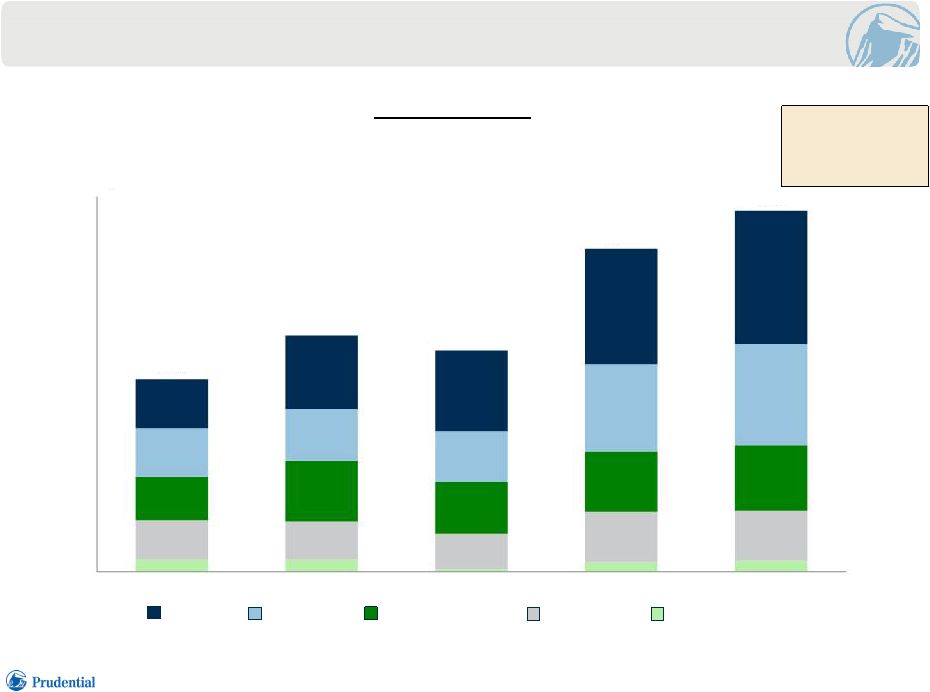 OUR
BUSINESS
MIX
GENERATES
SUSTAINABLE
EARNINGS
3 Pre-Tax Earnings (1) 1) Adjusted Operating Income (AOI) excluding market driven and discrete items as shown in disclosure section.
Retirement Annuities Asset Management Group Insurance Individual Life AOI (1) CAGR 17% (~15% to 16% excluding Hartford) ($ billions) Financial Strength Symposium 6.23.2015 $2.3 $2.8 $2.7 $3.9 $4.3 $0.0 $1.0 $2.0 $3.0 $4.0 2010 2011 2012 2013 2014 |
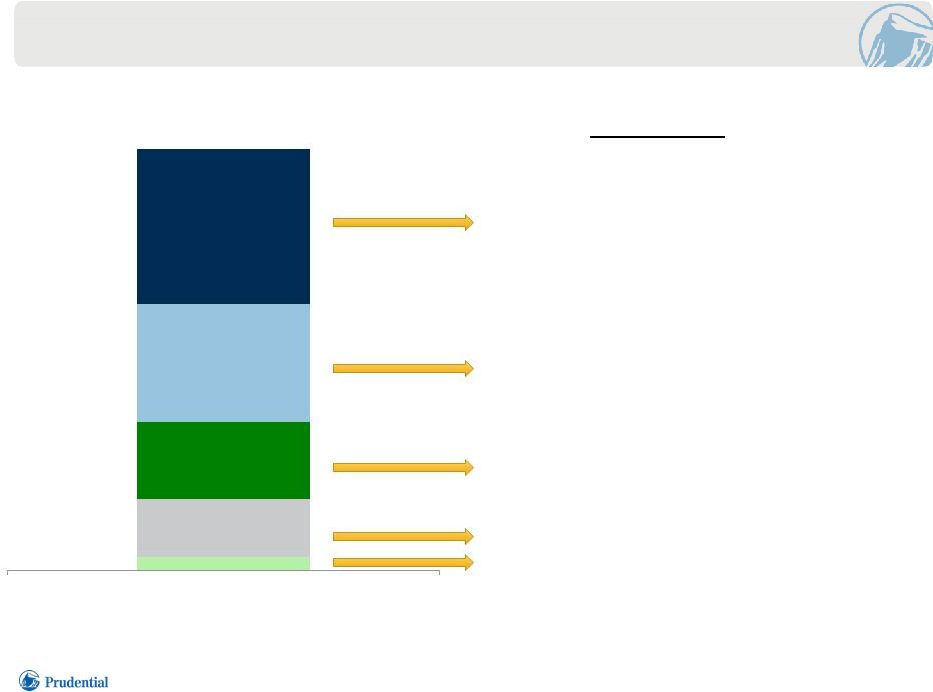 THE U.S.
BUSINESS
PORTFOLIO
IS WELL-BALANCED
BY TYPE OF RISK 4 Principal Risks 2014 Earnings (1) $4.3 billion Equity Markets, Interest Rates, Longevity Credit, Longevity, Interest Rates Equity Markets Mortality, Interest Rates, Credit Mortality, Morbidity 1) Pre-tax AOI excluding market driven and discrete items as shown in disclosure section.
Annuities Retirement Asset Management Individual Life Group Insurance Financial Strength Symposium 6.23.2015 |
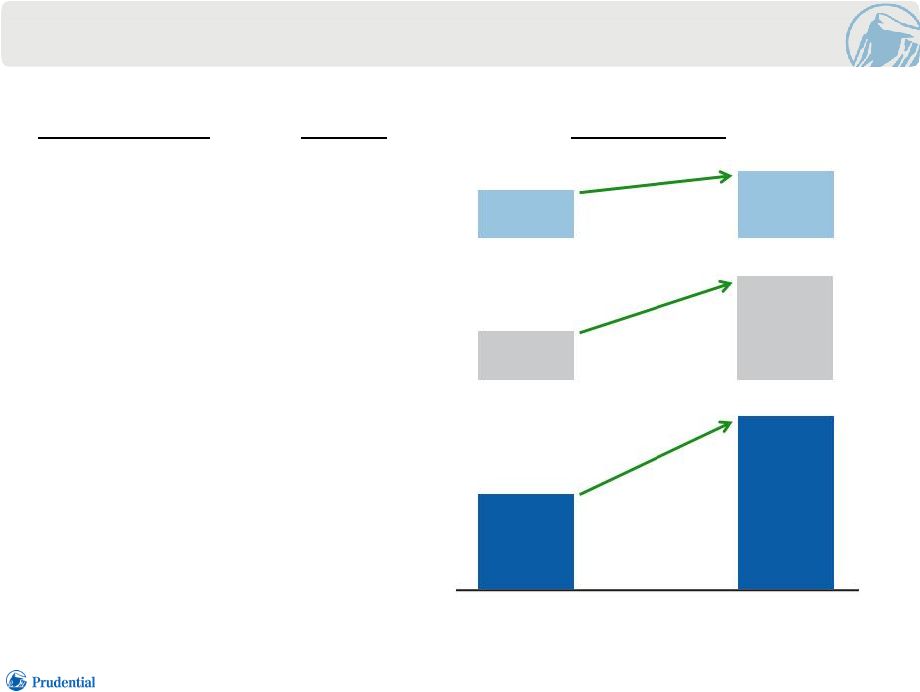 OUR
BUSINESS
MIX
CREATES
HIGH
QUALITY,
DIVERSIFIED
EARNINGS
STREAMS
5 Pre-Tax Earnings (1) Individual Annuities Asset Management Retirement Individual Life Group Insurance $ 1,112 $ 2,381 $ 1,213 $ 732 $ 618 $ 580 2010 2014 Underwriting Spread Fee Primary Source of Earnings Business 1) AOI excluding market driven and discrete items as shown in disclosure section. Financial Strength Symposium 6.23.2015 ($ millions)
|
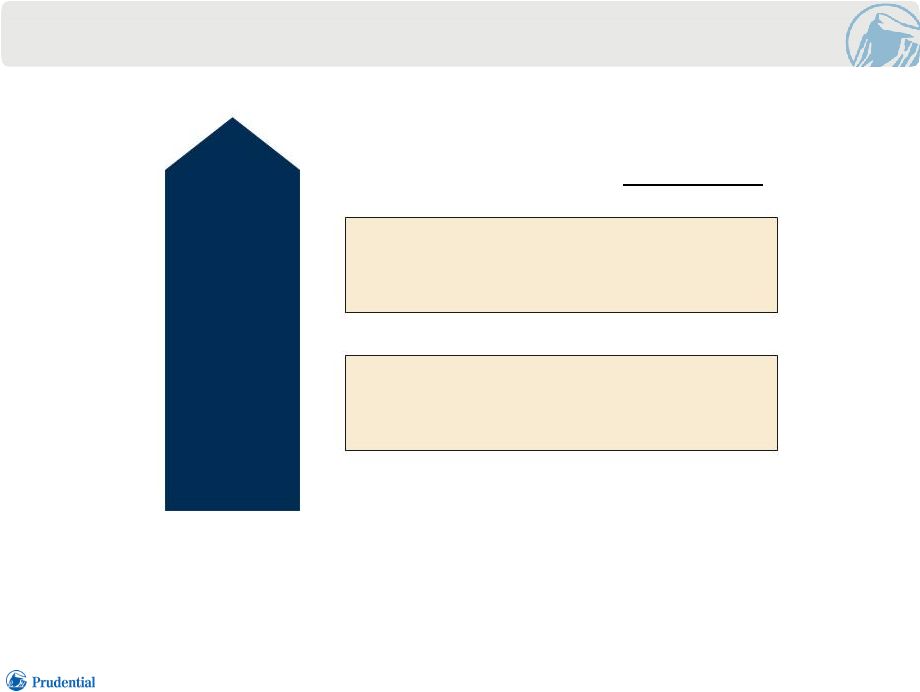 OUR
BUSINESS
MIX
DRIVES
ATTRACTIVE
RETURN
PROSPECTS
6 ROE Potential (1) Mid-High Teens Low Double Digits 1) Return on equity (ROE) potential ranges based on after-tax AOI using an overall effective tax rate for Prudential Financial, Inc. excluding
the Closed Block division, and average attributed equity excluding
accumulated other comprehensive income. Reflects view of weighted average potential returns over long term using base case assumptions. Growth Potential Asset Management Retirement Annuities Individual Life Group Insurance Financial Strength Symposium 6.23.2015 |
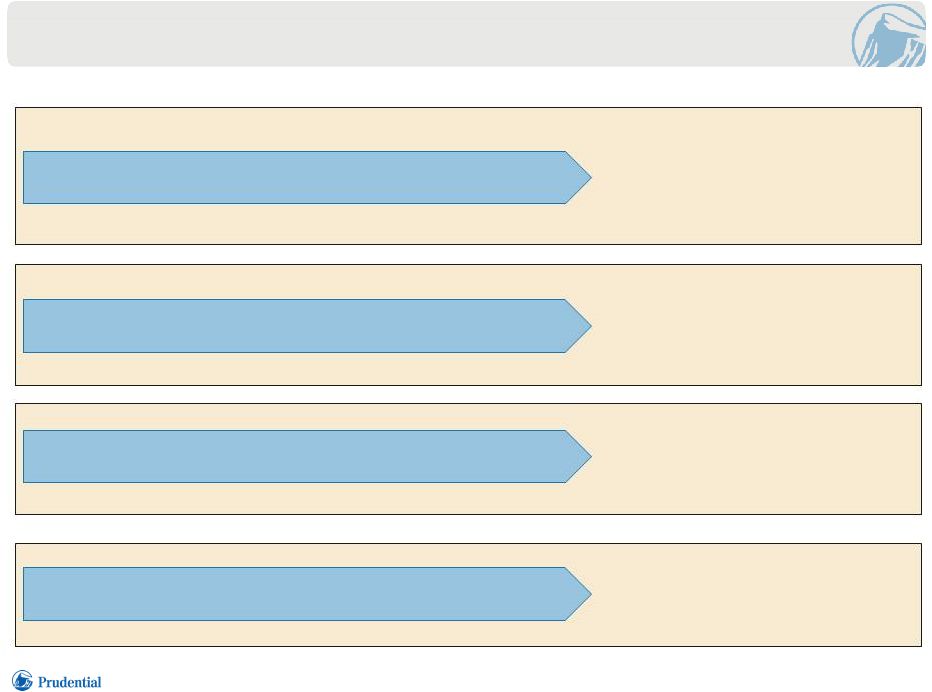 EVOLVING
CUSTOMER
NEEDS
CREATE
GROWTH
OPPORTUNITIES
THAT
WE
ARE WELL-POSITIONED
TO ADDRESS 7 Movement toward derisking in large Defined Benefit markets • Building on Pension Risk Transfer (PRT) market leadership in U.S.; pursuing international opportunities • Offering range of institutional investment solutions, including fixed income and liability driven investing • Expanding voluntary benefits offerings Employers’ need to control benefit costs while offering employees an attractive suite of benefit options • Redesigning defined contribution plans • Enhancing life insurance policy features • Expanding Prudential Advisors outreach beyond the traditional approach Increasing individual responsibility for financial security, resulting in a growing need for more certain outcomes • Expanding retail investment offerings • Expanding annuity offerings to include non-equity aligned and investment-focused products Older population controlling vast majority of financial assets Financial Strength Symposium 6.23.2015 |
 WE ARE
INVESTING
WITHIN
AND ACROSS BUSINESSES TO ENHANCE THE CUSTOMER EXPERIENCE AND ENABLE NEW GROWTH OPPORTUNITIES 8 2014 investment in our businesses ~$100 million (1) Digital Experience Data Analytics Systems Upgrades Talent 1) Approximate pre-tax amount spent, after impact of cost savings and efficiencies realized.
Financial Strength Symposium 6.23.2015 |
 WE ARE
MAINTAINING
A STRONG FOUNDATION FROM WHICH TO GENERATE SUSTAINABLE PROFITABLE GROWTH 9 Asset Management Generating earnings that are driven primarily and increasingly by “core” asset management fees
Experiencing sustained, positive net flows driven by strong investment
performance Investing in new asset management capabilities and product
offerings, and expanding international presence Hired a significant
number of investment professionals Retirement
Continuing to invest in advancing PRT leadership capabilities
Investing in Full Service business to position for long term profitability and
growth Group Insurance
Rationalized product portfolio and market segment focus
Completing disability turnaround to position for resumed controlled
growth Making improvements in pricing, underwriting, and claims
management practices Individual Life Insurance
Generating sales that reflect a more diversified product mix
Completed final steps of Hartford integration; run-rate benefits expected to be
fully realized by third quarter 2015
Annuities Executing product diversification strategy, improving risk profile and offering a broad range of solutions
Financial Strength Symposium 6.23.2015 |
 PRUDENTIAL
FINANCIAL,
INC.
RETIREMENT
PHILIP
WALDECK
SENIOR
VICE
PRESIDENT
PENSION
& STRUCTURED
SOLUTIONS |
 PRUDENTIAL
RETIREMENT:
STRENGTH,
BREADTH AND
DEPTH
ACROSS MARKETS 2 1) 2014 PLANSPONSOR DC Recordkeeping Survey, based on total recordkeeping assets as of 12/31/13.
2) Internally managed, domestic institutional, tax-exempt, Stable Value Assets as of 12/31/13 – Pensions and Investments’ Money Managers Directory, 5/31/15. 3) LIMRA Group Annuity Survey 1Q15. Mission: To serve the retirement security needs of institutions and individuals #6 in DC assets (1) Leading provider in our chosen markets #1 in Stable Value (2) #1 in PRT (3) Defined Contribution (DC) Full spectrum of retirement products and solutions Defined Benefit (DB) Non-Qualified Investment-Only Stable Value Other Institutional Investments Pension Risk Transfer (PRT) Structured Settlements Financial Strength Symposium 6.23.2015 |
 STRONG AND
CONSISTENT
ACCOUNT
VALUE
GROWTH
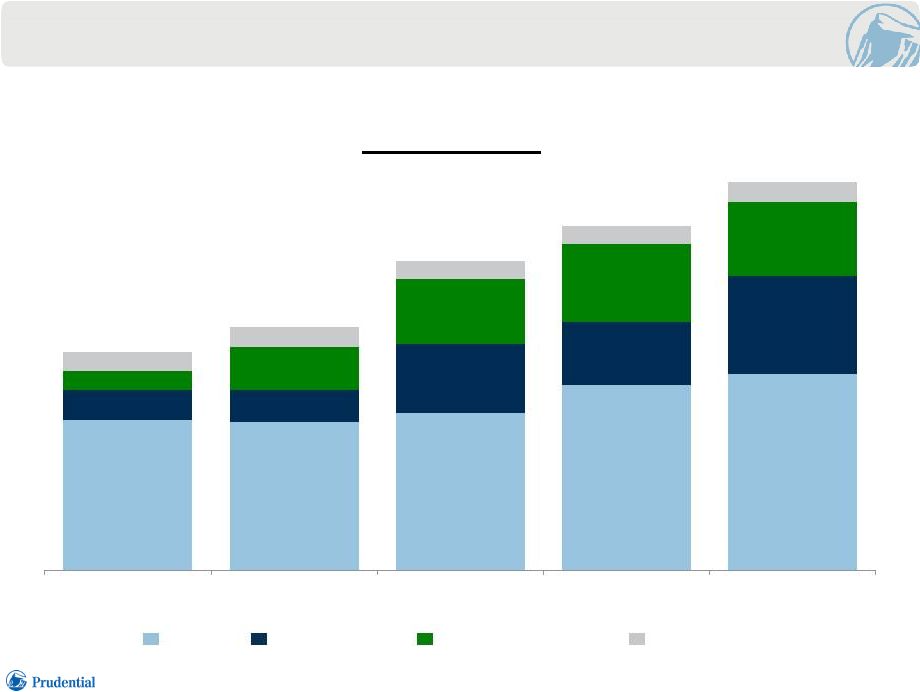
3 $205 $230 $290 $323 $364 Full Service Pension Risk Transfer Investment-Only Stable Value Other Institutional Investment Products Account Values (1) ($ billions) 1) As of end of period. Financial Strength Symposium 6.23.2015 $141 $148 $174 $184 $28 $30 $64 $59 $92 $18 $41 $61 $73 $70 $18 $19 $17 $17 $18 2010 2011 2012 2013 2014 $140 |
 SIGNIFICANT
EARNINGS
GROWTH
SINCE
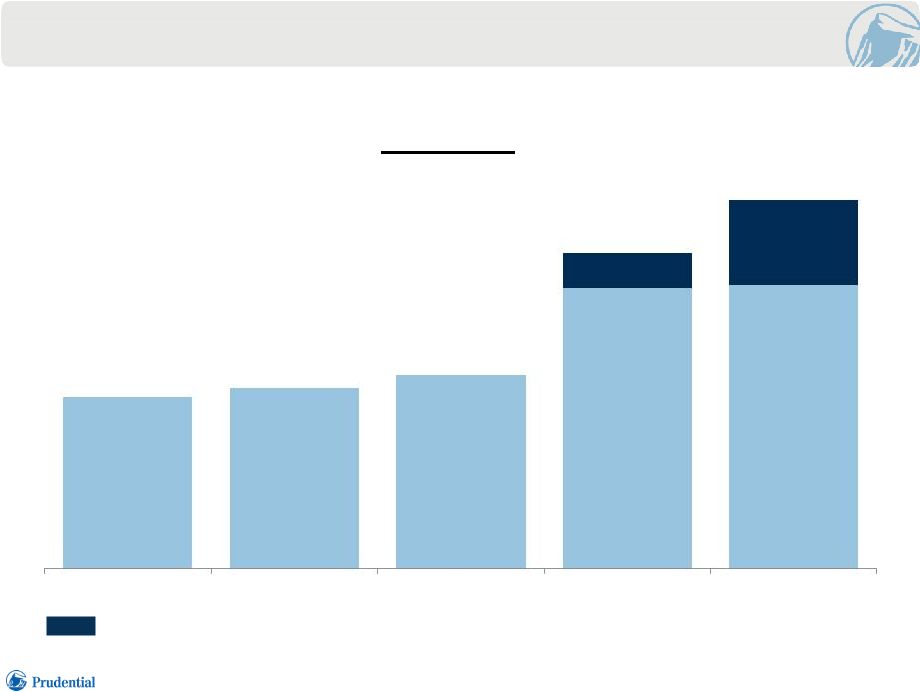
2010 4 Pre-Tax AOI (1) ($ millions) ~$110 ~$280 Non-coupon investments returns, case experience on pension risk transfer business more favorable than average expectations,
and significant mortgage loan prepayment income.
1) Adjusted Operating income (AOI). Financial Strength Symposium 6.23.2015 $565 $594 $638 $1,039 $1,215 2010 2011 2012 2013 2014 |
 PRUDENTIAL AS
A PENSION LEADER 5 Since 1928 PROVIDING INTEGRATED PENSION PLAN SERVICES 2 nd LARGEST ACTIVE INSTITUTIONAL MANAGER OF DOMESTIC FIXED INCOME (1) 23 25 LARGEST CORPORATE DB PLANS (2) USE PRUDENTIAL INVESTMENT MANAGEMENT of the 1) Pensions & Investments Top Money Manager List, May 2015. Ranked by total worldwide institutional assets under management, as of
12/31/14. 2)
Based on U.S. Plan Sponsor rankings in Pensions & Investments, as of
12/31/14. Financial Strength Symposium 6.23.2015
|
 PENSION
RISK
TRANSFER |
 PROGRESSION OF
EXPERTISE
& CAPABILITIES
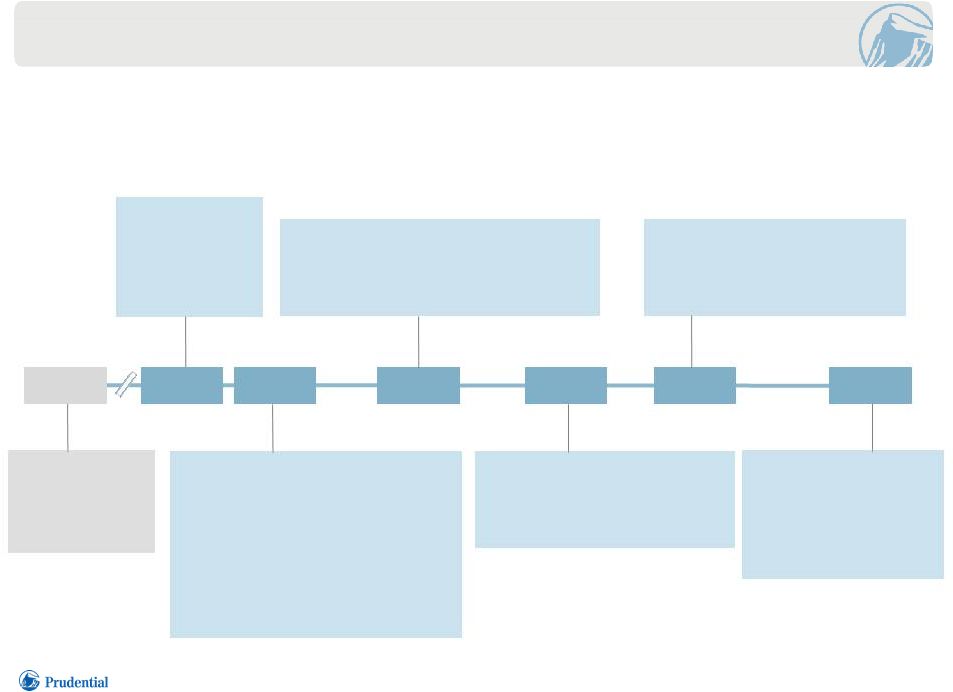
The Pension Risk Transfer team’s expertise has substantially benefited
from experience with U.K. and jumbo U.S. pension risk transfer markets.
2007 2009 2011 2012 2014 Applied U.K. longevity underwriting best practices Developed unique capabilities for GM and Verizon 7 Applied best practices further into the market resulting in key case wins Closed U.S. and U.K. transactions Large sponsor opportunities identified First pension guarantee written • Established core team • Explored emerging U.K. solutions • Adapted/modernized for U.S. market Financial Strength Symposium 6.23.2015 2006 1928 |
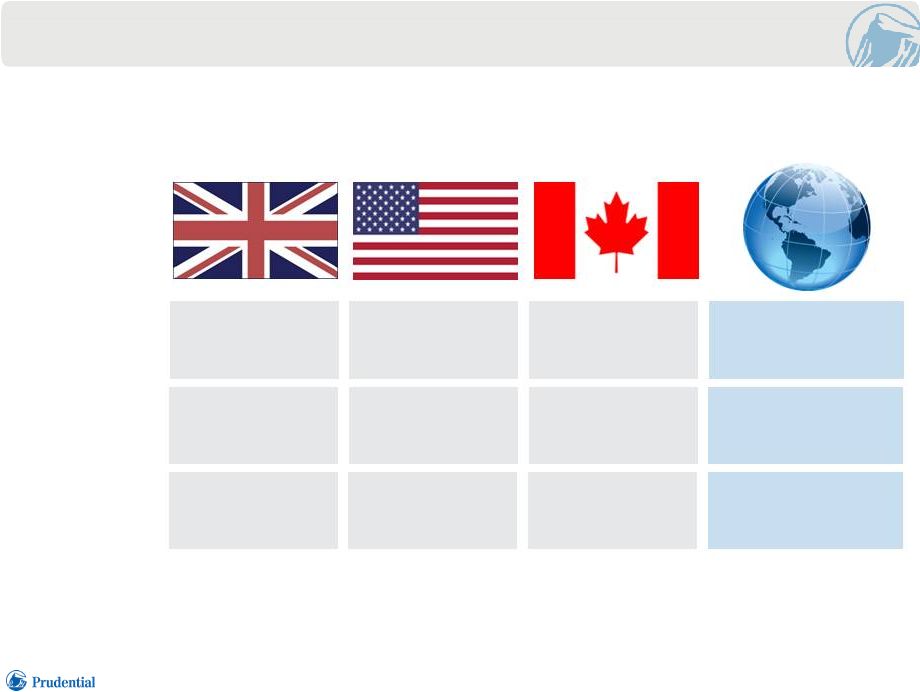 PRT MARKET IS
LARGE
AND GROWING 8 1) Pension Protection Fund, estimated in U.S. dollars, as of 12/31/14. 2) Investment Company Institute, as of 12/31/14. 3) Towers Watson Global Pension Assets Study 2015. $1.5 trillion (3) $1.9 trillion (1) $3.2 trillion (2) Pension Liabilities U.K. U.S. Canada 33 5 1 Number of Transactions Over $1 billion PRT Transactions Since 2007 $186 billion $50 billion $4 billion World 39 $240 billion >$6.6 trillion Financial Strength Symposium 6.23.2015 |
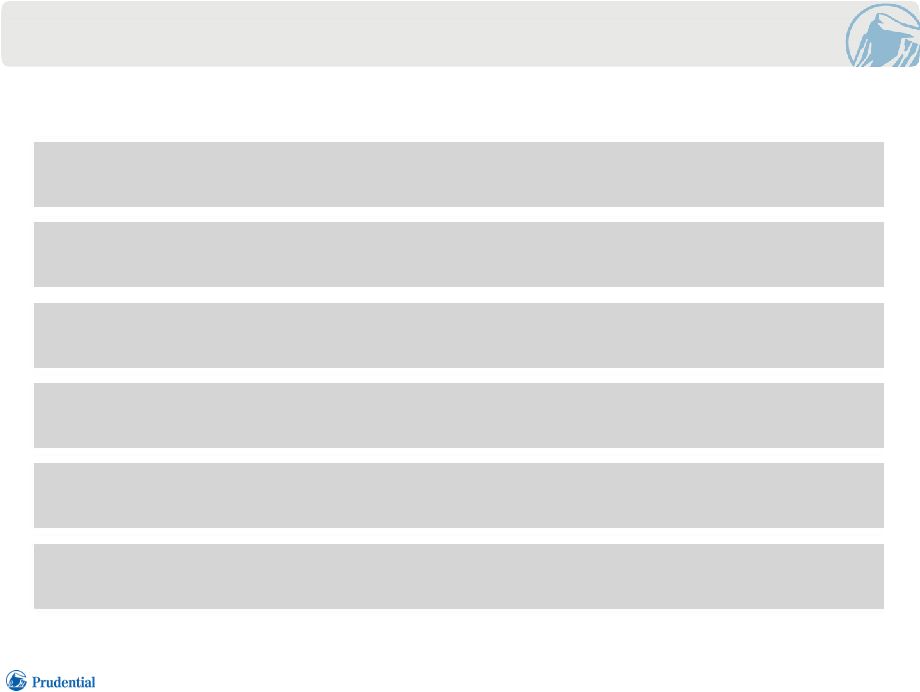 PRUDENTIAL’S COMPETITIVE ADVANTAGE IN PRT MARKET Deep Expertise Across Multiple Disciplines Proven Structuring Skills Demonstrated Service Excellence Track Record of Successful Execution Experience and Credibility in the Pension Market Financial Strength 9 Financial Strength Symposium 6.23.2015 |
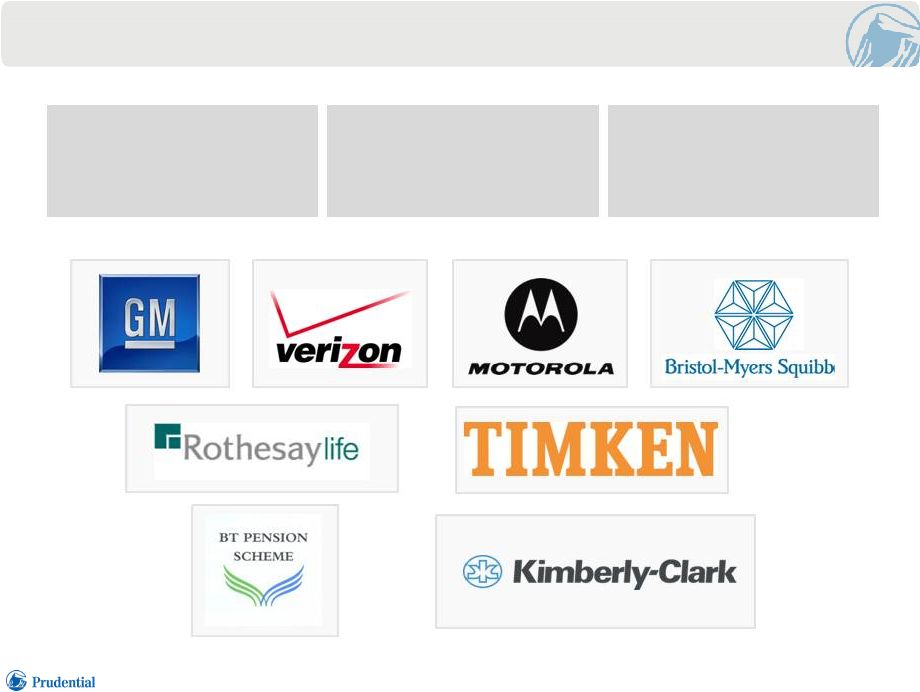 PRUDENTIAL’S PRT BUSINESS HAS EXPERIENCED SIGNIFICANT GROWTH OVER THE PAST FOUR YEARS (1) 10 $75 billion (2) PENSION LIABILITIES 550,000 RETIREES 130+ PLANS IN U.S. & U.K. 1) Through 3/31/15. 2) Includes ~$35 billion of longevity reinsurance. Financial Strength Symposium 6.23.2015 |
 PRUDENTIAL’S EDGE: CREATIVE
SOLUTIONS
11 Execution Confidence • Advanced purchase agreement • Proven documentation and process • Seamless transition, payments and personalized communications Asset • Asset in kind (AIK) transfer • Client risk hedging strategies Liability • Data adjustments • Lump sum adjustments • Tailored mortality tables Transaction Structure • Customized price roll forward • Independent fiduciary • Sponsor-owned insurer Meet Client Needs Manage Risk Financial Strength Symposium 6.23.2015 |
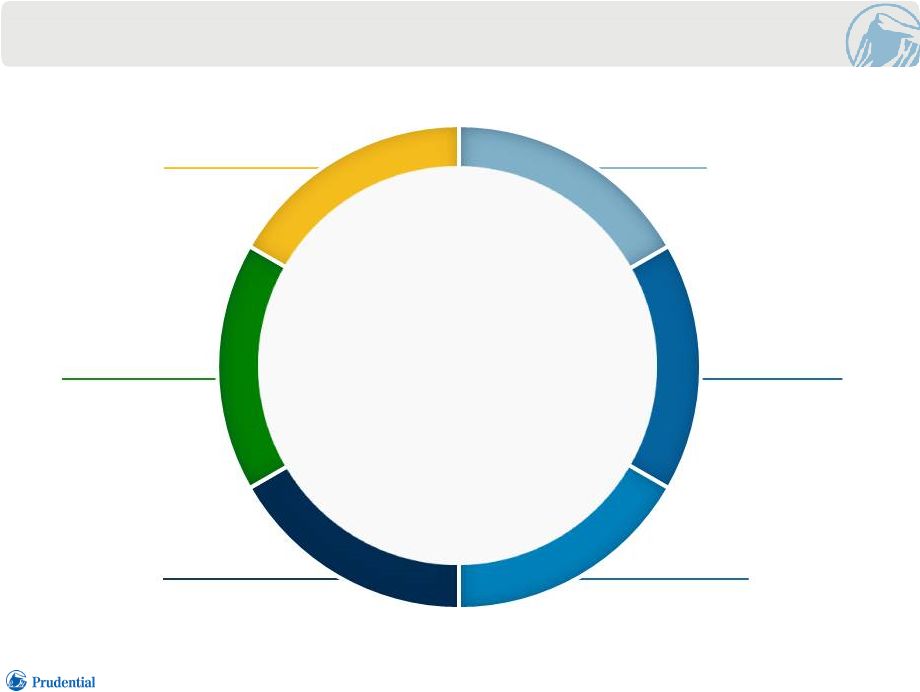 CRITICAL
SUCCESS
FACTORS,
KEY
RISKS
AND MITIGANTS Types of Risk Investment Liquidity Asset/Liability Management Insurance Concentration Pricing 12 Financial Strength Symposium 6.23.2015 |
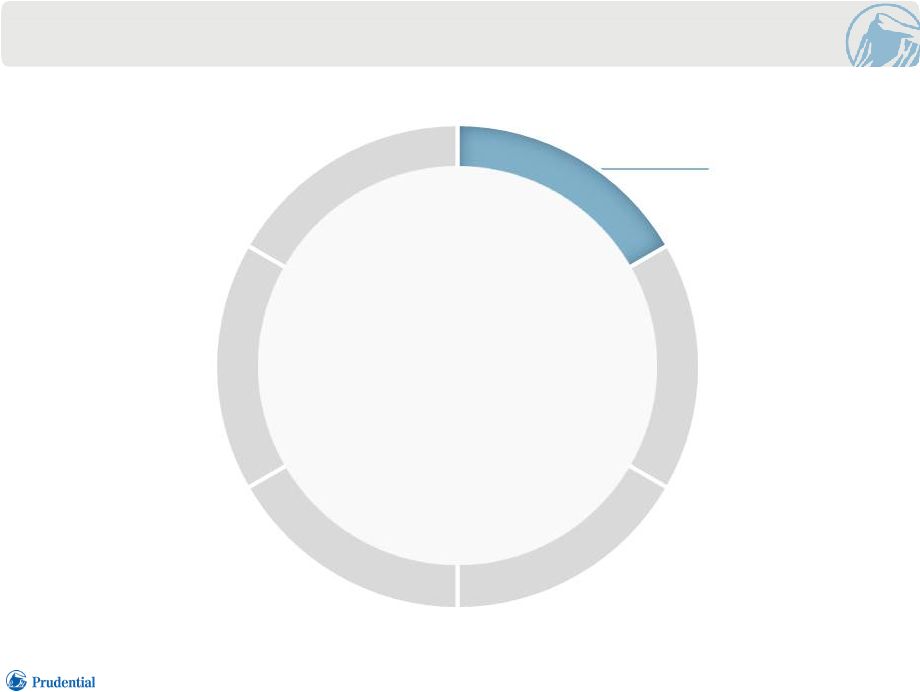 Pricing CRITICAL SUCCESS FACTORS, KEY
RISKS
AND MITIGANTS Pricing Prudent best estimates “AA” loss absorption capacity Negotiated price adjustment triggers 13 Financial Strength Symposium 6.23.2015 |
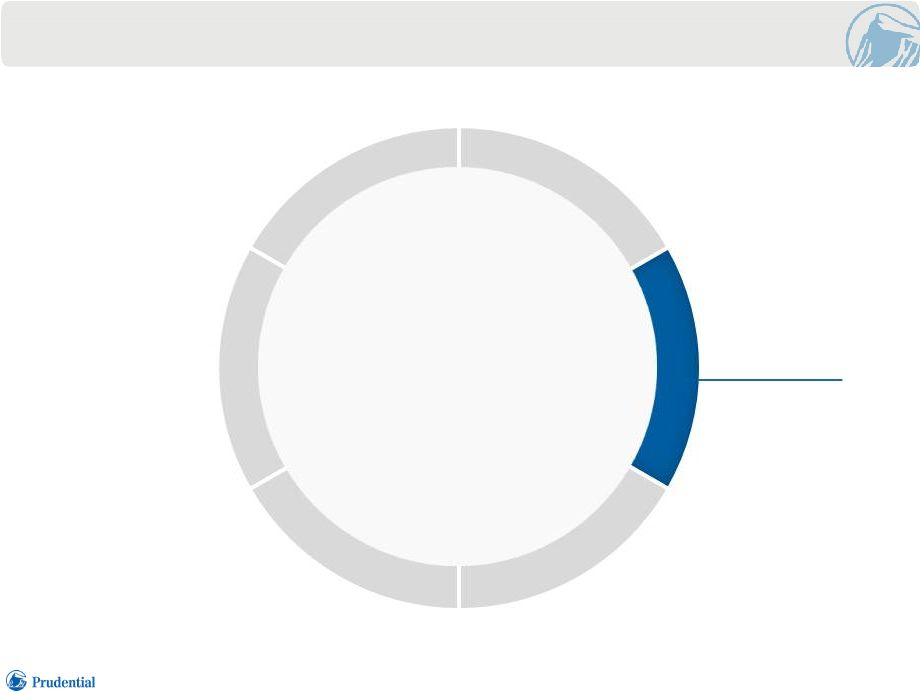 Investment CRITICAL SUCCESS FACTORS, KEY
RISKS
AND MITIGANTS Investment Primarily high quality corporate bonds Well-diversified portfolio Prudent default assumptions 14 Financial Strength Symposium 6.23.2015 |
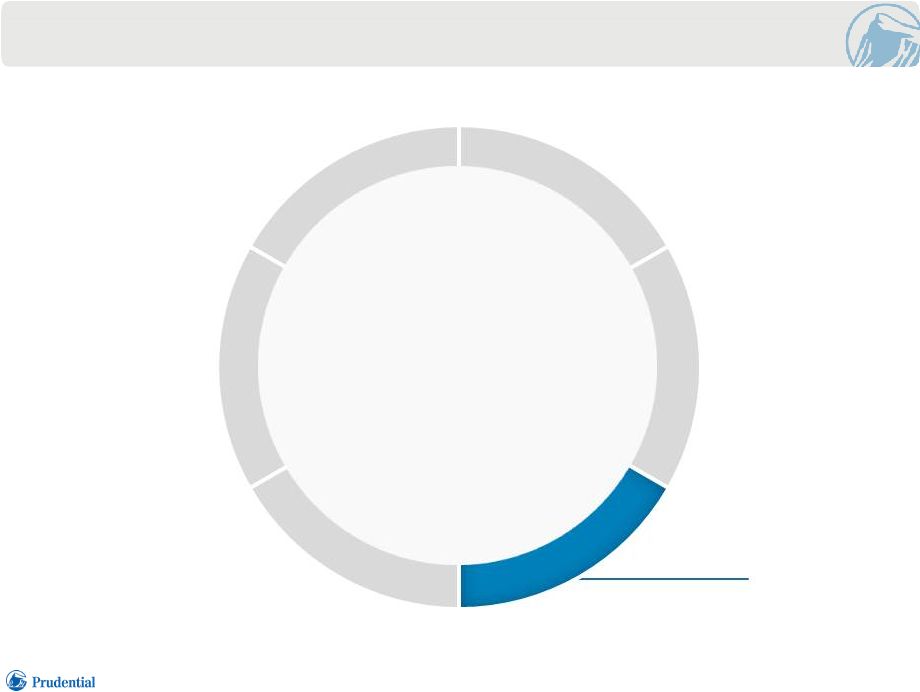 Liquidity CRITICAL SUCCESS FACTORS, KEY
RISKS
AND MITIGANTS Liquidity Long-dated, illiquid liabilities Disciplined cash flow management 15 Financial Strength Symposium 6.23.2015 |
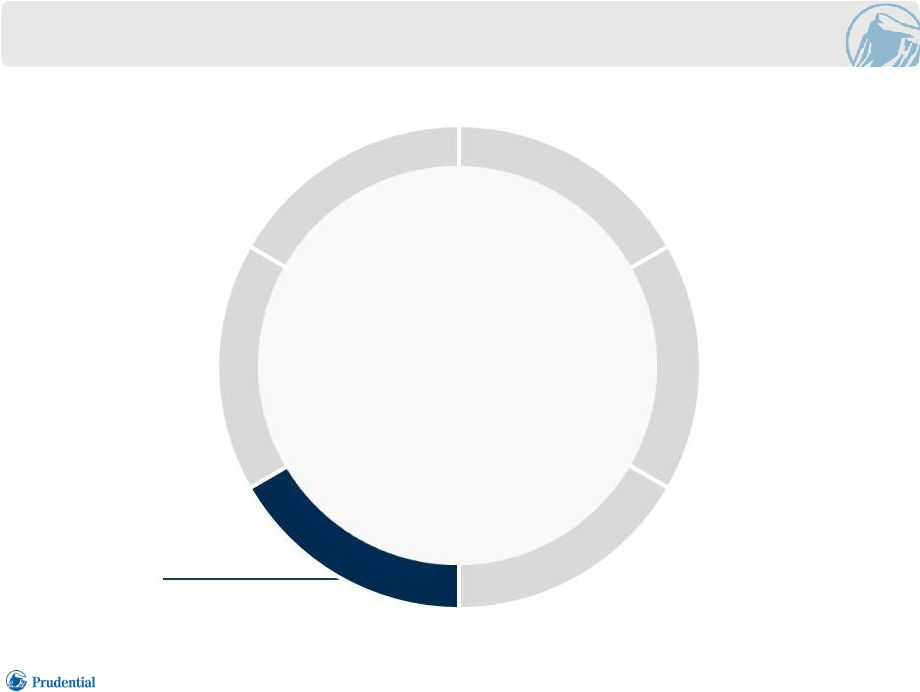 Insurance CRITICAL SUCCESS FACTORS, KEY
RISKS
AND MITIGANTS Insurance Very limited benefit optionality Significant & credible plan mortality experience 16 Financial Strength Symposium 6.23.2015 |
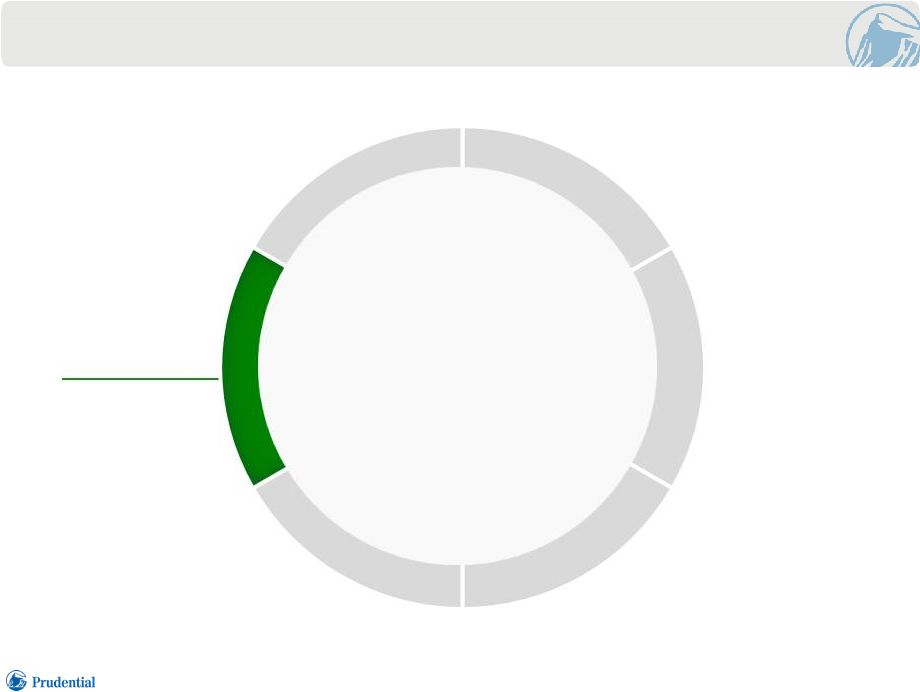 CRITICAL
SUCCESS
FACTORS,
KEY
RISKS
AND MITIGANTS Asset/Liability Management Manage within tight duration corridors Rigorous ongoing monitoring 17 Asset/Liability Management Financial Strength Symposium 6.23.2015 |
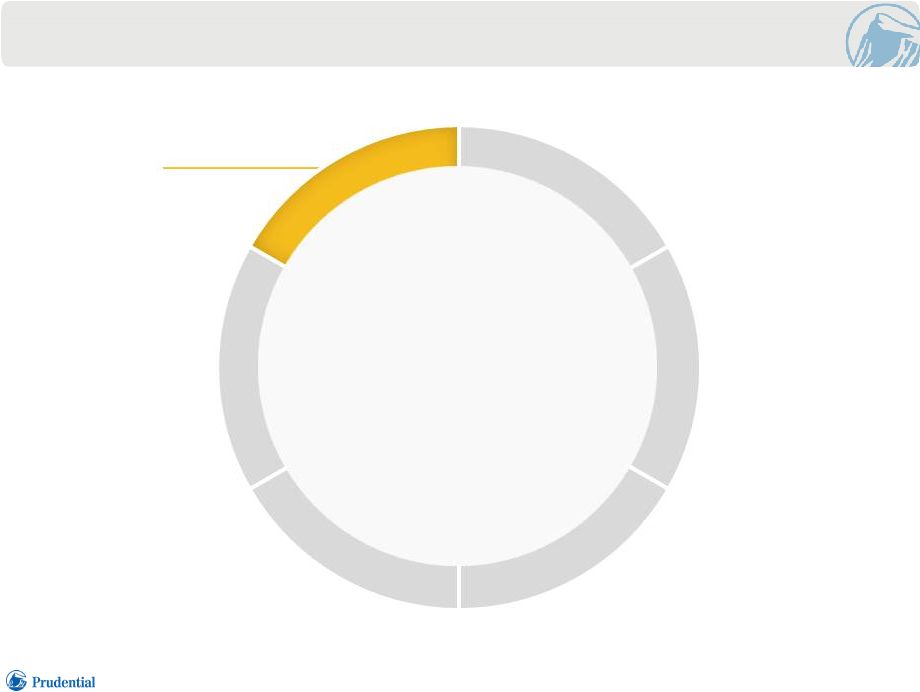 Concentration CRITICAL SUCCESS FACTORS, KEY
RISKS
AND MITIGANTS Concentration Deliberately building diversified book over time More credible experience data Better pricing: Fewer competitors & complex execution needs 18 Financial Strength Symposium 6.23.2015 |
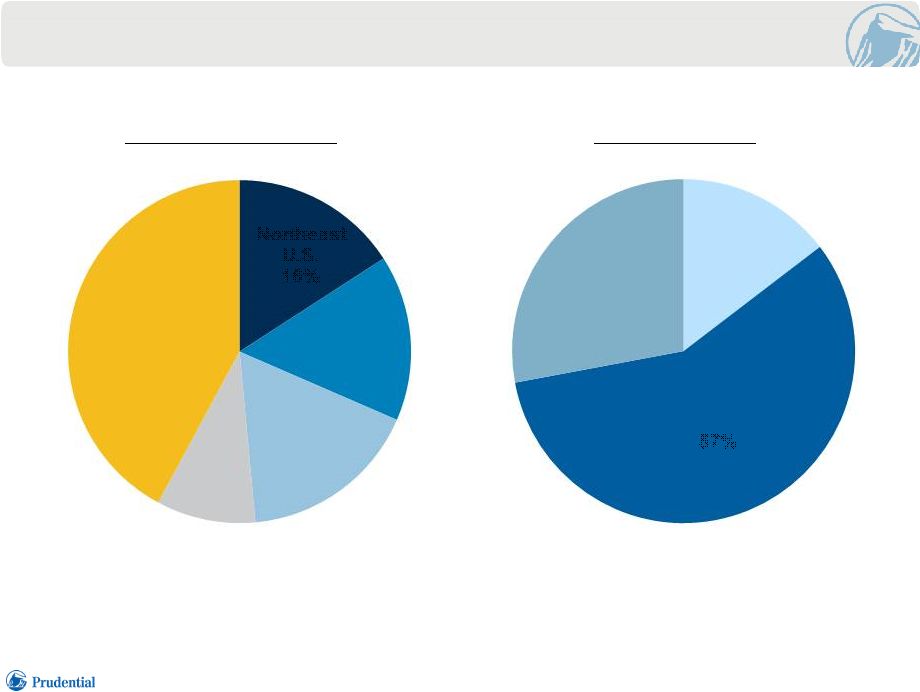 WELL-DIVERSIFIED BUSINESS MIX 19 Geographic Diversity (1) Age Distribution (1) • Also well-diversified by Gender, Industry, Benefit Size, and Occupation (blue/white collar)
• Average liability duration: Buy-Out 9-10 years, Longevity Reinsurance 8-12 years
Below 60 Above 80 60-80 1) Number of annuitants as of 3/31/15. Financial Strength Symposium 6.23.2015 Northeast U.S. 16% South U.S. 16% Midwest U.S. 17% West U.S. 9% U.K. 42% 15% 57% 28% |
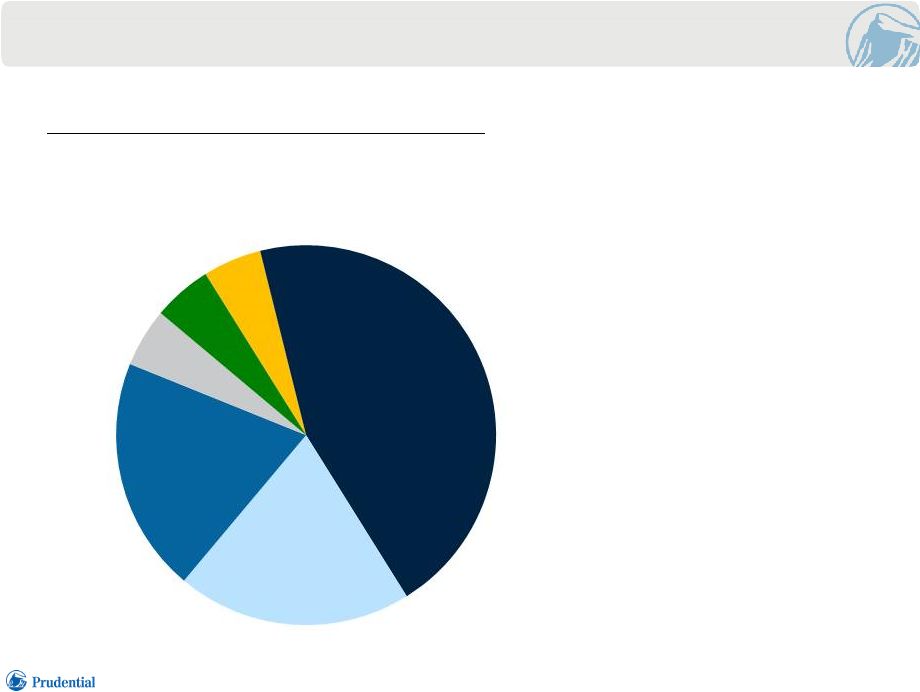 STRONG
INVESTMENT
RISK
MANAGEMENT
Representative Funded PRT Asset Portfolio
Key Attributes • High quality • Well-matched to liability • Well-diversified • Assets in-kind reduce risk and expense: – Taxes – Transaction costs – Interest rates and spreads locked in 20 Financial Strength Symposium 6.23.2015 Other (e.g. Agency Mortgage Backed Securities) Investment Grade Public Securities ~45% Investment Grade Private Securities ~20% Mortgage Loans ~20% Below Investment Grade Alternatives ~5% ~5% ~5% |
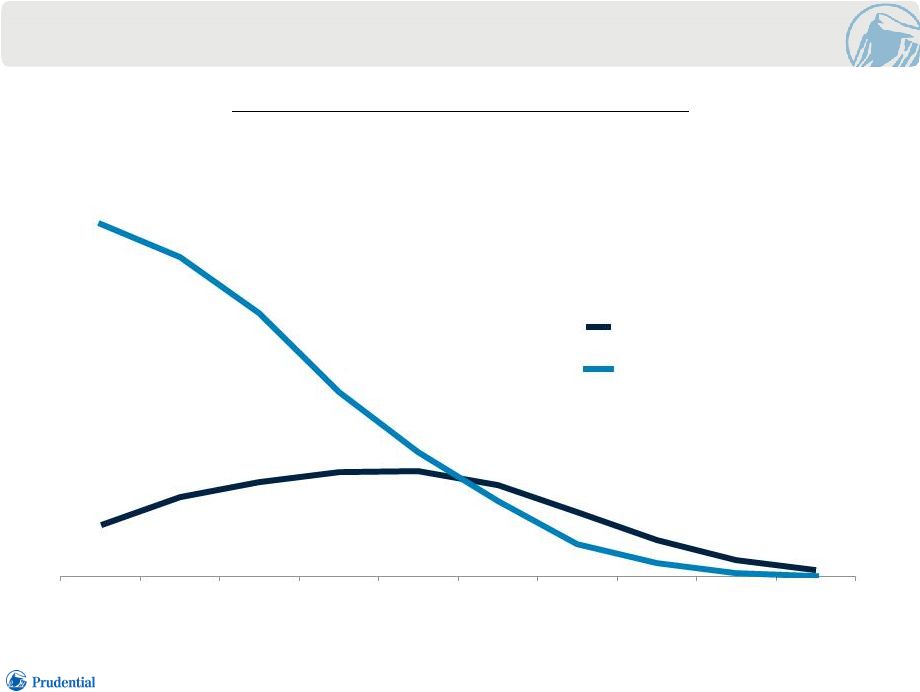 COMPLEMENTARY
PROFIT
EMERGENCE
PATTERNS
21 Projection Years Annual Expected AOI Pattern, Net of Defaults ($1 Billion Representative Case) Financial Strength Symposium 6.23.2015 1-5 6-10 11-15 16-20 21-25 26-30 31-35 36-40 41-45 46-50 Longevity Reinsurance Funded Buy -out |
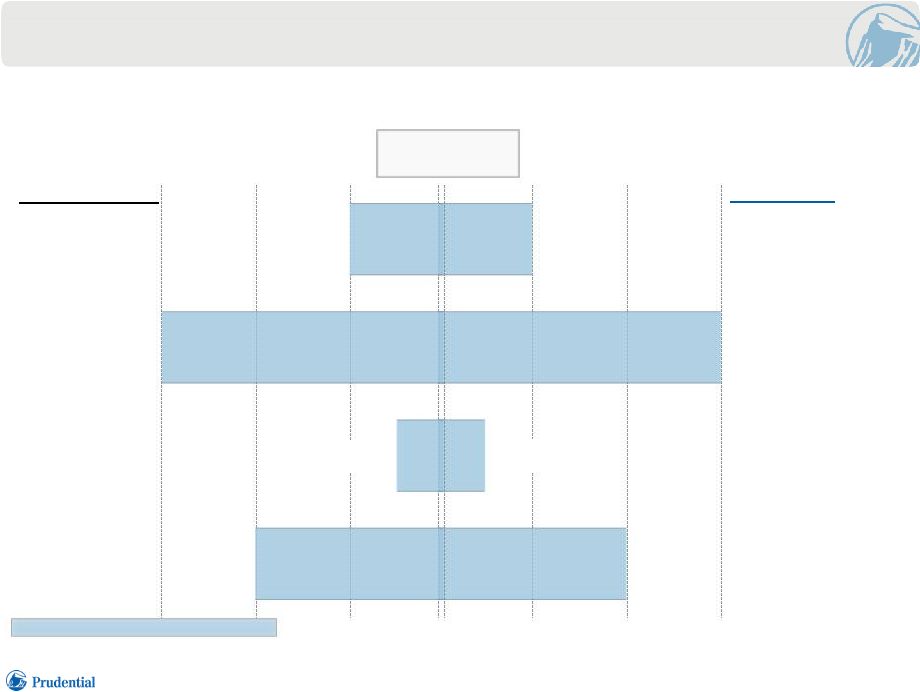 RETURN
SENSITIVITIES
(1) 22 1) Impacts are approximate. The sensitivities may vary by transaction. Sensitivities are meant to reflect a moderately adverse/beneficial
scenario. 2)
Internal rate of return (IRR).
Credible plan-specific
mortality experience data
Complementary long-
term exposures not reflected in pricing Tight key rate duration management mitigates risk Diversified, high- quality investments Base Mortality Mortality Improvement Interest Rates Credit Defaults -0.5% -2% -1% -3% +0.5% +2% +3% +1% Mortality rates +/-1% Long-term interest rates +/-100bps Default shock of 1%/lower default probability by half Mortality trend improvement +/-0.25% MITIGANTS Target IRR (2) 11-15% Capital is set at the higher of regulatory and economic frameworks; We further analyze sensitivity of returns to changes in key underwriting assumptions
-3% -2% -1% +1% +2% +3% Blue shaded area indicates shock scenario ASSUMPTIONS Financial Strength Symposium 6.23.2015 |
 PRUDENTIAL PRT:
AN
ATTRACTIVE
GROWTH
OPPORTUNITY
• Premier franchise in a very attractive market • Leverages best of Prudential – deep partnership and collaboration across business units and functions, building on nearly 140 years of mortality risk and
90 years of longevity risk experience
• Opportunity identified early; built unparalleled platform of expertise and solid
risk management over a decade
• Currently expect returns on PRT block to be at or above our targets • Ongoing growth opportunity with solid expected returns and sustainable competitive advantages • Commitment, talent & intense focus 23 Financial Strength Symposium 6.23.2015 |
 PRUDENTIAL
FINANCIAL,
INC.
ANNUITIES
ROBERT
O’DONNELL
PRESIDENT
PRUDENTIAL
ANNUITIES |
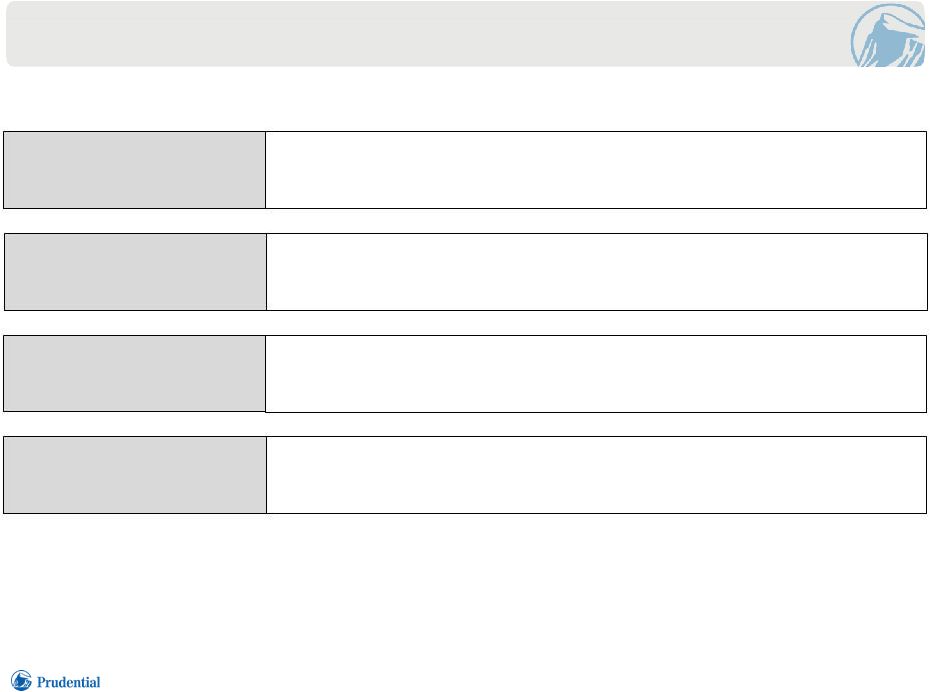 INDIVIDUAL
ANNUITIES
CONTINUES
TO BE A CORE COMPONENT OF PRUDENTIAL'S
DIVERSIFIED
BUSINESS
MIX
2 Financial Strength Symposium 6.23.2015 Product Mix Policyholder Behavior In Force Cash Flow Balance Sheet Strength Our product mix diversifies our risk profile while meeting customers’ retirement income needs Sophisticated approach using data analytics and emerging policyholder behavior experience In force expected cash flows continue to provide significant value Our living benefit liability is supported by high quality on-balance sheet assets |
 PRODUCT
MIX |
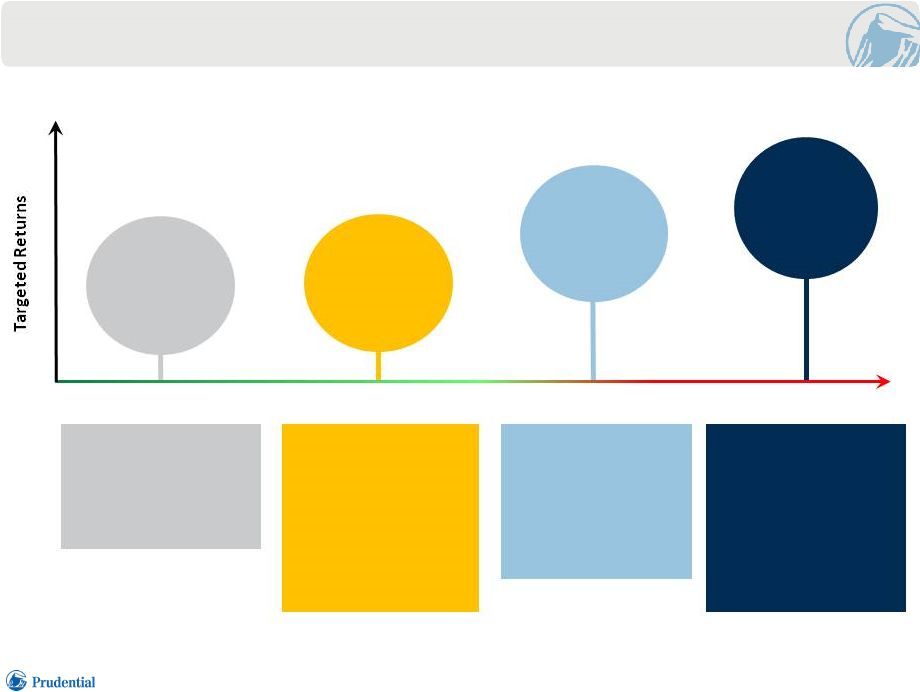 PRODUCT
PORTFOLIO
– DIVERSIFYING OUR RISK 4 High Capital Market & Behavior Risk High Low 1) Return of Premium (ROP) is a standard death benefit on variable annuity contracts. Optional ROP is available on PPI contracts for an extra
charge. 2)
For new business. Financial Strength Symposium 6.23.2015 • No living benefit • Accumulation focused • Account value death benefit / optional ROP (1) • A fixed single premium immediate annuity • Highest minimum income payments • No death benefit • Monthly rate setting capability (2) • Higher minimum income payments • No equity exposure • ROP (1) death benefit • Monthly rate setting capability (2) • Lower minimum income payments • Secure Value Account • ROP (1) / optional enhanced death benefit • Monthly rate setting capability (2) Prudential Premier Investment Variable Annuity (PPI) Prudential Immediate Income Annuity (PII) Prudential Defined Income (PDI) “Highest Daily” Suite (HDI) |
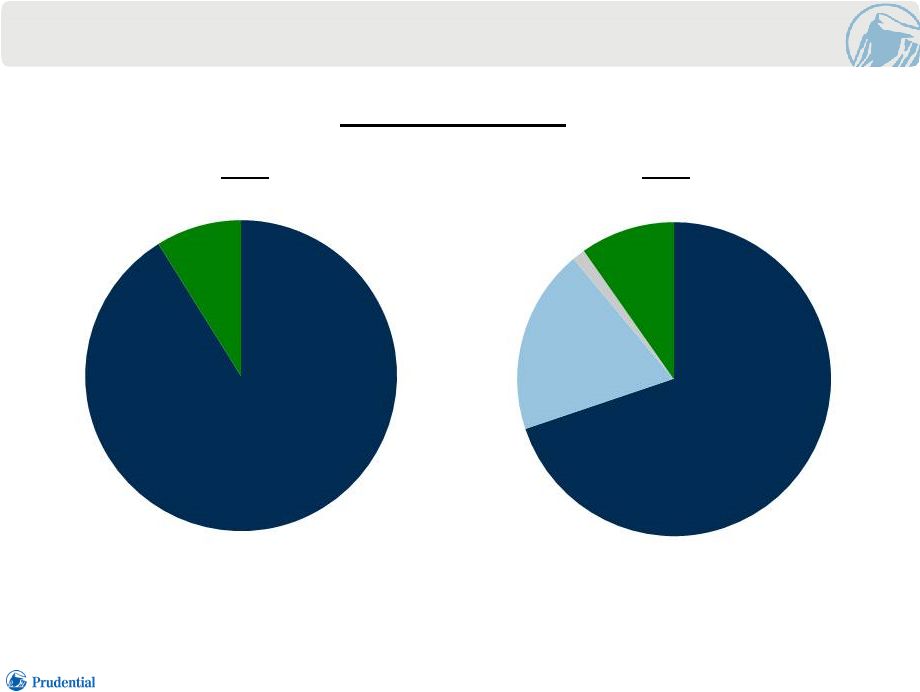 PRODUCT
DIVERSIFICATION
5 Annual Gross Sales 2012 $20.0 billion 2014 $10.0 billion 1) Includes Legacy variable annuities, fixed annuities and base contracts with no living benefit guarantees.
2015 and 2016 new business risk profile will be impacted by our HDI 3.0 reinsurance
transaction (1)
(1) Financial Strength Symposium 6.23.2015 HDI 91% PPI 1% HDI 70% PDI 19% Other 9% Other 10% |
 EXTERNAL
REINSURANCE
AGREEMENT
Prudential Annuities has entered into a new business reinsurance
transaction with Union Hamilton
• Transaction covers the HDI 3.0 living benefit rider • Covers approximately 50% of new business written in 2015 and 2016 • Reduces growth of exposure to new contracts with living benefits • Accelerates the diversification strategy 6 Financial Strength Symposium 6.23.2015 |
 PRUDENTIAL
FINANCIAL,
INC.
ANNUITIES
YANELA
FRIAS
VICE
PRESIDENT,
FINANCE
PRUDENTIAL
ANNUITIES |
 POLICYHOLDER
BEHAVIOR |
 SOPHISTICATED
APPROACH
USING DATA ANALYTICS AND EMERGING POLICYHOLDER BEHAVIOR EXPERIENCE • Partnered with industry leaders to create enhanced data analytic capabilities • These enhanced capabilities drive a more thorough understanding of factors influencing policyholder behavior and improve our ability to interpret emerging trends in our data • Data analytic capabilities were leveraged to refine our annual assumption setting process 9 Financial Strength Symposium 6.23.2015 |
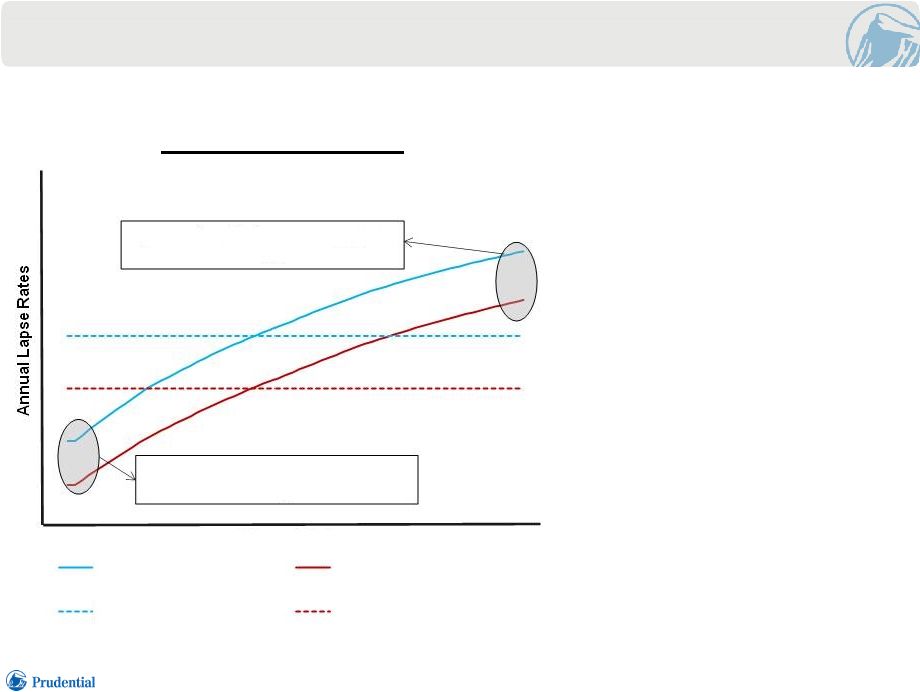 DATA
ANALYTICS
DROVE
INCREASED
SOPHISTICATION
OF GLWB (1) LAPSE RATE ASSUMPTIONS • Traditional “In-the- Moneyness” remains a key driver of lapses • Lapse rates now incorporate the impact of interest rates on alternative income solutions • The relative value of a policy’s guarantee to current market options influences lapse behavior GLWB LAPSE RATES 1) Guaranteed Lifetime Withdrawal Benefit. High 10 Financial Strength Symposium 6.23.2015 Interest Rates Lower fees in favorable market paths High Low Higher claims in unfavorable market paths "At the Money" Policy 20% "In the Money" Policy Prior "At the Money" Policy Prior 20% "In the Money" Policy |
 IN
FORCE
CASH
FLOW
ANALYSIS |
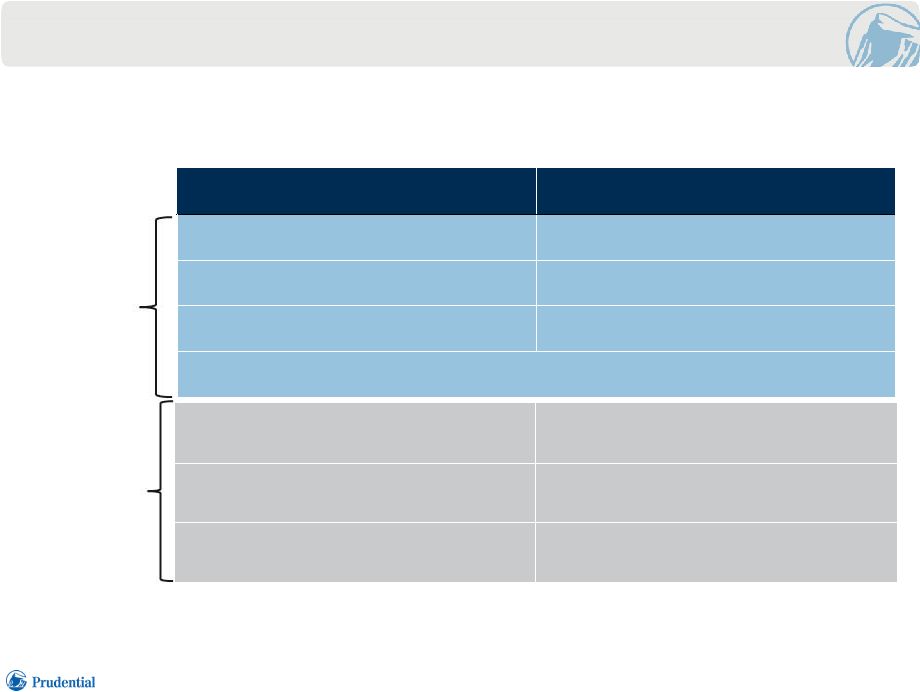 PROFILE OF
BASELINE
ASSUMPTIONS
FOR IN FORCE CONTRACTS 1) Based on GAAP best estimates as of 12/31/14. 2) Return includes 2% dividend yield. 3) Policyholder behavior assumptions for guaranteed lifetime withdrawal benefit products only.
Capital Markets Policyholder Behavior (3) Assumptions underlying cash flows reflect our current best estimates Baseline Assumptions (1) Equity Market Return (2) 3.5% increasing to 8.0% by year 6 Fixed Income Return 1.8% grading to 5.5% by year 10 Blended Return 2.9% grading to 6.6% by year 10 Cash Flows assume Living Benefit Liability is fully hedged Dynamic Lapse Assumption Lapse rates based upon in-the- moneyness and level of interest rates Benefit Utilization 95% take lifetime withdrawals Benefit Efficiency 86% of guaranteed amount 12 Financial Strength Symposium 6.23.2015 |
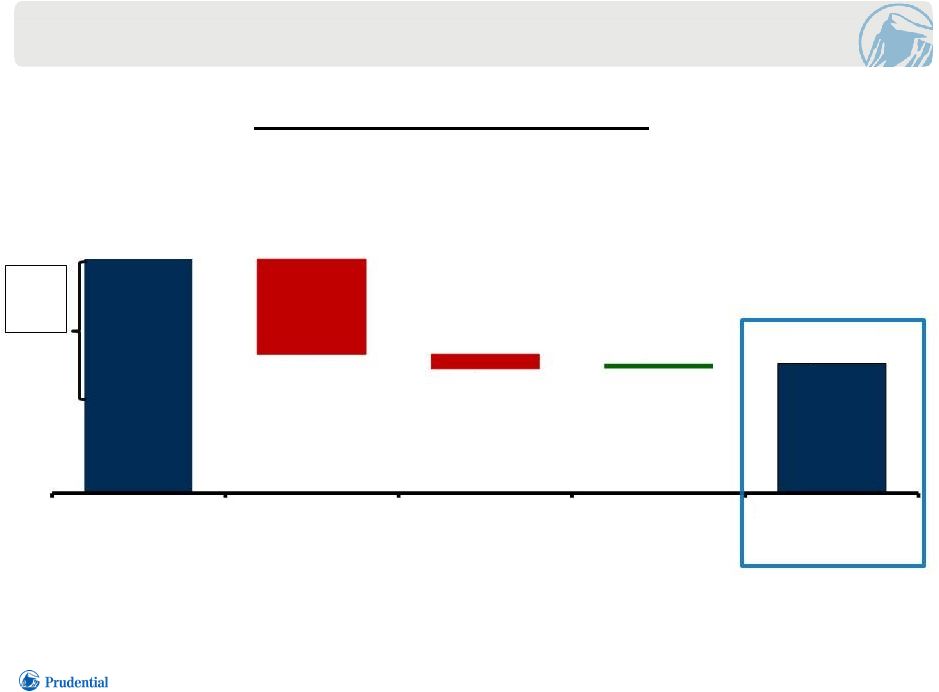 IN
FORCE
CASH
FLOWS
REMAIN
STRONG
1) Reflects total remaining contract cash flows based upon the in force book of business and initial interest rates as of 12/31/14. Excludes any benefit from release of capital and excess reserves. 2) Cash flows are shown on a present value (PV) basis, are discounted at the forward curve, and reflect the results of hedging
activity. BASELINE
SCENARIO
CASH
FLOWS
(1)(2) ($ billions) 13 Financial Strength Symposium 6.23.2015 Living Benefit Fees $14.8 $17.9 $32.2 $0.7 ($13.1) ($1.9) Fees, Net of Expenses Hedging Costs Benefits, Net of Hedging Recoveries Investment Income PV of Contract Cash Flows |
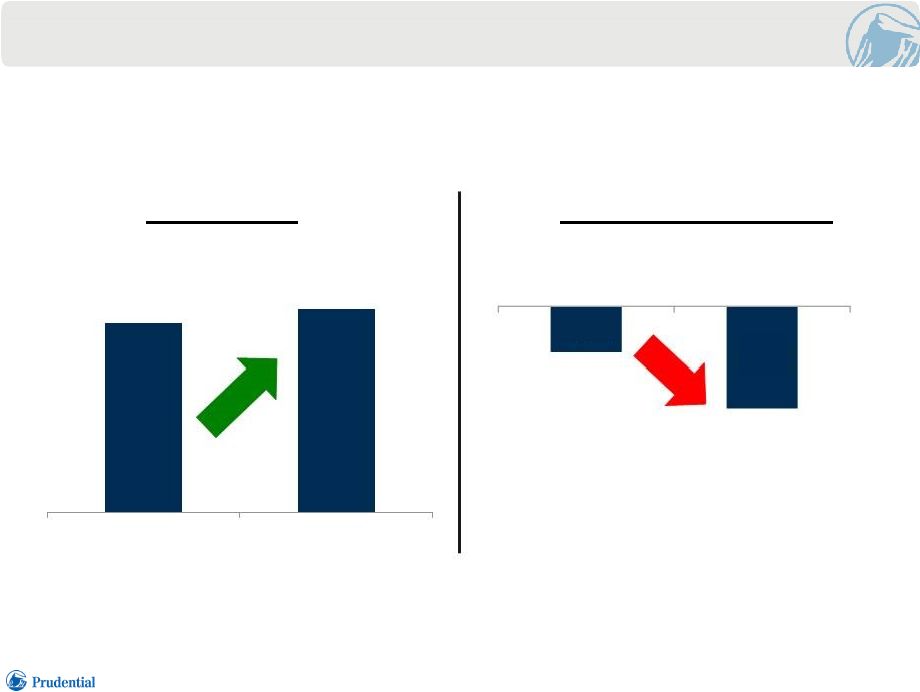 THE
INCREASED
ECONOMIC
VALUE
OF THE IN FORCE IS NOT REFLECTED IN THE GAAP LIABILITY The risk neutral nature of the assumptions used to derive the FAS 133/157 (1) reserve drive a meaningful disparity between the change in the economic cash flows and the GAAP liability
GROSS
GAAP LIABILITY CASH FLOWS (2) 1) Reserves for variable annuity living benefits are accounted for as embedded derivatives under U.S. GAAP.
2) Present value of expected cash flows in baseline scenario. 3) Includes Post NPR living benefit and SOP03-1 Reserve. ($ billions) ($ billions) 14 Financial Strength Symposium 6.23.2015 2012 2014 $16.6 $17.9 2012 2014 ($4.0) ($8.8) (3) |
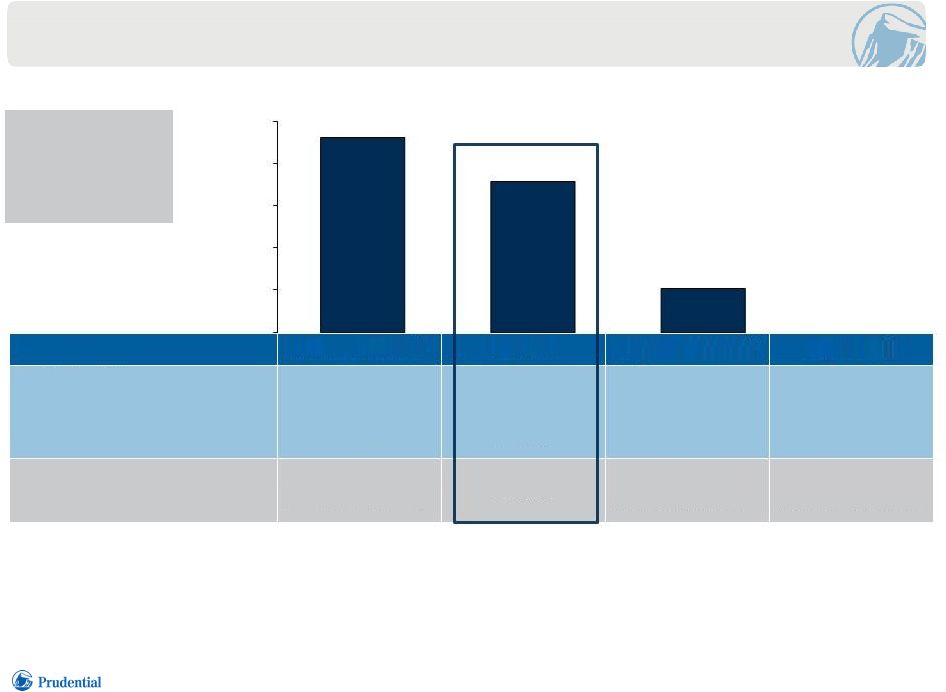 IN A
RANGE
OF CAPITAL MARKET SCENARIOS, THE
IN
FORCE
BOOK
PRODUCES
POSITIVE
CASH
FLOWS
1) Reflects total contract cash flows based upon the in force book of business and initial interest rates as of 12/31/14. Excludes any benefit from
release of capital and excess reserves. Each scenario reflects impact of
our dynamic lapse assumptions on policyholder behavior. 2)
Cash flows are shown on a present value basis, are discounted at the forward curve, and
reflect the results of hedging activity. 3)
Scenario reflects an immediate up shock of 30% on 12/31/14, followed by baseline equity
market returns thereafter with fixed income returns 100 bps above the
expected long term rate.
4) Scenario reflects an immediate down shock of 30% on 12/31/14, followed by baseline equity returns, coupled with a 100 bps decline in fixed income
returns over year 1. 5)
Scenario reflects annual equity return of -13% including dividend yield.
($ billions) 15 Financial Strength Symposium 6.23.2015 Positive Markets (3) Baseline Negative Markets (4) Break Even (5) Equity Markets Immediate Shock +30% n/a -30% n/a Post-shock Annual Equity Returns Baseline Baseline Baseline -13% annually Fixed Income Long Term Assumption +100 bps Baseline Year End -100 bps over year 1; flat thereafter Year End -100 bps over year 1; flat thereafter $23.1 $17.9 $5.2 $0.0 PV OF TOTAL CONTRACT CASH FLOWS (1)(2) |
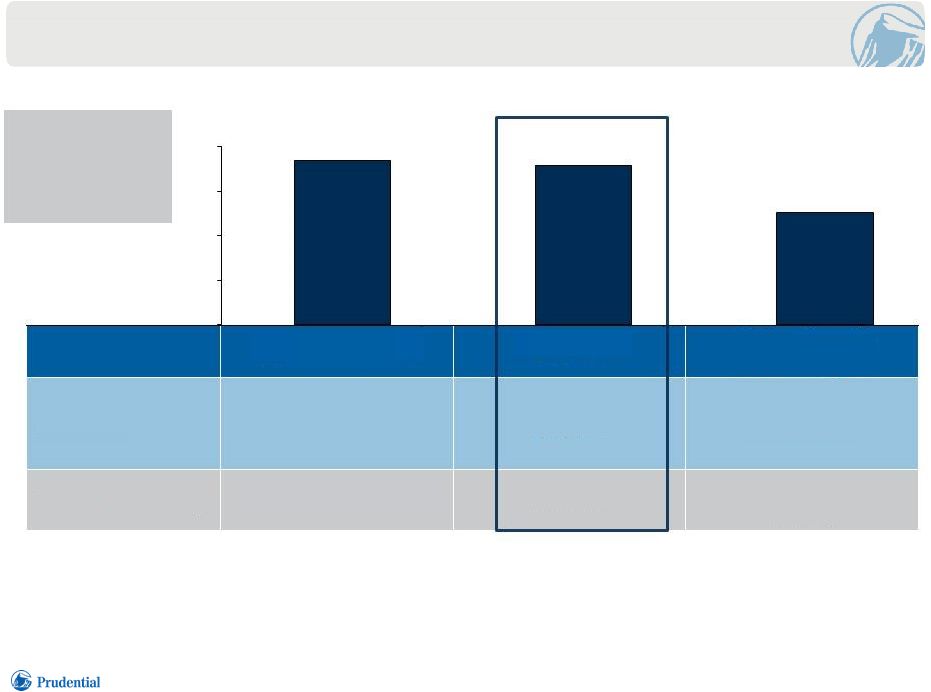 STRONG
CASH
FLOWS
EVEN
IF POLICYHOLDER BEHAVIOR DEVIATES FROM EXPECTATIONS 1) Reflects total contract cash flows based upon the in force book of business and initial interest rates as of 12/31/14. Excludes any benefit from
release of capital and excess reserves. Each scenario reflects impact of
our dynamic lapse assumptions on policyholder behavior. 2)
Cash flows are shown on a present value basis, are discounted at the forward curve, and
reflect the results of hedging activity. 3)
Capital market and benefit utilization assumptions are unchanged relative to the
baseline scenario. 4)
Scenario reflects an increase in benefit efficiency from 86% to 95% across all periods.
Capital market and benefit utilization assumptions are unchanged relative to the baseline scenario. ($ billions) 16 Financial Strength Symposium 6.23.2015 Lower Lapses (3) Baseline Higher Benefit Efficiency (4) Lapses All periods reduced by 20% Baseline Baseline Benefit Efficiency Baseline Baseline 95% of guaranteed amount $18.5 $17.9 $12.6 PV OF TOTAL CONTRACT CASH FLOWS (1)(2) |
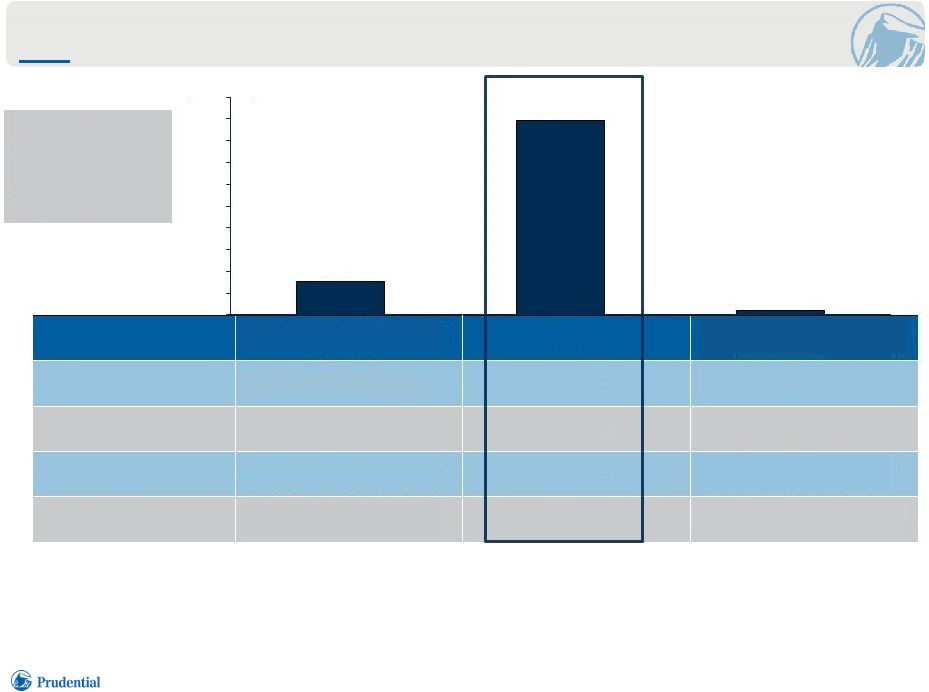 RESILIENT
CASH
FLOWS
DESPITE
SEVERELY
ADVERSE
MARKETS
AND POLICYHOLDER BEHAVIOR STRESSES 1) Reflects total contract cash flows based upon the in force book of business and initial interest rates as of 12/31/14. Excludes any benefit from
release of capital and excess reserves. Each scenario reflects impact of
our dynamic lapse assumptions on policyholder behavior. 2)
Cash flows are shown on a present value basis, are discounted at the forward curve, and
reflect the results of hedging activity. 3)
Benefit utilization assumptions are unchanged relative to the baseline scenario.
4) Scenario reflects an increase in benefit efficiency from 86% to 95% across all periods. Benefit utilization assumptions are unchanged relative to
the baseline scenario. ($
billions) 17 Financial Strength Symposium 6.23.2015 Lower Lapses and Negative Markets (3) Baseline Higher Benefit Efficiency and Negative Markets (4) Lapses All periods reduced by 20% Baseline Baseline Benefit Efficiency Baseline Baseline 95% of guaranteed amount Equity Markets Immediate -30% equity shock Baseline markets thereafter Baseline Immediate -30% equity shock Baseline markets thereafter Fixed Income Year End -100 bps over year
1; flat thereafter Baseline Year End -100 bps over year 1;
flat thereafter PV OF TOTAL CONTRACT CASH FLOWS (1)(2) $3.1 $17.9 $0.4 |
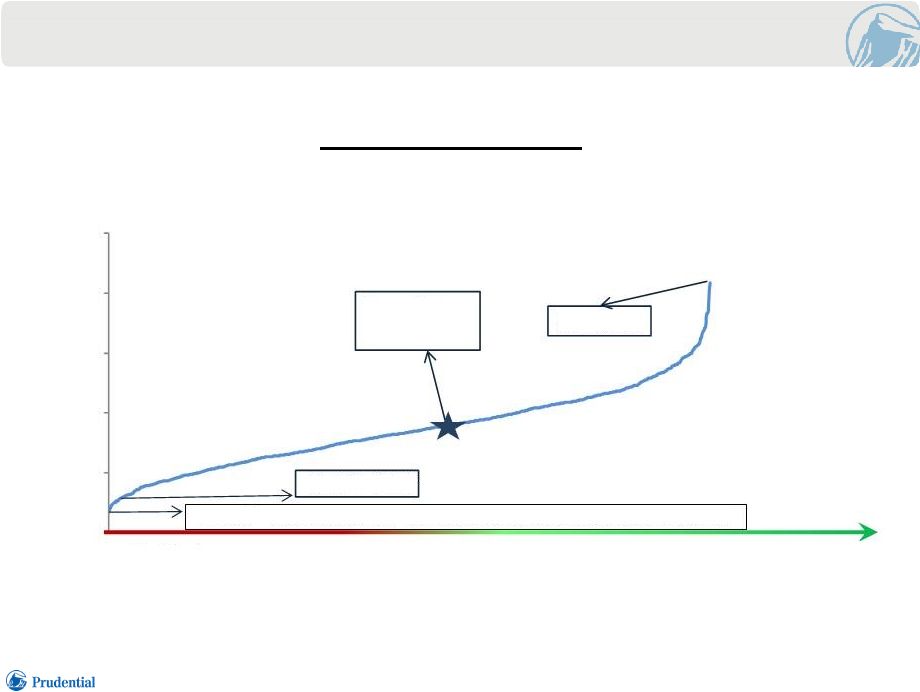 CASH
FLOWS
REMAIN
POSITIVE
ACROSS
ALL
OF THE STOCHASTICALLY MODELED PATHS High PV of Cash Flows Scenario Stochastic Cash Flows (1) ($ billions) 1) Reflects capital market shocks only. 2) Represents average outcome of 30 most unfavorable scenarios out of 1,000 projected capital market paths.
3) This scenario includes cumulative equity market returns of -38% over 5 years and -8% over 10 years in addition to an average 10-year
treasury rate of 1.93% over 10 years, including a low of
0.97%. 18
(2) Financial Strength Symposium 6.23.2015 $50.0 Low PV of Cash Flows Scenario $0.0 $10.0 $20.0 $30.0 $40.0 Max=$41.8 Mean Cash Flows= $17.1 CTE 97= $5.2 Min=$3.3 (3) Equity market decline of ~45% coupled with the 10 year Treasury rate falling below 1% |
 BALANCE
SHEET
STRENGTH |
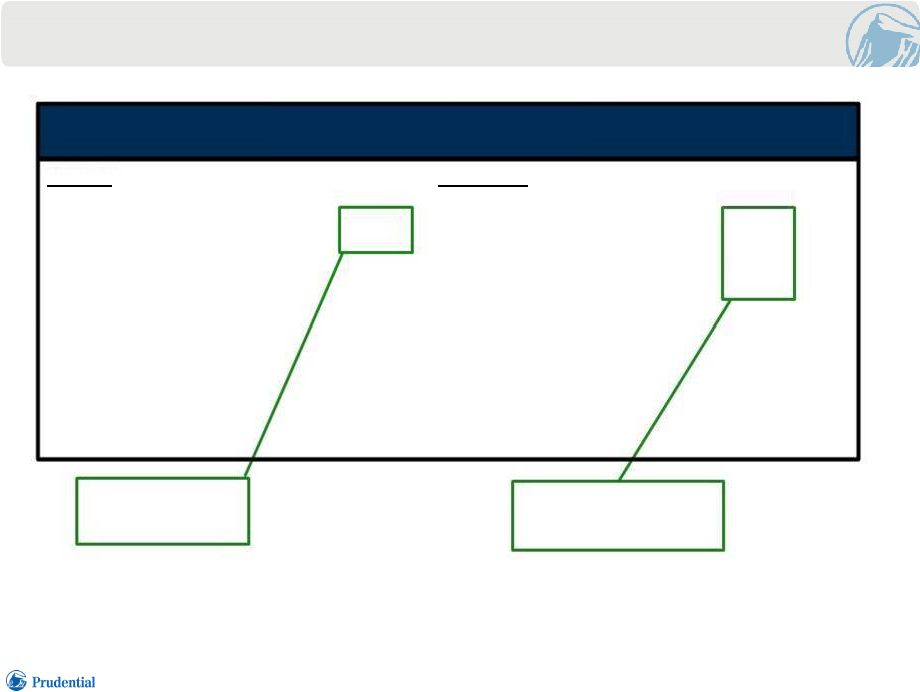 GAAP BALANCE
SHEET
- ANNUITY FOOTPRINT (1) 1) Includes fixed annuities. 2) Hedge Target Liability is a modified GAAP measure of our living benefit liability; differences between the Hedge Target Liability and the GAAP
Liability are included in Other Liabilities. Includes living benefits
reinsured to captive and risk retained in direct writing entities.
3) Refers to Guaranteed Minimum Death and Income Benefit Reserves. 4) Accumulated Other Comprehensive Income. 5) Includes approximately ~$3.6 billion of equity attributable to Pruco Re. 20 Financial Strength Symposium 6.23.2015 Assets Liabilities Separate Account Separate Account $143.7 Invested Assets General Account Hedge Assets Hedge Target Liability (2) Other Other DAC, DSI & VOBA SOP 03-1 (GMDB/GMIB) (3) Total Assets Total Liabilities $165.8 AOCI (4) $0.3 Other Attributed Equity (5) $8.7 Total Equity $9.0 $ 8.7 $ 8.7 $ 3.9 $ 0.8 ~$22 billion of long term liabilities ~$24 billion of liquid assets Balance Sheet 12/31/2014 ($ billions) $ 17.9 $ 5.7 $ 0.6 $ 6.9 $143.7 $174.8 |
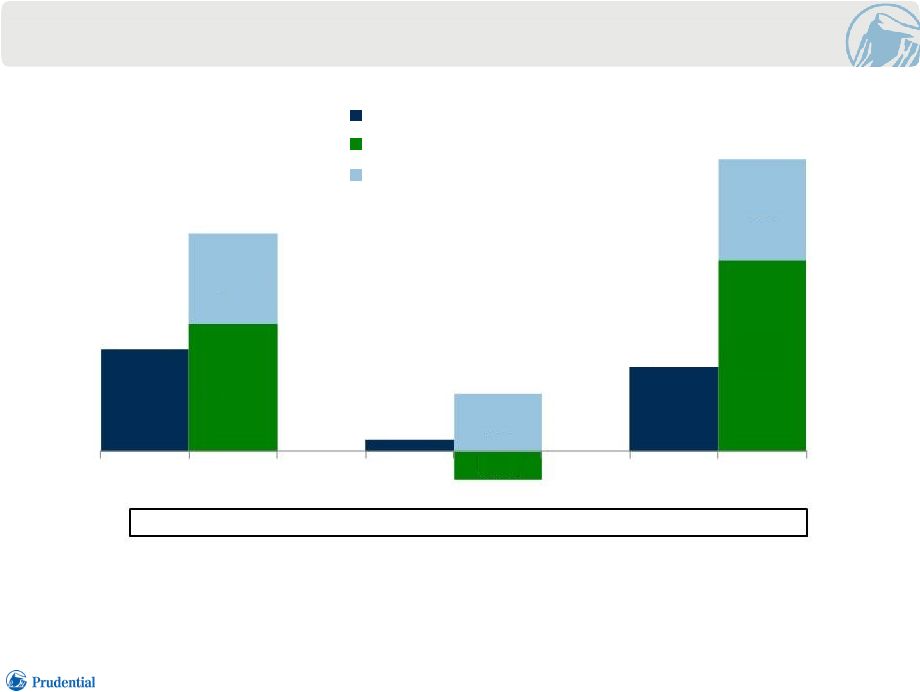 CLAIM
ABSORPTION
RESOURCES
IN VA CAPTIVE EXCEED STATUTORY RESERVE CREDIT (1)(2) 1.78%
3.04%
2.17%
1) As of December 31. 2) Claim absorption resources represent total assets available to pay claims. 3) Represents the risk associated with the living benefits reinsured to the captive.
4) Other primarily represents Asset Adequacy Testing (AAT) reserves. 10 yr. Treasury (1) $9.1 $2.4 $12.2 ($ billions) Reserve Credit Capital and Other (4) Hedge Target Liability (3) 21 Financial Strength Symposium 6.23.2015 2012 2013 2014 $4.3 $0.5 $3.5 $3.8 $5.3 $3.6 $(1.2) $4.2 $8.0 |
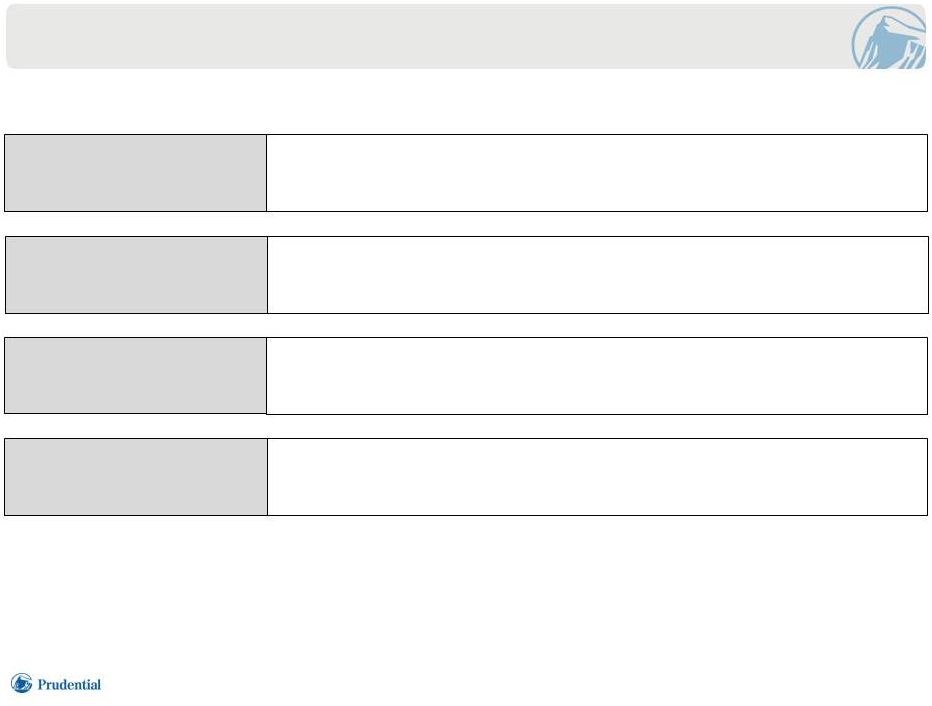 INDIVIDUAL
ANNUITIES
CONTINUES
TO BE A CORE COMPONENT OF PRUDENTIAL'S
DIVERSIFIED
BUSINESS
MIX
Product Mix Our product mix diversifies our risk profile while meeting customers’ retirement income needs Policyholder Behavior In Force Cash Flow Balance Sheet Strength Sophisticated approach using data analytics and emerging policyholder behavior experience In force expected cash flows continue to provide significant value Our living benefit liability is supported by high quality on-balance sheet assets 22 Financial Strength Symposium 6.23.2015 |
 PRUDENTIAL
FINANCIAL,
INC.
INVESTMENT
PORTFOLIO
SCOTT
SLEYSTER
SENIOR
VICE
PRESIDENT
CHIEF
INVESTMENT
OFFICER |
 WHAT
DIFFERENTIATES
PRUDENTIAL?
2 1) Assets managed by Investment Management and Advisory Services as of 3/31/15. • Liability driven • Well-diversified by: – Asset Class – Industry Sector – Geographic Region – Issuer – Maturity • Key Rate Duration (KRD) targets by sector High Quality Well-Matched Portfolio • Asset Management is a business within Prudential • $962 billion managed (1) • Best in class Privates and Mortgages • Dedicated teams allow us to underwrite much of our credit exposure – a competitive advantage • Portfolio Managers work closely with the businesses to gain deep understanding of product liabilities • Portfolio Managers located within business units Distinct Asset- Liability Management Team Investment Management is a Core Competency Financial Strength Symposium 6.23.2015 |
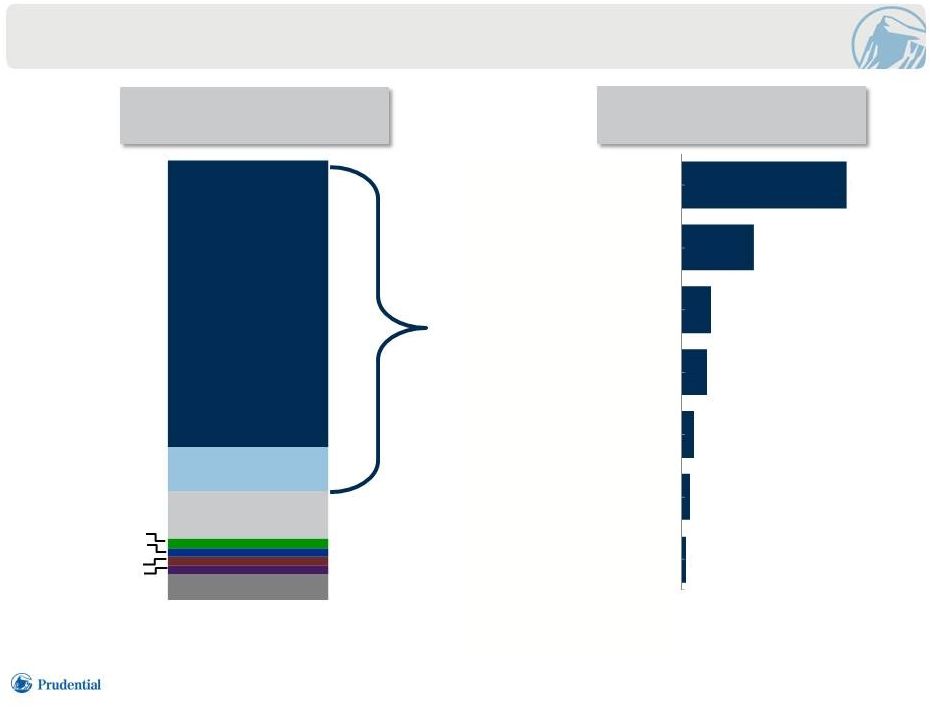 HIGH
QUALITY
AND BROADLY DIVERSIFIED PORTFOLIO 3 1) Represents the General Account (GA) for Prudential Financial, Inc. (PFI) excluding the Closed Block Division (CBD).
2) As of 3/31/15 at balance sheet carrying amount. 3) Real estate and non-real estate related investments in JVs/partnerships, investment real estate held through direct ownership and other
miscellaneous investments. 4)
Trading Account Assets Supporting Insurance Liabilities (investment results expected to
ultimately accrue to contract holders). 5)
Includes state and municipal securities, and securities related to the Build America
Bonds program. Equities, 2%
Other Long-Term (3) , 2% Short-Term & Other, 2% Policy Loans, 2% Public Fixed Maturities 65% Private Fixed Maturities 10% Commercial Mortgage & Other Loans 11% TAASIL 6% (4) PFI GA ex. CBD (1) Investment Portfolio $346 billion (2) PFI GA ex. CBD (1) Fixed Maturities $261 billion (2) (5) Financial Strength Symposium 6.23.2015 39% 17% 7% 6% 3% 2% 1% Corporates Japan Government U.S. Government Other Foreign Government Commercial mortgage-backed Asset-backed Residential mortgage-backed (Agency) |
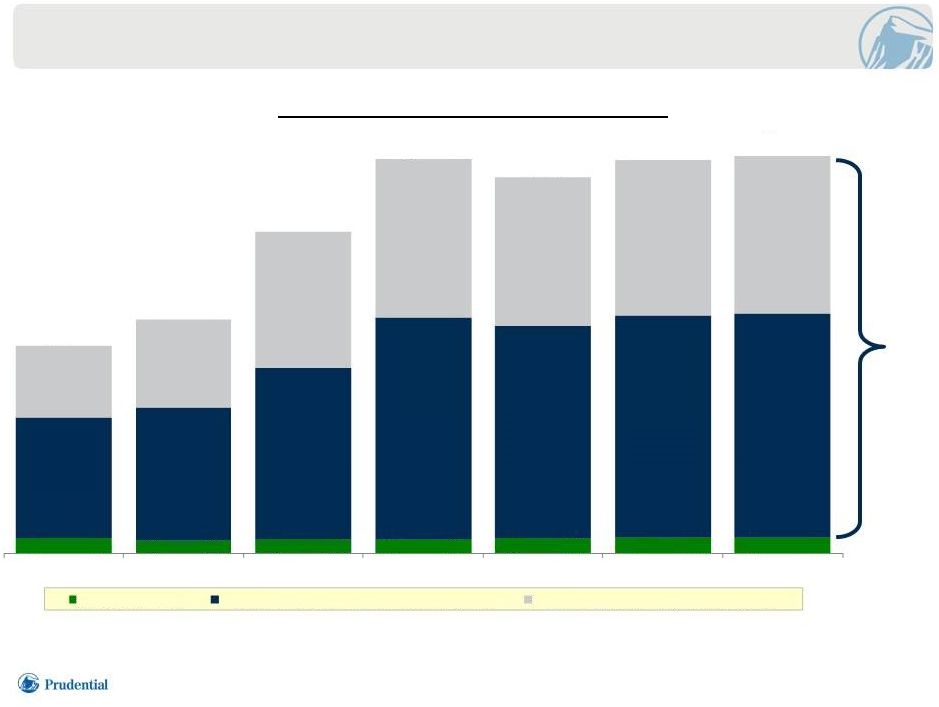 ASSET
SELECTION
– CONSISTENT FOCUS ON QUALITY 4 1) Balance sheet carrying amount. Reflects equivalent ratings for investments in international insurance operations.
2) NAIC 3-6. 3) NAIC 1-2. (3) (3) PFI GA ex. CBD – Fixed Maturity Portfolio (1) ($ billions) 96% (2) Financial Strength Symposium 6.23.2015 $9
7%
$8 5%
$9 4%
$9 4%
$9 4%
$10 4%
$10
4% $80 59% $87 57% $113 54% $145 56% $140 56% $146 56% $147 56% $47 34% $58 38% $89 42% $105 40% $98 40% $102 40% $104 40% 2009 2010 2011 2012 2013 2014 1Q 2015 Other Securities High or Highest Quality: Non-Governments High or Highest Quality: Governments $136 $153 $211 $259 $247 $258 $261 |
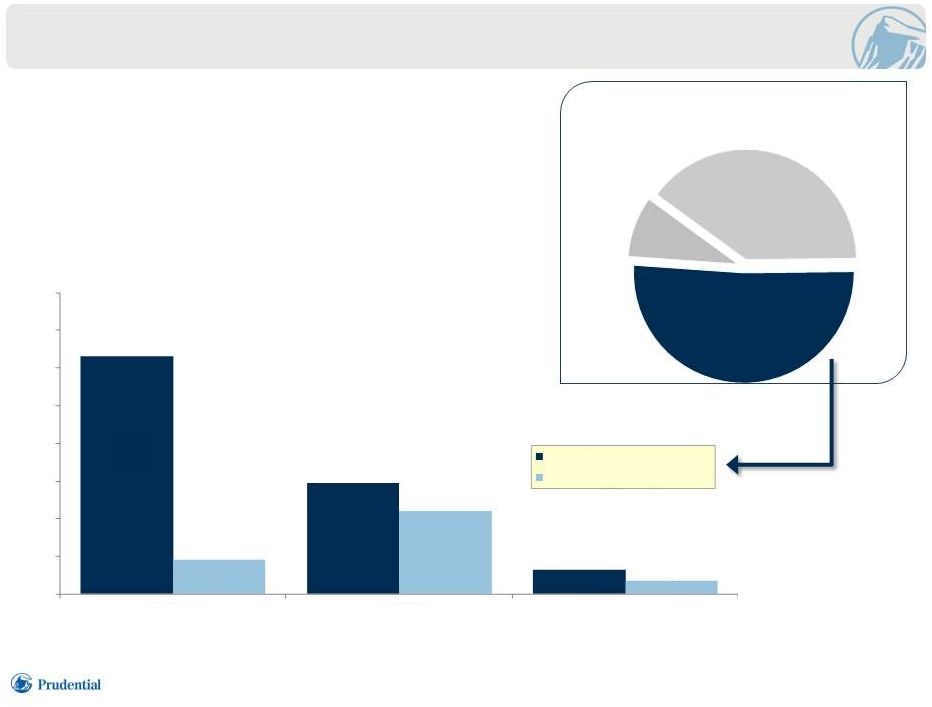 5 1) As of 3/31/15 at balance sheet carrying amount. Reflects equivalent ratings for investments in international insurance operations.
• Utilization of Prudential Capital Group’s origination capabilities allows Prudential to hold a high percentage of its Corporate credit in Private Placements PFI GA ex. CBD Fixed Maturity Portfolio 100% = $261 billion (1) Financial Strength Symposium 6.23.2015 ($ millions) CORPORATE BOND PORTFOLIO PFI GA EX. CBD Corporate Credit $134 billion Governments $104 billion Structured Products $23 billion Other (NAIC 3,4,5,6) 46% 22% 5% 7% 17% 3% $- $10,000 $20,000 $30,000 $40,000 $50,000 $60,000 $70,000 $80,000 NAIC 1 NAIC 2 Public Corporate: $99 billion Private Corporate: $35 billion |
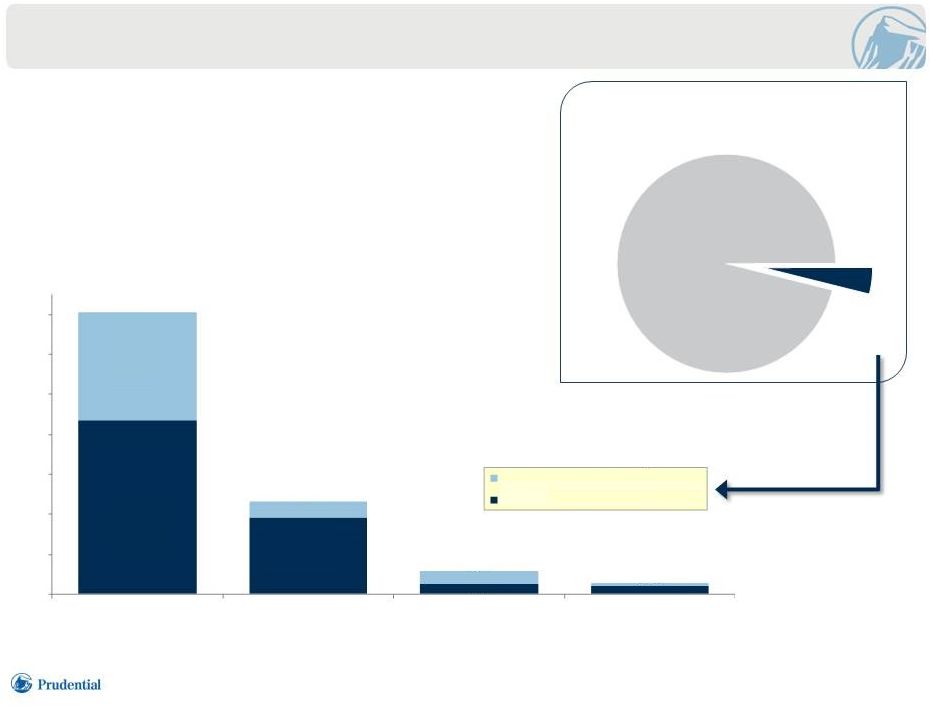 MODEST
EXPOSURE
TO NAIC 3-6 6 1) High Yield exposure reflects securities with NAIC ratings 3-6. 2) As of 3/31/15 at balance sheet carrying amount. Reflects equivalent ratings for investments in international insurance operations.
• High Yield exposure (1) comprises 4% of the PFI GA ex. CBD Portfolio PFI GA ex. CBD Fixed Maturity Portfolio 100% = $261 billion (2) NAIC 3-6 $10.2 billion NAIC 1 - 2 96% 4% Financial Strength Symposium 6.23.2015 ($ millions) 62% 83% 46% 70% 38% 17% 54% 30% $- $1,000 $2,000 $3,000 $4,000 $5,000 $6,000 $7,000 NAIC 3 NAIC 4 NAIC 5 NAIC 6 Private Fixed Maturities: $3.5 billion Public Fixed Maturities: $6.7 billion |
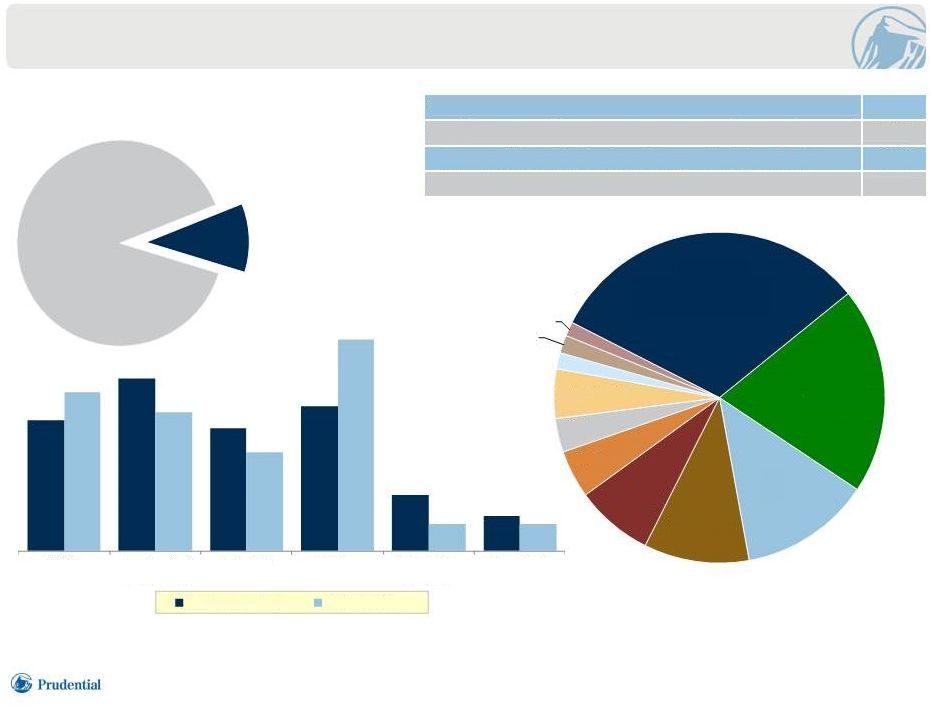 PFI GA
ex. CBD Portfolio 100% = $346 billion
(2) WELL-DIVERSIFIED
COMMERCIAL
LOAN
PORTFOLIO
(1) 7 1) As of 3/31/15. 2) At balance sheet carrying amount. 3) Other consists of golf courses, ski resorts, parking garages, self-storage, hospital and ground leases.
4) At gross carrying value. Excludes Agricultural loans. Prudential as of 3/31/15. ACLI as of 12/31/14 (latest available). (4) (3) Commercial Mortgage and Other Loans $38 billion 11% Financial Strength Symposium 6.23.2015 (4) Pacific 32% South Atlantic 20% Middle Atlantic 13% West South Central 10% East North Central 8% Mountain 5% Other 3% New England 5% Asia 1% West North Central 2% East South Central 1% 20% 26% 19% 22% 8% 5% 24% 21% 15% 32% 4% 4% Retail Apartments / Multi-Family Industrial Office Senior Living & Other Hospitality PFI GA ex. CBD ACLI ex. Pru Weighted Average Debt Service Coverage Ratio (DSCR) 2.36x Weighted Average Loan-to-Value Ratio (LTV) 54% Commercial and Agricultural Loans at a Fixed Rate 96% Over 30 Days Past Due 0.2% |
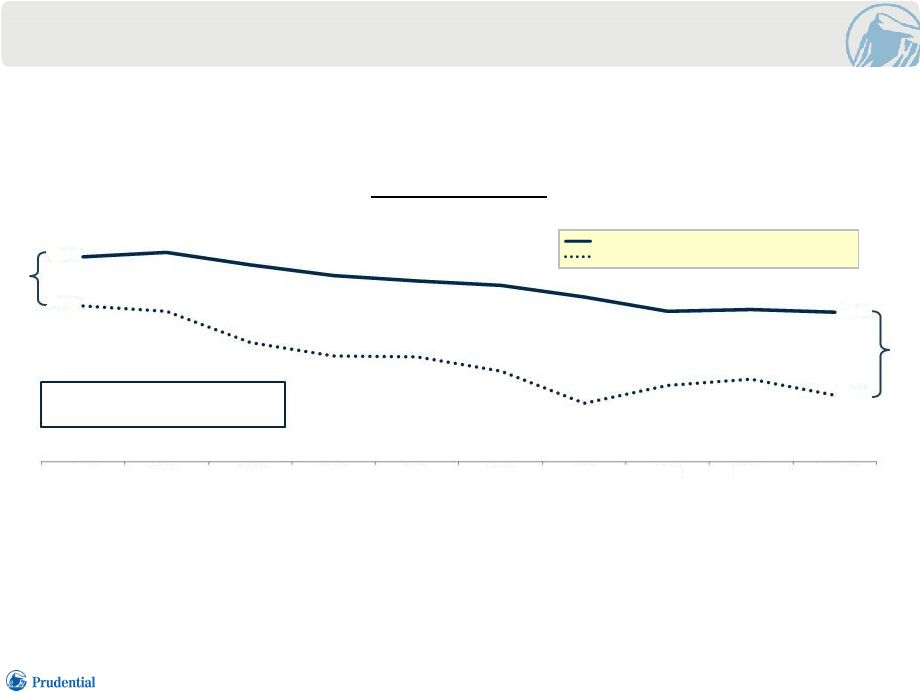 MANAGING
THROUGH
A LOW
INTEREST
RATE
ENVIRONMENT
8 1) Fixed Maturity Yields (1) 9 year average spread - 2.33% vs.1Q 2015 spread - 2.57% 2.57% 1.53% • Active management, in-house origination and underwriting of Privates and Mortgages have allowed us to mitigate yield deterioration Financial Strength Symposium 6.23.2015 6.33% 4.61% 4.80% 2.04% 2006 2007 2008 2009 2010 2011 2012 2013 2014 1Q 2015 PFI GA ex. CBD and Japanese Insurance Operations GA 10 Yr U.S. Treasury Yields for fixed maturities are based on amortized cost and are calculated net of liabilities and rebate expenses corresponding to securities
lending activity. Yields exclude investment income on assets other than
those included in invested assets. Prior periods’ yields are presented as last reported. Treasury yields shown are annual averages. Portfolio yields are annualized for 1Q 2015. |
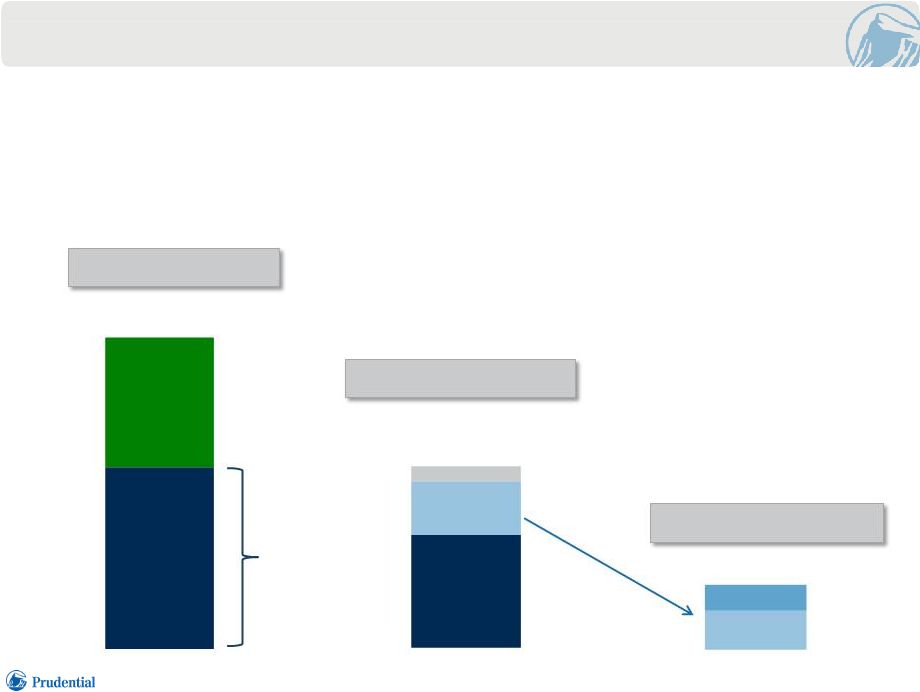 CONTINUED
LOW
RATES
WILL
POSE
A CHALLENGE
OVER
THE LONG TERM 9 • Active Asset-Liability management mitigates impact of rate environment • Our Japan Insurance Operations have operated in a low rate environment for many years
• Jumbo Pension Risk Transfer (PRT) deals priced and on-boarded at current low rates
($ billions) Insurance Businesses U.S. Businesses ex. CBD Liabilities - $288 (1) Japan Insurance Operations $120 U.S. Businesses ex. CBD $168 Long Duration Products $104 Guaranteed Minimum Rates $50 At Minimum $30 Participating $14 Liabilities - $168 (1) Guaranteed Minimum Rates Contracts - $50 (1) Financial Strength Symposium 6.23.2015 1) As of 3/31/15. Above $20 |
 PRUDENTIAL’S PRT BUSINESS HAS EXPERIENCED SIGNIFICANT GROWTH OVER THE PAST FOUR YEARS (1) 10 $75 billion (2) PENSION LIABILITIES 550,000 RETIREES 130+ PLANS IN U.S. & U.K. 1) Through 3/31/15. 2) Includes ~$35 billion of longevity reinsurance. Financial Strength Symposium 6.23.2015 |
 INVESTMENT
EXPERTISE:
AN
ADVANTAGE
IN PRT TRANSACTIONS 11 PRT Timeline Initial Request for Proposal Provider Selection Annuity Purchase ------- Underwriting ------- ------- Premium Roll Forward ------- Mitigate risk from Provider Selection to Annuity Purchase by rolling forward premiums through: • A highly customizable bond index • A derivative reference portfolio • An agreed upon asset in- kind portfolio At Initial Request, begin to understand the specific nature of the liability to inform portfolio construction: • Upfront involvement of Portfolio Management team • No “cookie cutter” approach to portfolio construction • Heavily engaged in asset sale from the initial request Financial Strength Symposium 6.23.2015 Execution of the Pension Risk Transfer: • The group annuity contract is executed • Assets are transferred • Rebalancing of portfolio, as needed |
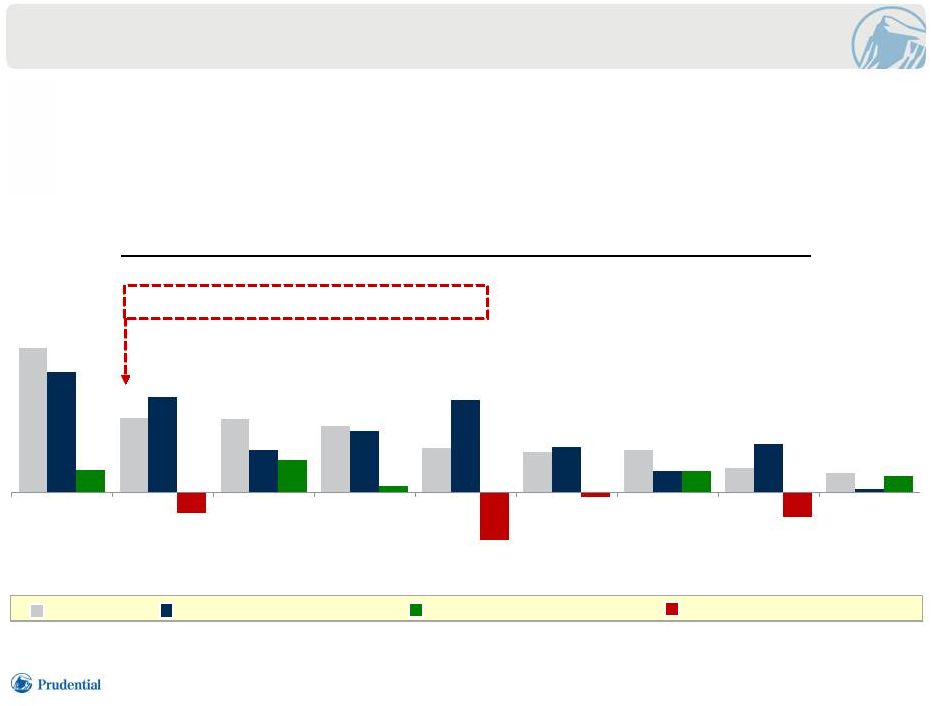 ENERGY
SECTOR
12 PFI GA – Fixed Maturity Portfolio vs. Barclays U.S. Composite Index: Industrial Sector only
PFI GA Exposure (2) Overweight Barclays U.S. Corporate Index Underweight Barclays U.S. Corporate Index Barclays U.S. Industrial Composite Index Financial Strength Symposium 6.23.2015 1) As of 3/31/15 at carrying amount. 2) As of 3/31/15 at fair value. ~14% Oil Field Services (~94% Investment Grade) 27.2% 14.1% 13.9% 12.6% 8.4% 7.6% 8.0% 4.5% 3.7% 22.8% 18.0% 7.9% 11.5% 17.5% 8.5% 4.0% 9.1% 0.7% 4.3% -3.9% 6.0% 1.1% -9.1% -0.9% 4.0% -4.6% 3.0% Consumer Noncyclical Energy Capital Goods Consumer Cyclical Communications Basic Industry Transportation Technology Other Industrial • Direct and Indirect Exposure of $17 billion (1) – approximately 95% is Investment Grade • Below Investment Grade – approximately 32% Private Placements • We feel that Oil Field Services is the industry most challenged; thus we have a defensive
allocation |
 KEY
TAKEAWAYS
13 • Asset Management is a core business at Prudential and a distinct advantage • Core principles of Insurance Portfolio Management: – Liability driven, well-matched – High quality/well-diversified – Deep integration • Continue to prefer to underwrite and manage our credit risk directly – High priority on private asset classes, both Corporates and Mortgages • High Yield asset mix is higher quality, with an emphasis on Privates • Expect a challenging rate/spread environment over the near-term – New business premiums being invested at lower rates, but with solid net margins Financial Strength Symposium 6.23.2015 |
 APPENDIX |
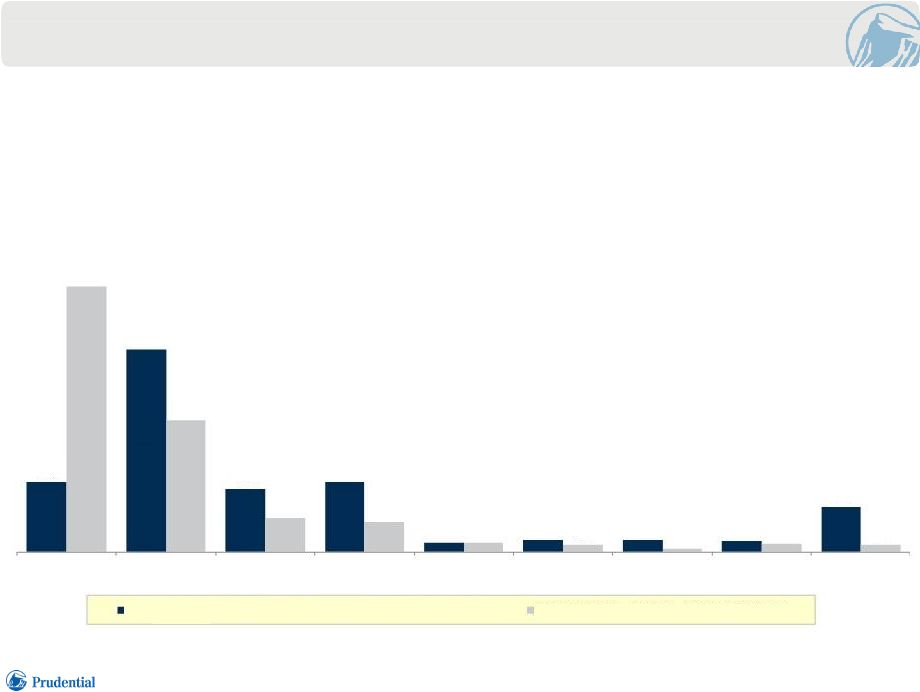 PFI GA EX. CBD (1)
15 1) As of 3/31/15 at balance sheet carrying amount. 2) Commercial mortgage and other loans. (2) • The PFI GA ex. CBD and Japanese Insurance Operations has greater allocations to credit spread assets including Private Placements and Commercial Mortgage Loans • The long duration nature of the liabilities in our Japanese Insurance Operations creates a natural appetite for government/agency bonds Financial Strength Symposium 6.23.2015 14% 41% 13% 14% 2% 3% 2% 2% 9% 53% 27% 7% 6% 2% 1% 1% 2% 1% Governments Public Fixed Maturities Private Fixed Maturities Commercial Loans Equities Other Long-Term Short-Term & Other Policy Loans TAASIL PFI GA ex. CBD and Japanese Insurance Operations: $206 billion Japanese Insurance Operations: $140 billion |
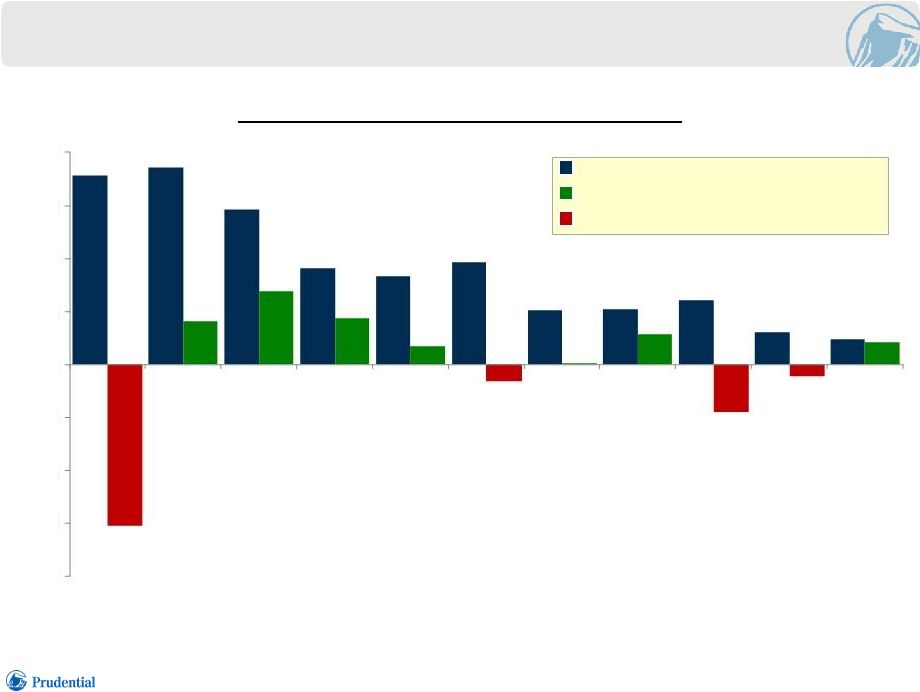 CORPORATE
BOND
PORTFOLIO
BY SECTOR (1) 16 1) As of 3/31/15. PFI GA ex. CBD includes Public and Private holdings. Data based on Market Value.
PFI GA ex. CBD vs. Barclays U.S. Corporate Index PFI GA ex. CBD Exposure Overweight Barclays U.S. Corporate Index Underweight Barclays U.S. Corporate Index Financial Strength Symposium 6.23.2015 - 20% -15% -10% -5% 0% 5% 10% 15% 20% Finance Consumer Noncyclical Utility Capital Goods Consumer Cyclical Energy Basic Industry Transp. Comm. Technology Industrial- Other |
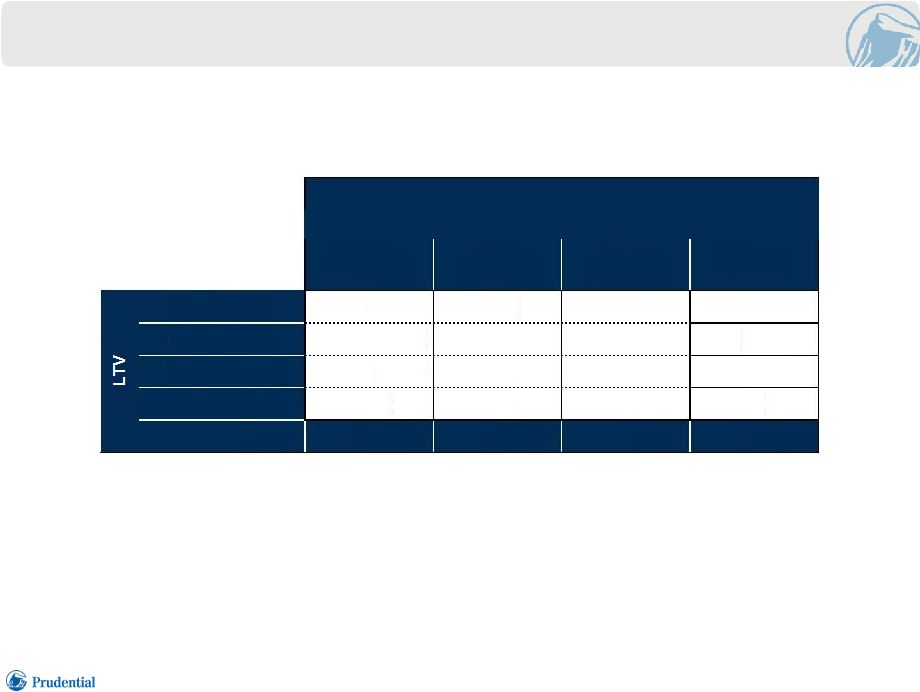 COMMERCIAL &
AGRICULTURAL MORTGAGE
LOAN
PORTFOLIO
17 1) As of 3/31/15 at gross carrying value. ($ millions) Financial Strength Symposium 6.23.2015 Greater than 1.2x 1.0x to < 1.2x Less than 1.0x Totals 0%-59.99% 18,763 391 218 $19,372 60%-69.99% 10,760 341 183 $11,284 70%-79.99% 4,237 519 15 $4,771 Greater than 80% 219 108 150 $477 Totals $33,979 $1,359 $566 $35,904 PFI GA ex. CBD (1) DSCR |
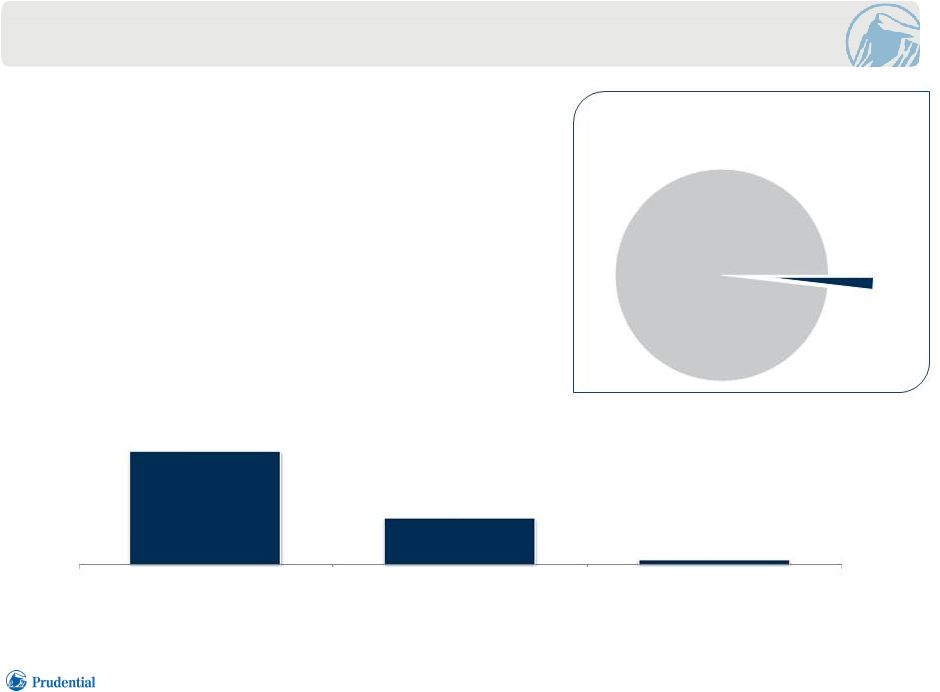 NON-COUPON INVESTMENTS 18 1) As of 3/31/15 at balance sheet carrying amount. 2) Excludes Equity Securities. Reported within Other Long-term Investments. • Prudential has increased its allocation to Non-Coupon Investments in order to: – Diversify away from credit risk – Hedge long-tailed exposures in selected product portfolios – Generate taxable capital gains allowing monetization of tax benefits – Produce higher risk-adjusted returns in the current rate environment PFI GA ex. CBD Portfolio 100% = $346 billion (1) Non-Coupon (2) $6.4 billion 1.8% ($ millions) Financial Strength Symposium 6.23.2015 $4,354 $1,790 $225 Private Equity Hedge Funds JV/LP Non-Real Estate Directly Owned Real Estate JV/LP Real Estate |
 TOTAL
IMPAIRMENTS
AND SALES OF CREDIT IMPAIRED INVESTMENTS (1) 19 1) PFI ex CBD. Represents pre-tax amounts recorded in earnings. Financial Strength Symposium 6.23.2015 ($ millions) (196) (2,645) (1,748) (713) (565) (469) (205) (121) (31) 2007 2008 2009 2010 2011 2012 2013 2014 1Q 2015 |
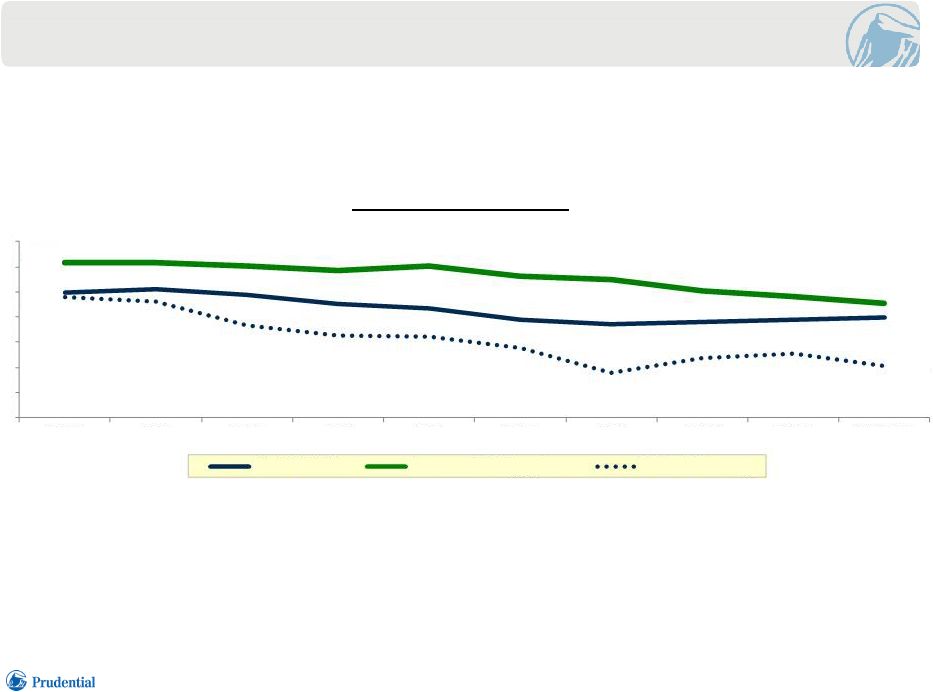 FIXED
MATURITIES
AND COMMERCIAL MORTGAGE YIELDS 20 PFI GA ex. CBD Yields (1) 1) Excludes realized investment gains (losses) and non-hedge accounting derivative results. Yields for commercial mortgage and other loans and
are based on quarterly average carrying values and include investment
income related to commercial loans that support insurance liabilities, for which the investment results generally accrue to contract holders. Yields for fixed maturities are based on amortized cost and are calculated net of liabilities and rebate
expenses corresponding to securities lending activity. Yields exclude
investment income on assets other than those included in invested assets. Prior periods’ yields are presented as last reported. Treasury yields shown are annual averages. Portfolio yields are annualized for 1Q 2015.
Financial Strength Symposium 6.23.2015
Fixed Maturities Commercial Mortgage Loans 10 Yr U.S. Treasury 4.95% 3.96% 4.80% 2.04% 6.15% 4.55% 0% 1% 2% 3% 4% 5% 6% 7% 2006 2007 2008 2009 2010 2011 2012 2013 2014 1Q 2015 |
 PRUDENTIAL
FINANCIAL,
INC.
FINANCIAL
MANAGEMENT
KEN
TANJI
SENIOR
VICE
PRESIDENT
TREASURER |
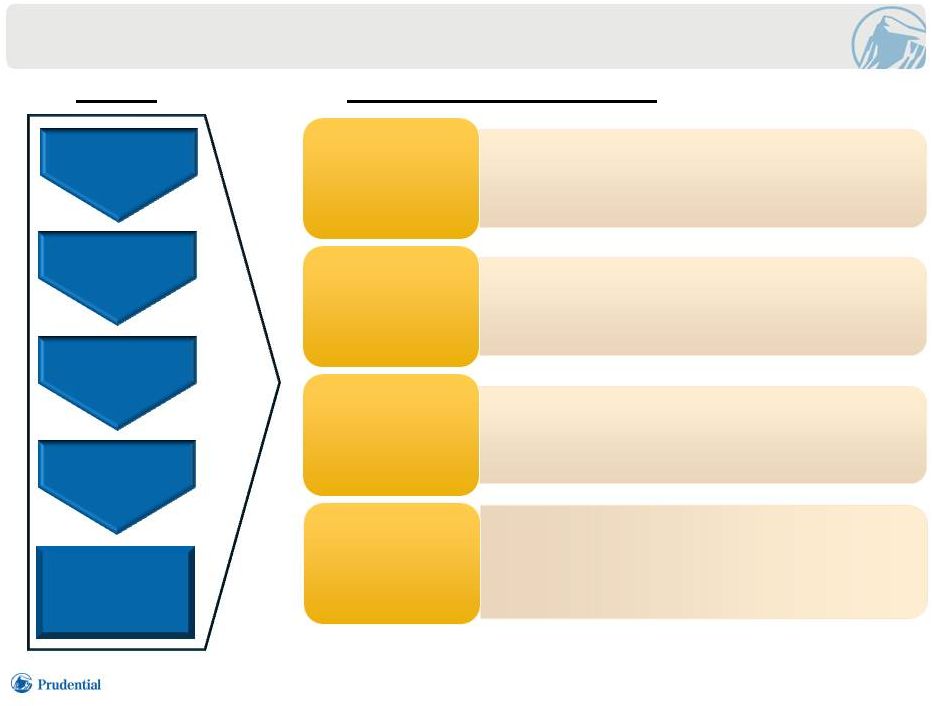 DEFINING
SUCCESS
2 Drivers Stakeholder Value Creation • Diversified and balanced mix of insurance and market risks Business Focus • “AA” standards for capital, leverage and liquidity • Comprehensive risk management framework Financial Strength • Targeted sustainable ROE of 13-14% through a market cycle • Growth in earnings and book value Balanced and Sustainable Sources of Earnings • Cash flow (1) ~60% of after-tax AOI over time • Capital deployment, including growing shareholder dividend Consistency and Transparency of Earnings 1) Includes capital deployed in subsidiaries. Talent Collaboration Innovation Execution Superior Client Experience Financial Strength Symposium 6.23.2015 |
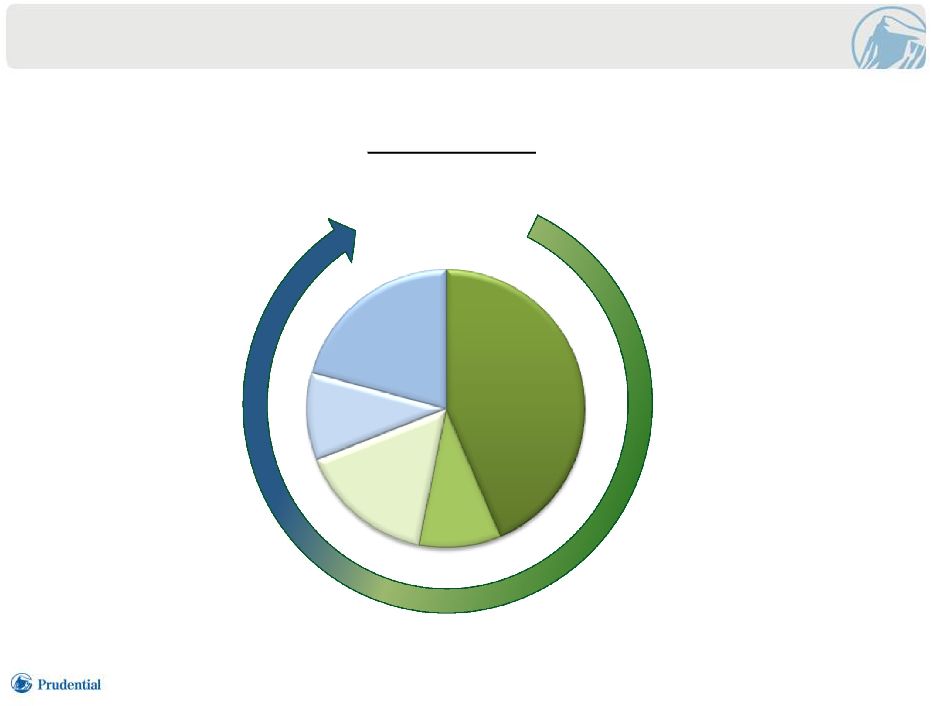 FOCUS ON
PROTECTION,
RETIREMENT AND
ASSET
MANAGEMENT
PROVIDES
A DIVERSIFIED AND BALANCED MIX OF INSURANCE AND MARKET RISKS 3 1) Adjusted operating income (AOI) excluding market driven and discrete items as shown in disclosure section; exhibit excludes Corporate & Other
Operations pre-tax loss of $1.3 billion.
2) Includes U.S. Individual Life and Group Insurance. Full Year 2014 Pre-tax Earnings Market Risk Financial Strength Symposium 6.23.2015 (2) International Insurance 44% U.S. Insurance 9% Retirement 16% Individual Annuities 21% Asset Management 10% $6.3 Billion (1) Insurance Risk |
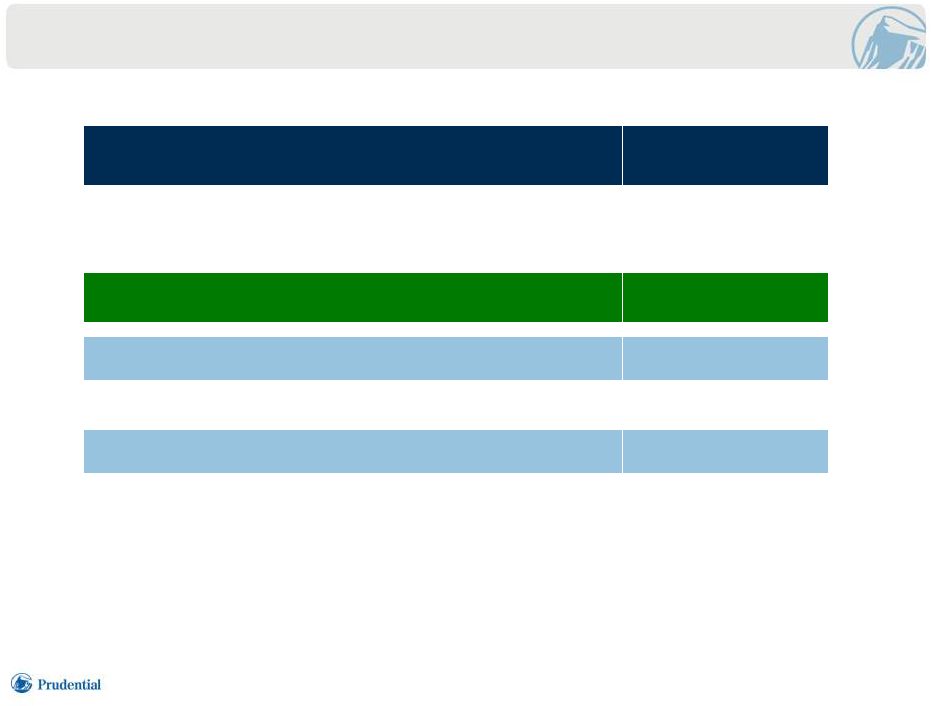 WE
HAVE
SUBSTANTIAL
ON
BALANCE
SHEET
CAPITAL
CAPACITY
4 ($ billions) March 31, 2015 GAAP Equity (1) $31.6 Capital Debt (2) $13.9 Total Available Capital $45.5 Estimated Gross On Balance Sheet Capital Capacity (3) >$4.5 Capital Earmarked for Reduction of Capital Debt ~$2.0 Estimated On Balance Sheet Capital Capacity (3) >$2.5 1) GAAP equity excluding accumulated other comprehensive income (AOCI) and the impact of foreign currency exchange rate remeasurement. This
measure of equity includes the non-economic impact of
non-performance risk (net of deferred policy acquisition costs), which we exclude from “Equity” as defined on subsequent slides, for purposes of calculating Total and Financial Leverage ratios.
2) As reported; subsequent slides related to capital structure and total debt gives pro-forma effect to senior capital debt repayment of $1.4
billion with earmarked proceeds from dividend declared by Prudential
Insurance in second quarter 2015. 3)
Based on targeted Risk Based Capital (RBC) ratio of 400% for Prudential Insurance and
equivalent levels of capital at other insurance operating entities.
Financial Strength Symposium 6.23.2015 |
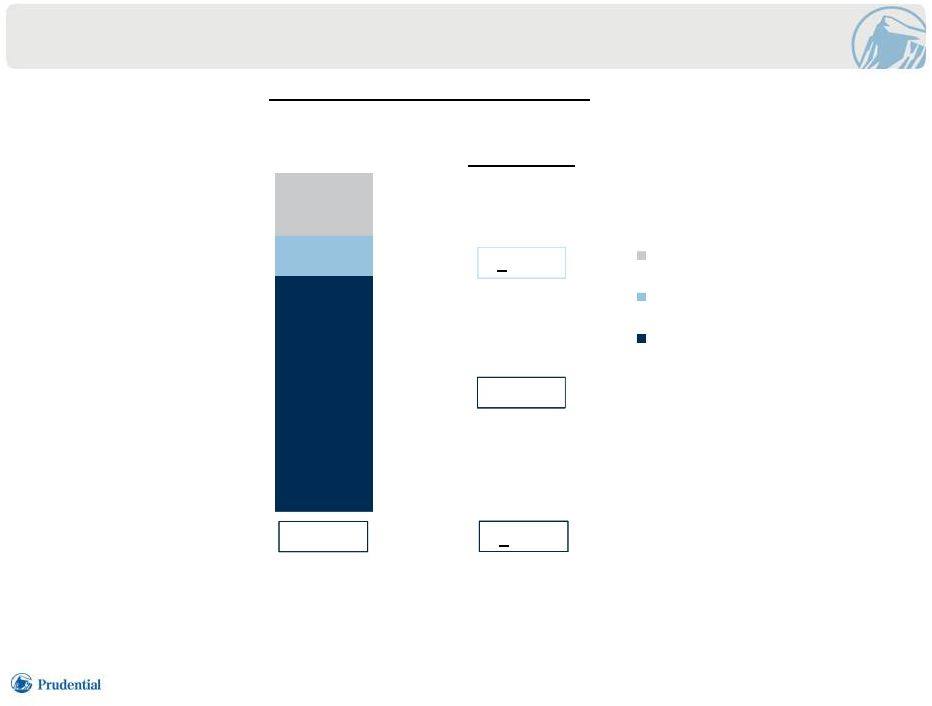 March 31, 2015 Financial Leverage Ratio (3) CAPITAL STRUCTURE NEAR TARGET 5 (1) 1) Gives pro-forma effect to senior capital debt repayment of $1.4 billion with earmarked proceeds from dividend declared
by Prudential Insurance in second quarter 2015.
2) Total equity including non-controlling interests and excluding the impact of foreign currency exchange rate remeasurement,
non-performance risk (net of deferred policy acquisition costs), and
AOCI. 3)
Defined as senior capital debt plus 75% hybrids divided by the senior capital debt plus
100% hybrids plus total equity as defined above. (2)
Composition of Outstanding Capital Target Range 27.3% < 25% < 15% 70-75% Financial Strength Symposium 6.23.2015 70% 12% 18% Senior Capital Debt Junior Subordinated Capital Debt (Hybrids) Equity |
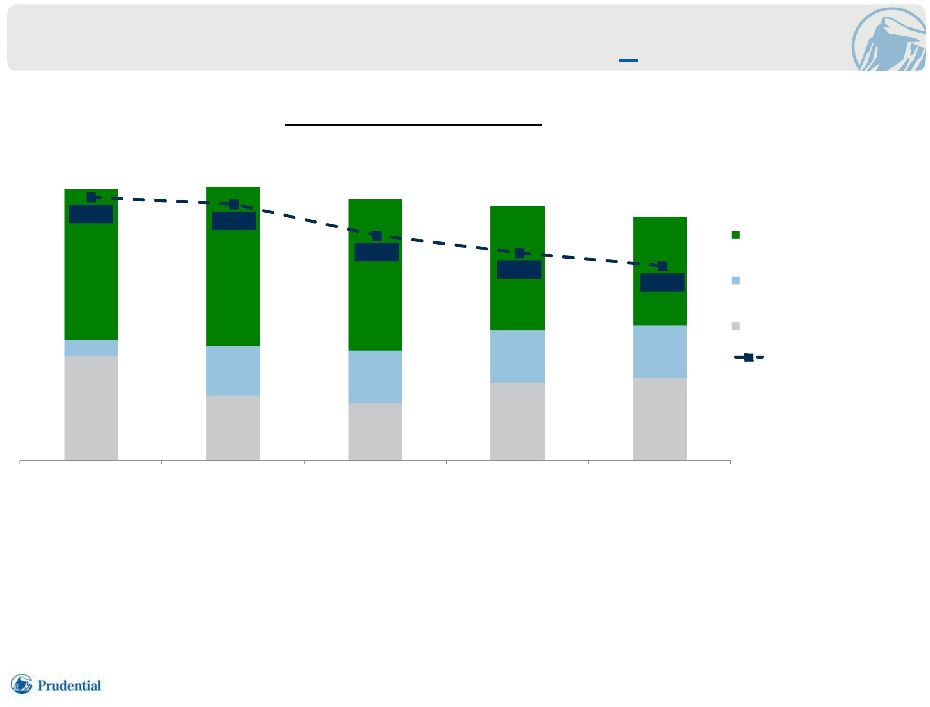 TOTAL
LEVERAGE
RATIO
WITHIN TARGET OF < 45% 6 1) Represents the former Financial Services Businesses (FSB) for periods prior to 3/31/15.
2) Operating debt is utilized to finance business funding needs to meet specific purposes tied to assets or revenue sources as well to finance invested assets or portfolios of invested assets, proceeds of which will service the debt. 3) Senior capital debt is utilized to meet capital requirements of the Prudential businesses.
4) Defined as total debt divided by total debt plus total equity including non-controlling interest adjusted to exclude the impact of foreign
currency exchange rate remeasurement, non-performance risk (net of
deferred policy acquisition costs), and AOCI totaling $7.9 billion, $11.5 billion, $6.3 billion, $13.6 billion and $16.6 billion as of 12/31/ 2011, 2012, 2013, 2014 and 3/31/15, respectively. 5) Reflects the retrospective adoption of amended accounting guidance for deferred policy acquisition costs effective 1/1/12, which reduced GAAP equity by $2.8 billion. Also reflects a discretionary change in accounting principle related to the Company's pension plans.
6) 12/31/14 gives pro-forma effect to Closed Block restructuring; 3/31/15 assumes capital debt repayment of $1.4 billion with earmarked proceeds
from dividend declared by Prudential Insurance in second quarter
2015. (4)
$25.5 $24.5 $22.7 $25.2 (5) (6) $23.7 Composition of Outstanding Debt (1) ($ billions) (6) (3) (2) Financial Strength Symposium 6.23.2015 38% 24% 22% 31% 34% 6% 18% 20% 21% 21% 56% 58% 58% 49% 45% December 31, 2011 December 31, 2012 December 31, 2013 Proforma December 31, 2014 Proforma March 31, 2015 Operating Debt Junior Subordinated Capital Debt (Hybrids) Senior Capital Debt 49.9% 49.3% 46.6% 45.1% 44.0% Total Leverage Ratio |
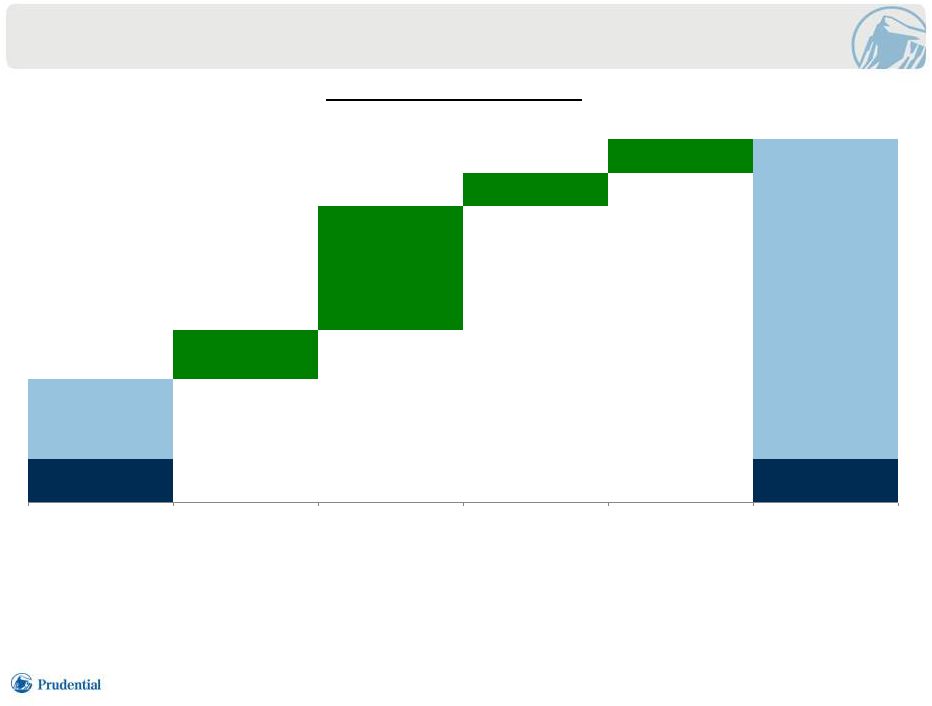 Targeted Cash Level $1.3 Targeted Cash Level $1.3 $2.4 $9.7 $1.5 $3.8 $1.0 $1.0 Net Cash Contingent Capital Facility Committed Credit Lines Internal Sources Commercial Paper Capacity Total Liquidity Resources $3.7 $11.0 (1) (2) (3) (4) (5) SUBSTANTIAL HOLDING COMPANY CASH AND SOURCES OF LIQUIDITY 7 Financial Strength Symposium 6.23.2015 PFI Alternate Sources of Liquidity As of March 31, 2015 ($ billions) 1) Prudential Financial, Inc. (PFI) cash, cash equivalents and short-term investments, less short-term intercompany borrowings and
commercial paper. 2) PFI has access to liquid assets through a 10-year contingent funding facility, established in November 2013, that can be used to meet
liquidity needs and/or to downstream as capital to operating
subsidiaries. 3) Includes $1.8 billion shared with Prudential Funding, LLC, a subsidiary of PICA. Effective 4/14/15, we renegotiated the two existing facilities
into one $4 billion 5-year facility available to both PFI and PICA. 4) Primarily includes Enterprise Liquidity Account which is a facility for lending and borrowing of funds between PFI and its subsidiaries on a
daily basis. 5) Represents estimated total capacity. $128 million of PFI commercial paper was outstanding as of 3/31/15. |
 MANAGING
RISK
THROUGH
MULTIPLE
LENSES
8 • Focus on economics while striking a balance between various regimes GAAP Stat Economics Tax Financial Strength Symposium 6.23.2015 |
 RISK
MANAGEMENT
STRATEGIES
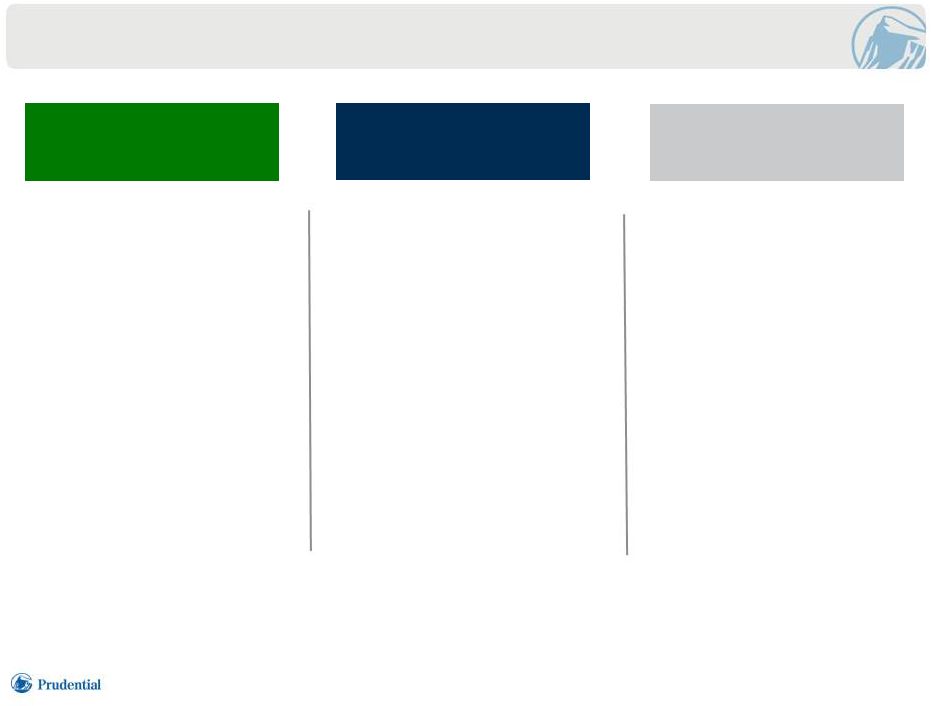
9 • Product Design • Diversification • Asset Liability Management • Hedging • Risk Appetite & Limits Market Risk (Credit, Equity, Interest Rate, FX) • Pooling • Diversification / Risk Selection • Product Design • Actuarial Capabilities • Internal Controls • Business Continuation Planning • Contingency Planning • Systems Security Insurance Risk (Longevity, Mortality, Morbidity, Policyholder Behavior) Operational Risk (Systems, Security, Compliance, Reputation) Financial Strength Symposium 6.23.2015 |
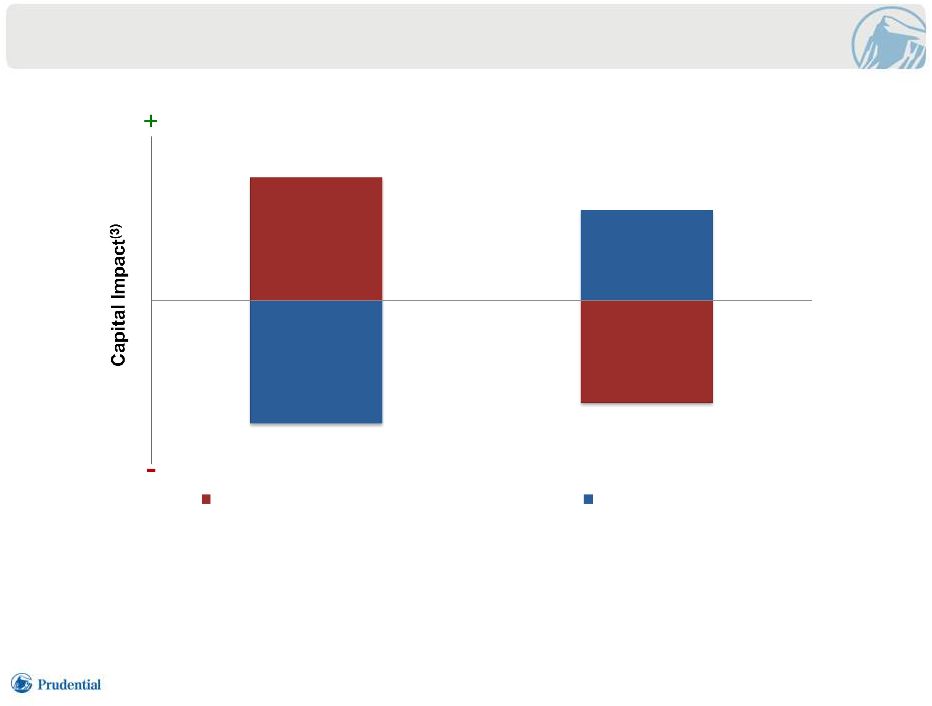 MORTALITY AND
LONGEVITY
RISK
EXPOSURE:
BUSINESS
MIX
PRODUCES
OFFSETTING
IMPACTS
10 1) Increase based on longevity improvement greater than base improvement assumptions.
2) Decrease based on longevity improvement less than base improvement assumptions. 3) Based on business in force as of 12/31/14. Financial Strength Symposium 6.23.2015 Life Expectancy Increase (1) Life Expectancy Decrease (2) Individual Life & International Insurance Mortality Risk Retirement & Annuities Longevity Risk |
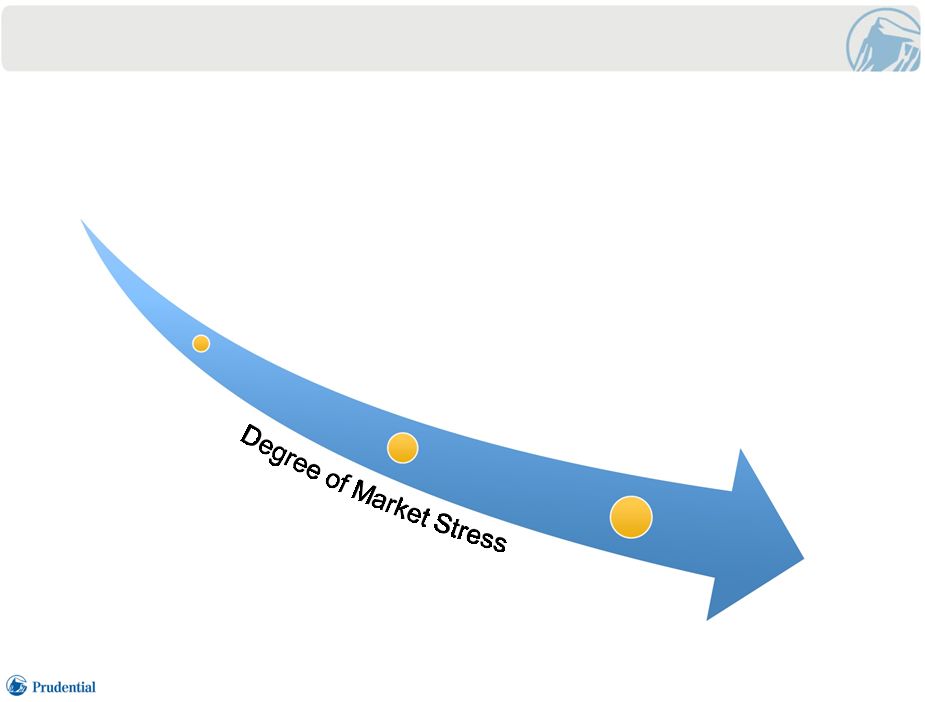 MARKET
RISK
MANAGEMENT
11 “Tail Risk” “Normal Market Volatility” • Portfolio and Product Hedging • Excess Capital • Macro Hedging • Management Actions • Capital Protection Framework Financial Strength Symposium 6.23.2015 |
 CAPITAL
PROTECTION
FRAMEWORK
12 On Balance Sheet Capital Capacity Credit Facilities Derivatives / Hedging Equity Market Decline Interest Rate Shock Credit Shock Currency Shock 50%-60% varying by country U.S. 325 bps 100 bps Japan 150 bps 50 bps Great Depression Yen appreciates to ~80/USD Contingent Capital Tail Stress Parameters (1) Our Toolbox Expected Outcome • Maintain adequate and competitive regulatory capital position at insurance companies • Temporary increase in Financial Leverage Ratio • Maintain adequate cash position at parent company 1) Tail event stress parameters assume immediate shock. Up Down Financial Strength Symposium 6.23.2015 |
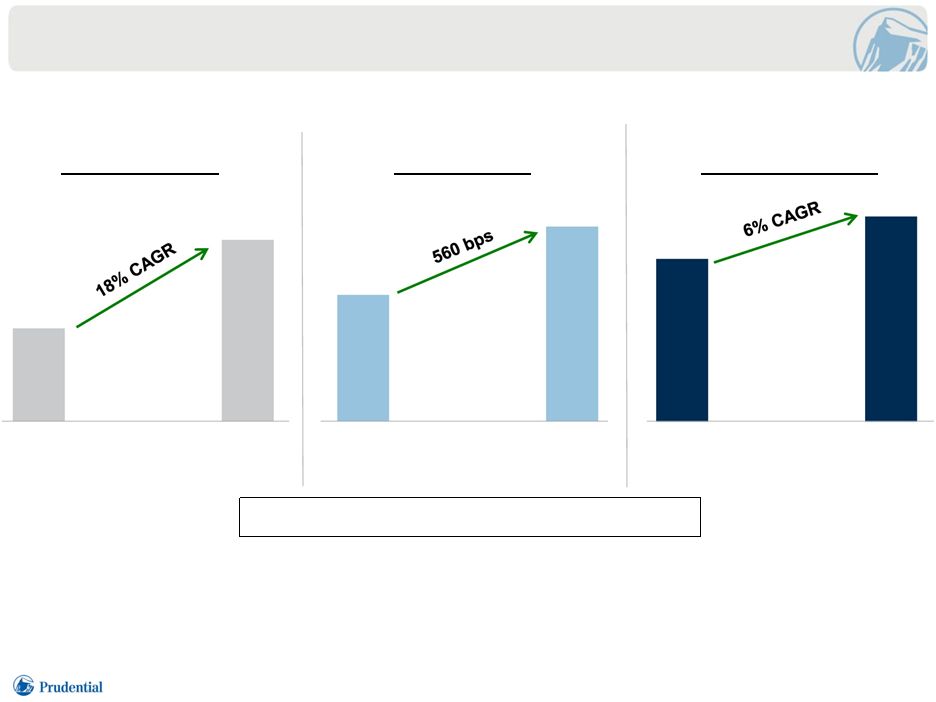 2010 2014 10.2% 15.8% Return on Equity (2)(3) TRACK RECORD OF FINANCIAL PERFORMANCE (1) 13 $5.03 $9.84 Earnings Per Share (2) 2010 2014 Financial Strength Symposium 6.23.2015 Targeted Sustainable ROE of 13% - 14% 2010 2014 $51.28 $64.75 Book Value Per Share (4) 1) Amounts attributable to PFI; represents results of the former FSB. Per share data amounts on diluted basis. 2) Excluding market driven and discrete items as shown in disclosure section; based on application of 35% tax rate for EPS and ROE
calculations. 3) ROE based on after-tax AOI excluding market driven and discrete items; gives effect to direct equity adjustment for earnings per share
calculation. Based on average attributed equity excluding AOCI and
adjusted to remove amount included for foreign currency exchange rate remeasurement. 4) Excludes AOCI and adjusted to remove amount included for foreign currency exchange rate remeasurement. |
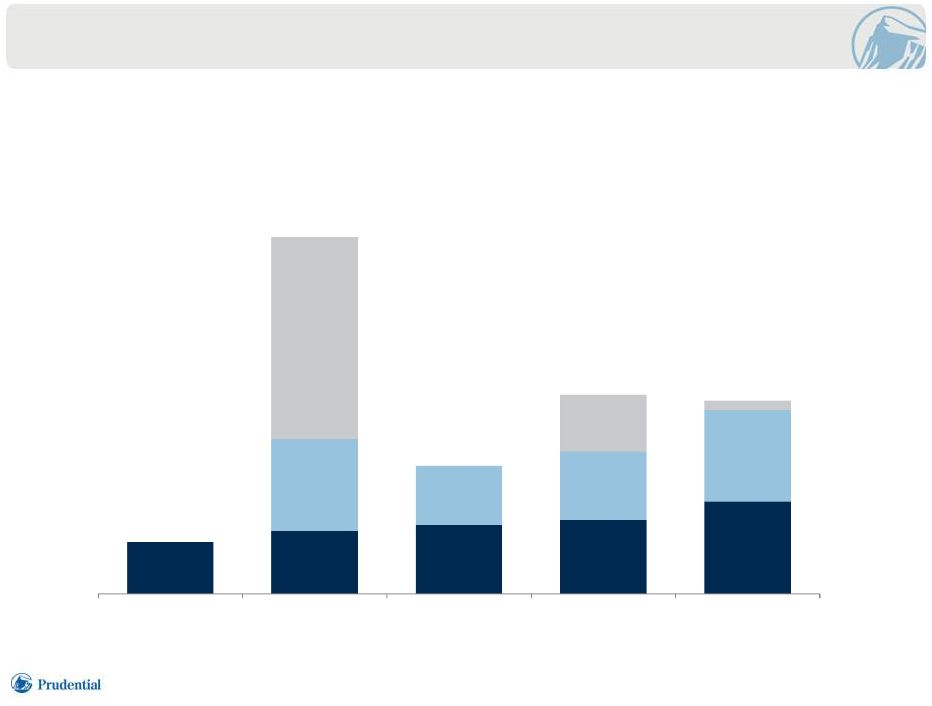 STRONG
HISTORY
OF CAPITAL DEPLOYMENT 14 $3.9 $1.4 $2.2 $2.1 ($ billions) • Expected capital available for redeployment, ~60% of after-tax adjusted operating income
over time, allows us to consistently return capital to shareholders and deploy toward
other accretive uses
Financial Strength Symposium 6.23.2015
Dividends $0.6 Dividends $0.7 Dividends $0.7 Dividends $0.8 Dividends $1.0 Share Repurchases $1.0 Share Repurchases $0.7 Share Repurchases $0.8 Share Repurchases $1.0 M&A $2.2 M&A $0.6 M&A $0.1 2010 2011 2012 2013 2014 |
 KEY
TAKEAWAYS
15 • Diversified and complementary mix of businesses and risks • Strong capital and liquidity positions – Substantial on balance sheet capital capacity – Improved total leverage ratio • Focused on risk management and capital preservation • Strong profitability and opportunities for growth • Strong track record of capital redeployment supported by capital generated from
our balanced mix of businesses
Financial Strength Symposium 6.23.2015 |
 PRUDENTIAL
FINANCIAL,
INC. 2015
FINANCIAL
STRENGTH
SYMPOSIUM
JAMIE
KALAMARIDES
VICE
PRESIDENT
PRUDENTIAL
RETIREMENT |