EX-99.1
Published on
Prudential Financial, Inc. 2019 Financial Outlook Conference Call Presentation December 6, 2018 Exhibit 99.1
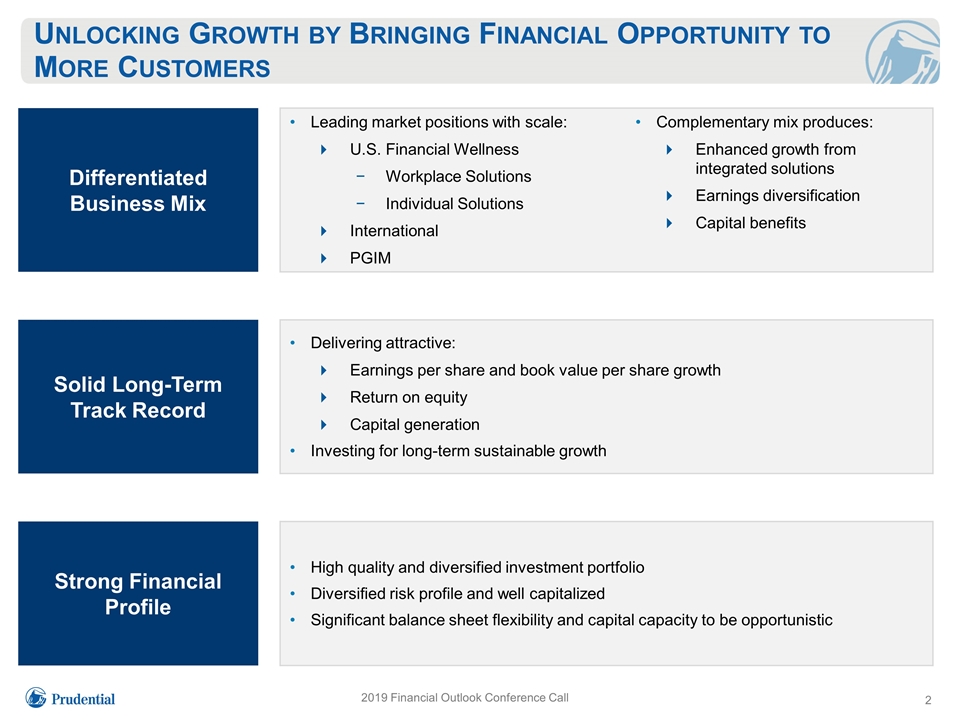
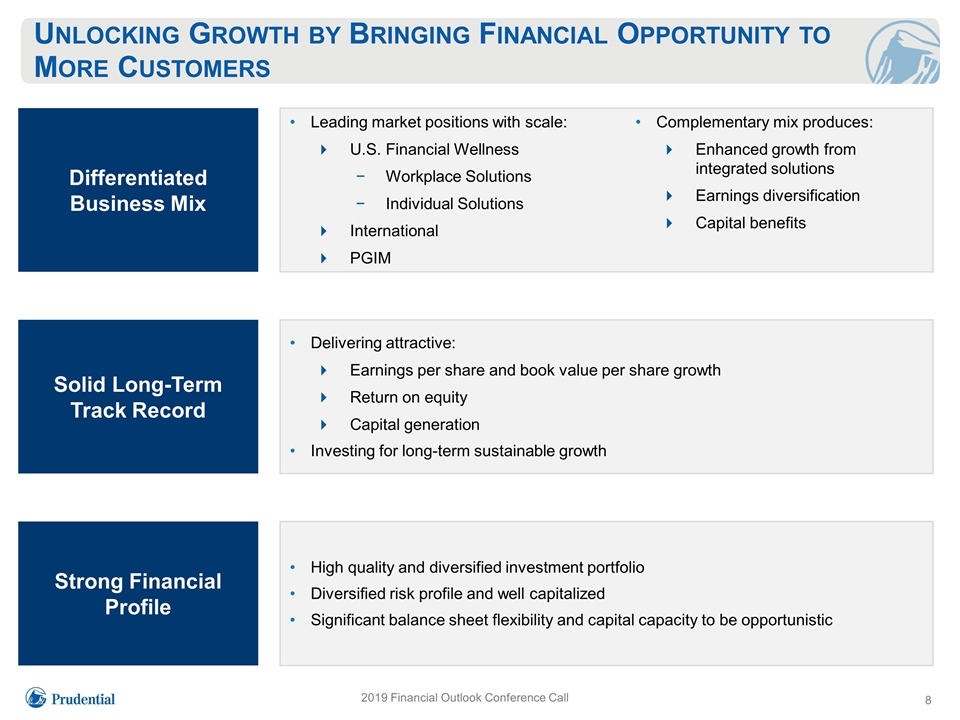
2019 Financial Outlook Conference Call Unlocking Growth by Bringing Financial Opportunity to More Customers Differentiated Business Mix Leading market positions with scale: U.S. Financial Wellness Workplace Solutions Individual Solutions International PGIM Complementary mix produces: Enhanced growth from integrated solutions Earnings diversification Capital benefits Solid Long-Term Track Record Delivering attractive: Earnings per share and book value per share growth Return on equity Capital generation Investing for long-term sustainable growth Strong Financial Profile High quality and diversified investment portfolio Diversified risk profile and well capitalized Significant balance sheet flexibility and capital capacity to be opportunistic
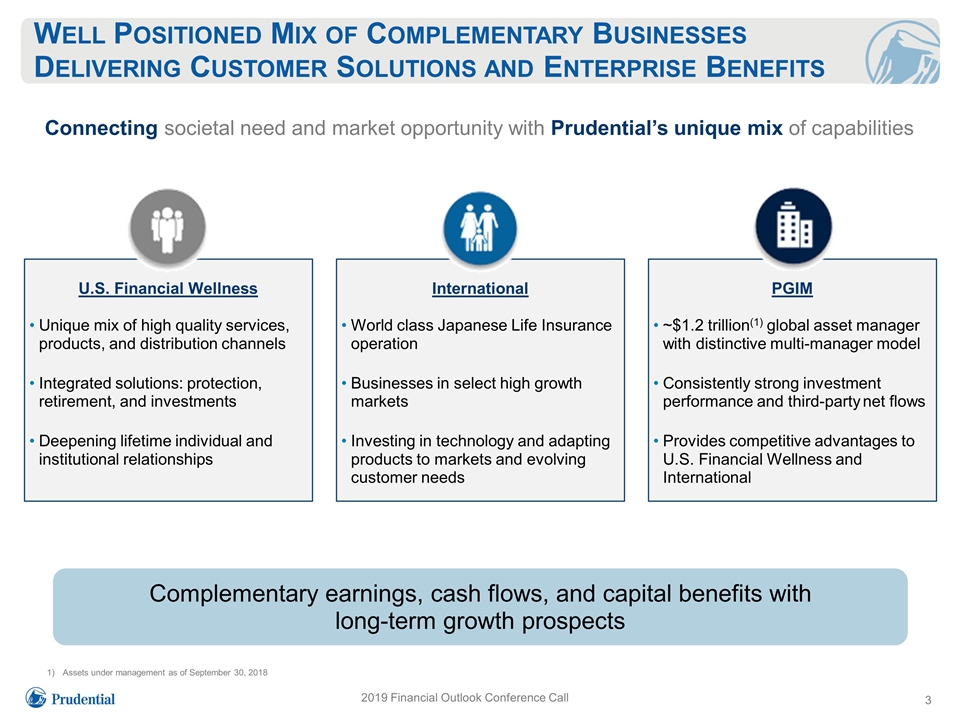
Complementary earnings, cash flows, and capital benefits with long-term growth prospects 2019 Financial Outlook Conference Call Well Positioned Mix of Complementary Businesses Delivering Customer Solutions and Enterprise Benefits U.S. Financial Wellness Unique mix of high quality services, products, and distribution channels Integrated solutions: protection, retirement, and investments Deepening lifetime individual and institutional relationships Connecting societal need and market opportunity with Prudential’s unique mix of capabilities International World class Japanese Life Insurance operation Businesses in select high growth markets Investing in technology and adapting products to markets and evolving customer needs PGIM ~$1.2 trillion(1) global asset manager with distinctive multi-manager model Consistently strong investment performance and third-party net flows Provides competitive advantages to U.S. Financial Wellness and International Assets under management as of September 30, 2018
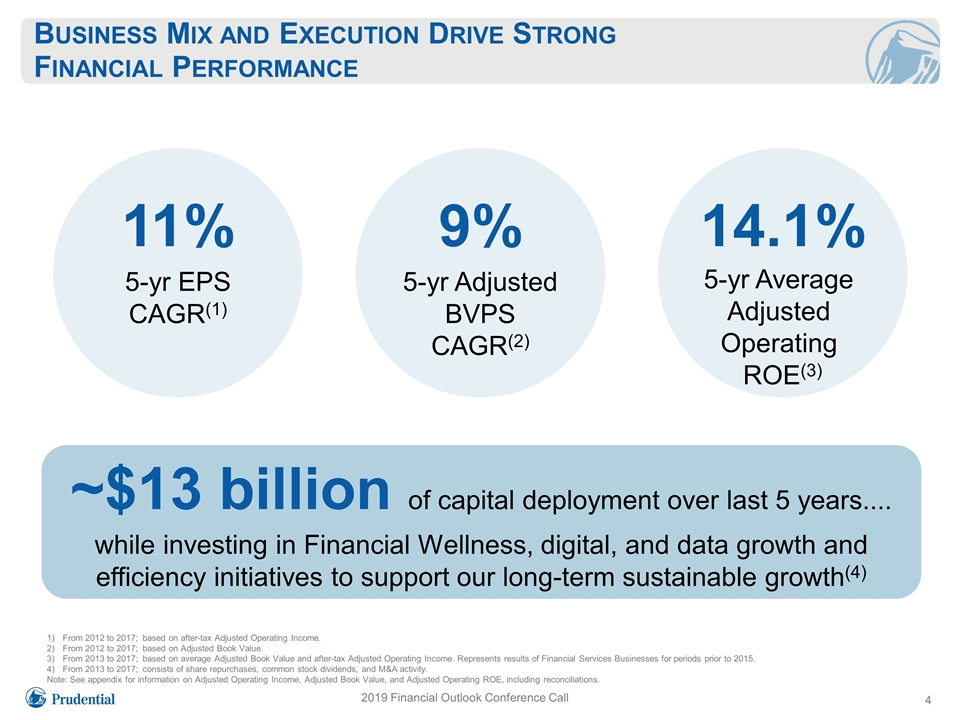
4 2019 Financial Outlook Conference Call Business Mix and Execution Drive Strong Financial Performance From 2012 to 2017; based on after-tax Adjusted Operating Income. From 2012 to 2017; based on Adjusted Book Value. From 2013 to 2017; based on average Adjusted Book Value and after-tax Adjusted Operating Income. Represents results of Financial Services Businesses for periods prior to 2015. From 2013 to 2017; consists of share repurchases, common stock dividends, and M&A activity. Note: See appendix for information on Adjusted Operating Income, Adjusted Book Value, and Adjusted Operating ROE, including reconciliations. 11% 5-yr EPS CAGR(1) 9% 5-yr Adjusted BVPS CAGR(2) 14.1% 5-yr Average Adjusted Operating ROE(3) ~$13 billion of capital deployment over last 5 years.... while investing in Financial Wellness, digital, and data growth and efficiency initiatives to support our long-term sustainable growth(4)
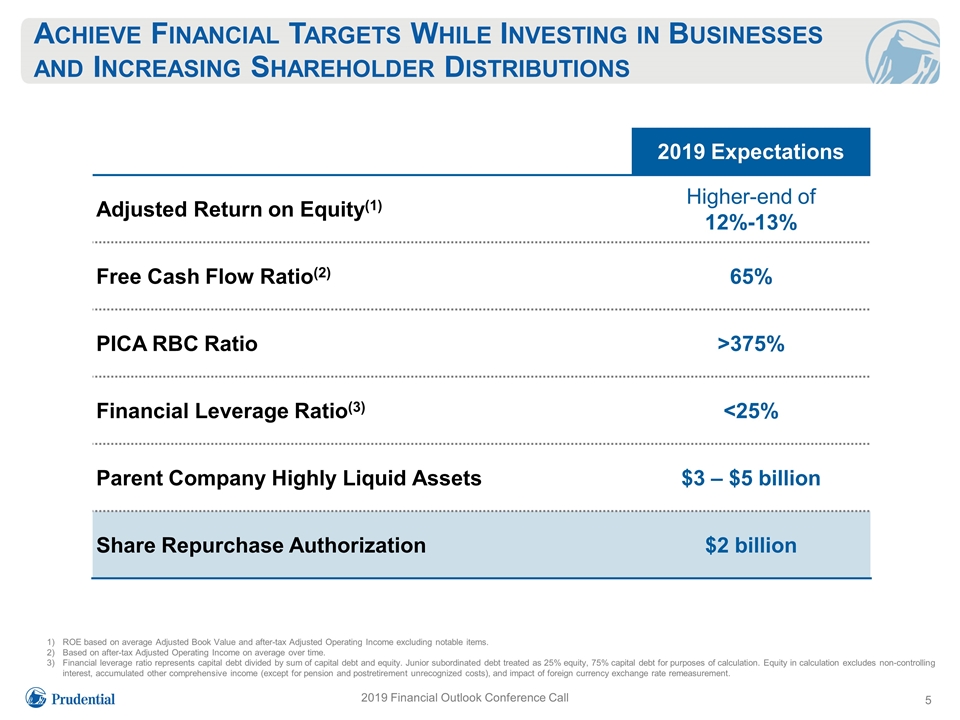
2019 Financial Outlook Conference Call Achieve Financial Targets While Investing in Businesses and Increasing Shareholder Distributions ROE based on average Adjusted Book Value and after-tax Adjusted Operating Income excluding notable items. Based on after-tax Adjusted Operating Income on average over time. Financial leverage ratio represents capital debt divided by sum of capital debt and equity. Junior subordinated debt treated as 25% equity, 75% capital debt for purposes of calculation. Equity in calculation excludes non-controlling interest, accumulated other comprehensive income (except for pension and postretirement unrecognized costs), and impact of foreign currency exchange rate remeasurement. 2019 Expectations Adjusted Return on Equity(1) Higher-end of 12%-13% Free Cash Flow Ratio(2) 65% PICA RBC Ratio >375% Financial Leverage Ratio(3) <25% Parent Company Highly Liquid Assets $3 – $5 billion Share Repurchase Authorization $2 billion
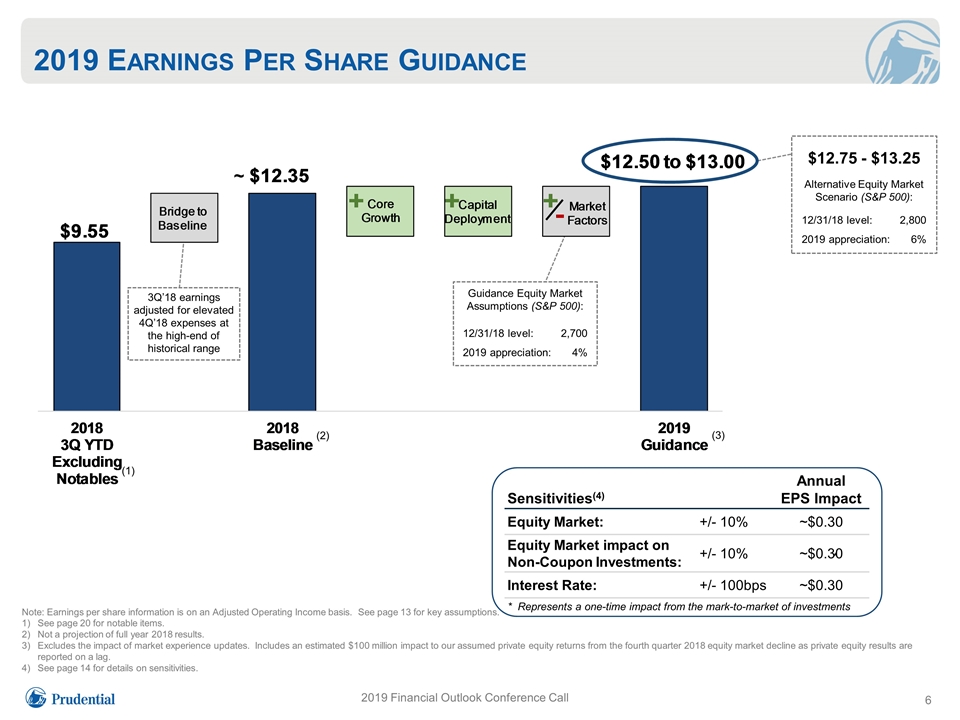
2019 Financial Outlook Conference Call 2019 Earnings Per Share Guidance Sensitivities(4) Annual EPS Impact Equity Market: +/- 10% ~$0.30 Equity Market impact on Non-Coupon Investments: +/- 10% ~$0.30 Interest Rate: +/- 100bps ~$0.30 * Represents a one-time impact from the mark-to-market of investments $12.75 - $13.25 Alternative Equity Market Scenario (S&P 500): Guidance Equity Market Assumptions (S&P 500): (2) (3) ~ * 12/31/18 level: 2,700 2019 appreciation: 4% 12/31/18 level: 2,800 2019 appreciation: 6% 3Q’18 earnings adjusted for elevated 4Q’18 expenses at the high-end of historical range (1) Note: Earnings per share information is on an Adjusted Operating Income basis. See page 13 for key assumptions. See page 20 for notable items. Not a projection of full year 2018 results. Excludes the impact of market experience updates. Includes an estimated $100 million impact to our assumed private equity returns from the fourth quarter 2018 equity market decline as private equity results are reported on a lag. See page 14 for details on sensitivities.
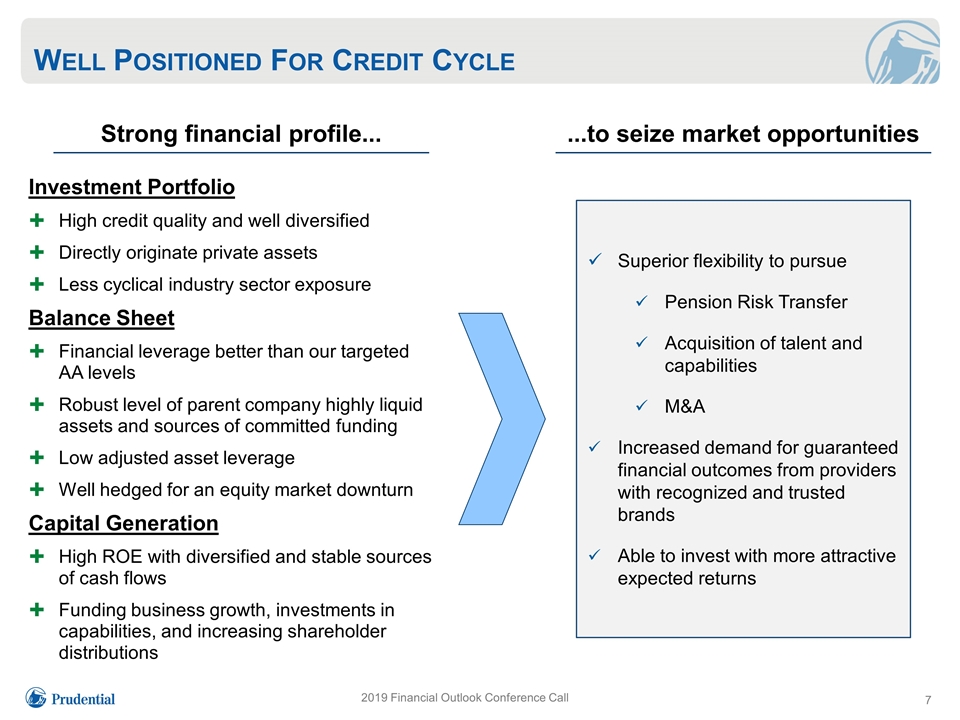
2019 Financial Outlook Conference Call Well Positioned For Credit Cycle Strong financial profile... Investment Portfolio High credit quality and well diversified Directly originate private assets Less cyclical industry sector exposure Balance Sheet Financial leverage better than our targeted AA levels Robust level of parent company highly liquid assets and sources of committed funding Low adjusted asset leverage Well hedged for an equity market downturn Capital Generation High ROE with diversified and stable sources of cash flows Funding business growth, investments in capabilities, and increasing shareholder distributions ...to seize market opportunities Superior flexibility to pursue Pension Risk Transfer Acquisition of talent and capabilities M&A Increased demand for guaranteed financial outcomes from providers with recognized and trusted brands Able to invest with more attractive expected returns
2019 Financial Outlook Conference Call Unlocking Growth by Bringing Financial Opportunity to More Customers Differentiated Business Mix Leading market positions with scale: U.S. Financial Wellness Workplace Solutions Individual Solutions International PGIM Complementary mix produces: Enhanced growth from integrated solutions Earnings diversification Capital benefits Solid Long-Term Track Record Delivering attractive: Earnings per share and book value per share growth Return on equity Capital generation Investing for long-term sustainable growth Strong Financial Profile High quality and diversified investment portfolio Diversified risk profile and well capitalized Significant balance sheet flexibility and capital capacity to be opportunistic
Prudential Financial, Inc. Appendix December 6, 2018
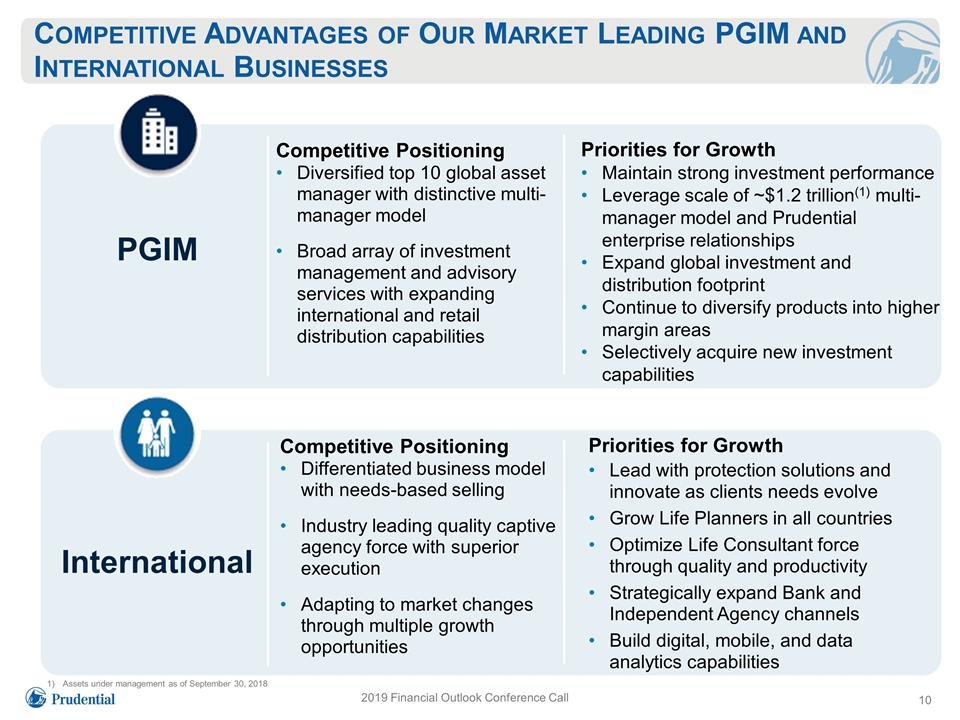
2019 Financial Outlook Conference Call Competitive Advantages of Our Market Leading PGIM and International Businesses PGIM Competitive Positioning Diversified top 10 global asset manager with distinctive multi-manager model Broad array of investment management and advisory services with expanding international and retail distribution capabilities Priorities for Growth Maintain strong investment performance Leverage scale of ~$1.2 trillion(1) multi-manager model and Prudential enterprise relationships Expand global investment and distribution footprint Continue to diversify products into higher margin areas Selectively acquire new investment capabilities International Competitive Positioning Differentiated business model with needs-based selling Industry leading quality captive agency force with superior execution Adapting to market changes through multiple growth opportunities Priorities for Growth Lead with protection solutions and innovate as clients needs evolve Grow Life Planners in all countries Optimize Life Consultant force through quality and productivity Strategically expand Bank and Independent Agency channels Build digital, mobile, and data analytics capabilities Assets under management as of September 30, 2018
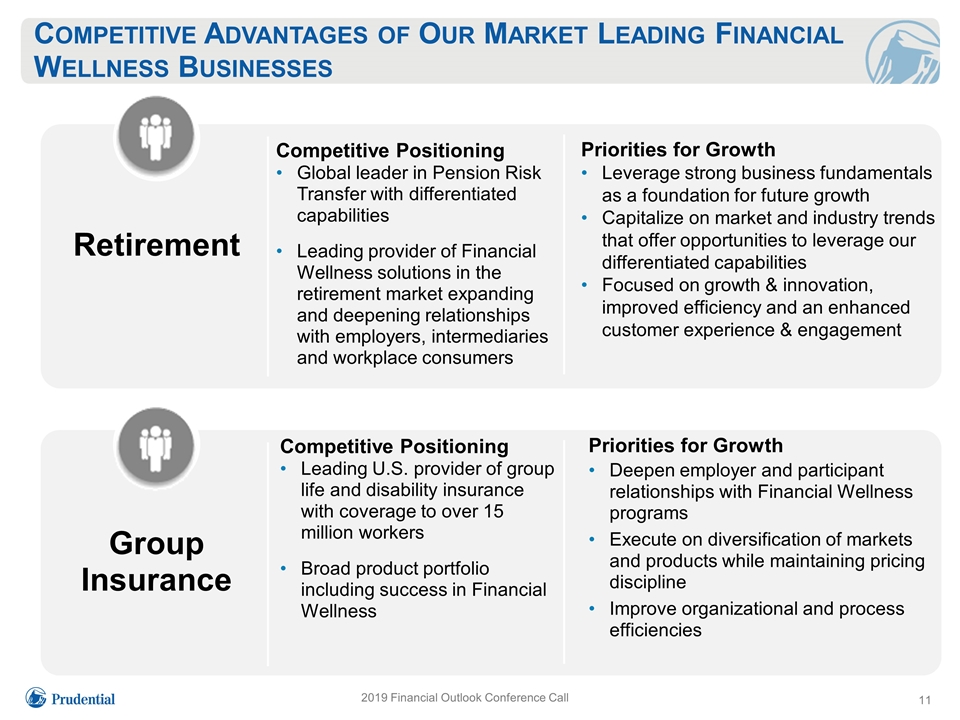
2019 Financial Outlook Conference Call Competitive Advantages of Our Market Leading Financial Wellness Businesses Competitive Positioning Global leader in Pension Risk Transfer with differentiated capabilities Leading provider of Financial Wellness solutions in the retirement market expanding and deepening relationships with employers, intermediaries and workplace consumers Priorities for Growth Leverage strong business fundamentals as a foundation for future growth Capitalize on market and industry trends that offer opportunities to leverage our differentiated capabilities Focused on growth & innovation, improved efficiency and an enhanced customer experience & engagement Competitive Positioning Leading U.S. provider of group life and disability insurance with coverage to over 15 million workers Broad product portfolio including success in Financial Wellness Retirement Group Insurance Priorities for Growth Deepen employer and participant relationships with Financial Wellness programs Execute on diversification of markets and products while maintaining pricing discipline Improve organizational and process efficiencies
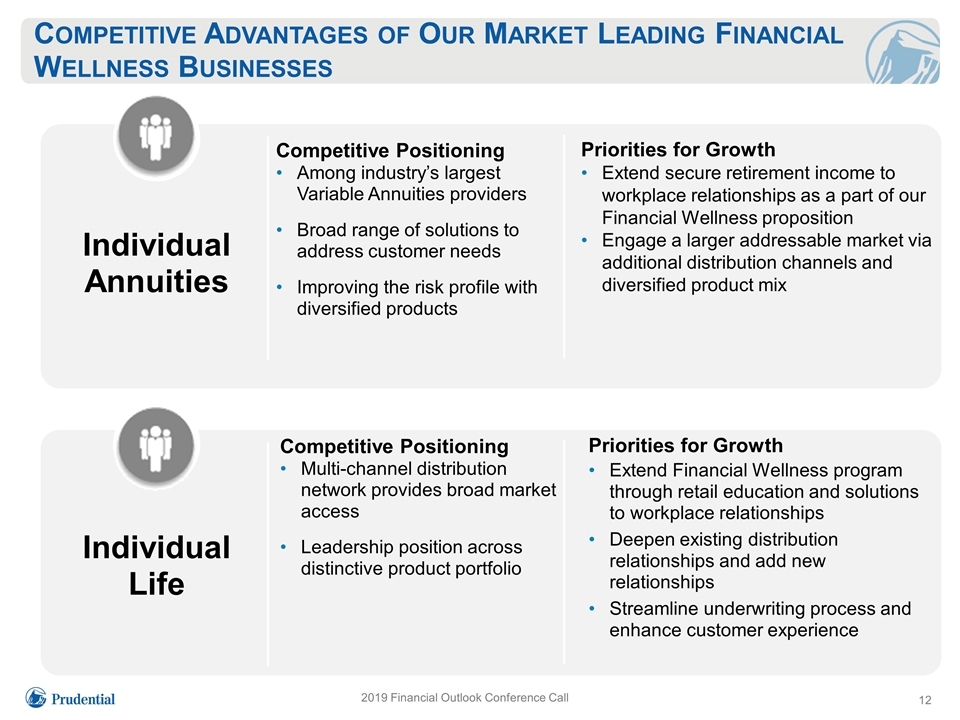
2019 Financial Outlook Conference Call Competitive Advantages of Our Market Leading Financial Wellness Businesses Competitive Positioning Among industry’s largest Variable Annuities providers Broad range of solutions to address customer needs Improving the risk profile with diversified products Priorities for Growth Extend secure retirement income to workplace relationships as a part of our Financial Wellness proposition Engage a larger addressable market via additional distribution channels and diversified product mix Competitive Positioning Multi-channel distribution network provides broad market access Leadership position across distinctive product portfolio Individual Annuities Priorities for Growth Extend Financial Wellness program through retail education and solutions to workplace relationships Deepen existing distribution relationships and add new relationships Streamline underwriting process and enhance customer experience Individual Life
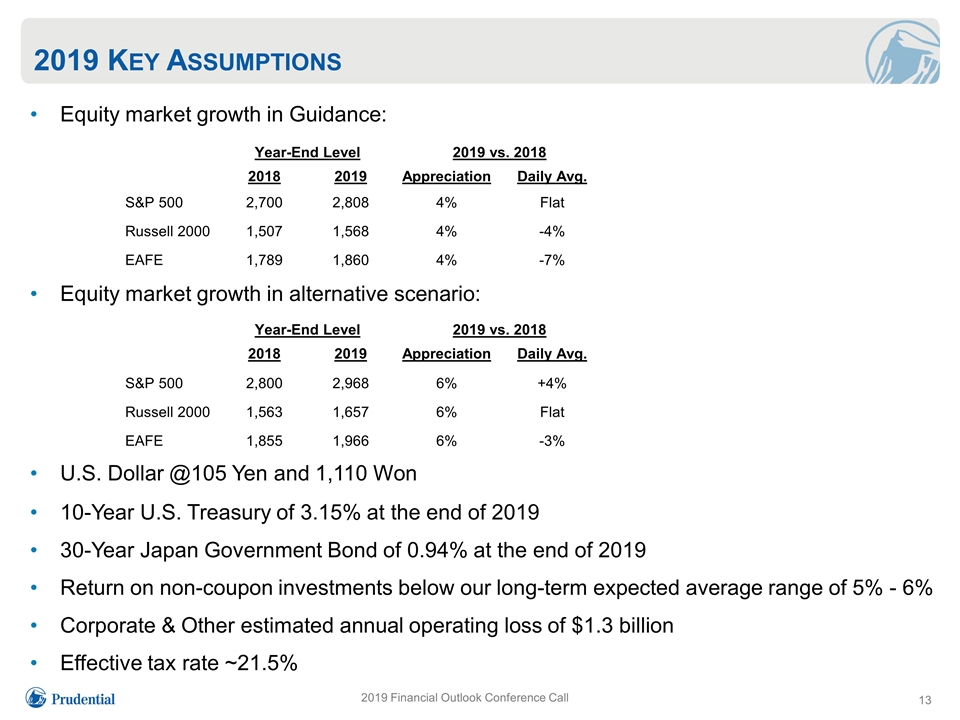
2019 Financial Outlook Conference Call 2019 Key Assumptions Equity market growth in Guidance: Equity market growth in alternative scenario: U.S. Dollar @105 Yen and 1,110 Won 10-Year U.S. Treasury of 3.15% at the end of 2019 30-Year Japan Government Bond of 0.94% at the end of 2019 Return on non-coupon investments below our long-term expected average range of 5% - 6% Corporate & Other estimated annual operating loss of $1.3 billion Effective tax rate ~21.5% Year-End Level 2019 vs. 2018 2018 2019 Appreciation Daily Avg. S&P 500 2,700 2,808 4% Flat Russell 2000 1,507 1,568 4% -4% EAFE 1,789 1,860 4% -7% Year-End Level 2019 vs. 2018 2018 2019 Appreciation Daily Avg. S&P 500 2,800 2,968 6% +4% Russell 2000 1,563 1,657 6% Flat EAFE 1,855 1,966 6% -3%
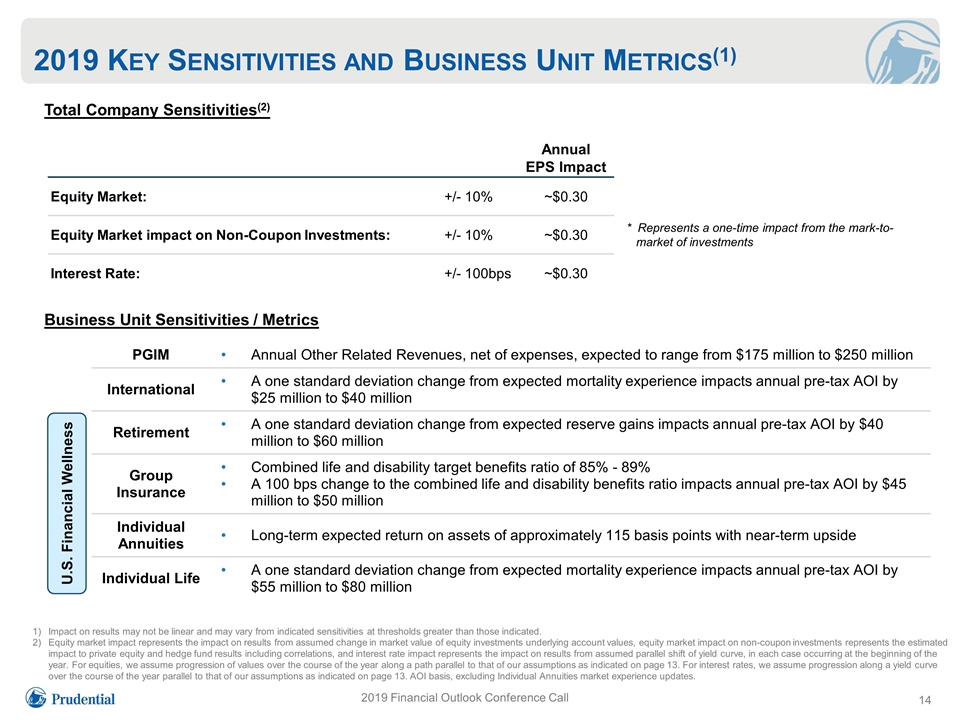
2019 Financial Outlook Conference Call 2019 Key Sensitivities and Business Unit Metrics(1) Total Company Sensitivities(2) Business Unit Sensitivities / Metrics PGIM Annual Other Related Revenues, net of expenses, expected to range from $175 million to $250 million International A one standard deviation change from expected mortality experience impacts annual pre-tax AOI by $25 million to $40 million Retirement A one standard deviation change from expected reserve gains impacts annual pre-tax AOI by $40 million to $60 million Group Insurance Combined life and disability target benefits ratio of 85% - 89% A 100 bps change to the combined life and disability benefits ratio impacts annual pre-tax AOI by $45 million to $50 million Individual Annuities Long-term expected return on assets of approximately 115 basis points with near-term upside Individual Life A one standard deviation change from expected mortality experience impacts annual pre-tax AOI by $55 million to $80 million U.S. Financial Wellness Impact on results may not be linear and may vary from indicated sensitivities at thresholds greater than those indicated. Equity market impact represents the impact on results from assumed change in market value of equity investments underlying account values, equity market impact on non-coupon investments represents the estimated impact to private equity and hedge fund results including correlations, and interest rate impact represents the impact on results from assumed parallel shift of yield curve, in each case occurring at the beginning of the year. For equities, we assume progression of values over the course of the year along a path parallel to that of our assumptions as indicated on page 13. For interest rates, we assume progression along a yield curve over the course of the year parallel to that of our assumptions as indicated on page 13. AOI basis, excluding Individual Annuities market experience updates. Annual EPS Impact Equity Market: +/- 10% ~$0.30 Equity Market impact on Non-Coupon Investments: +/- 10% ~$0.30 Interest Rate: +/- 100bps ~$0.30 * Represents a one-time impact from the mark-to-market of investments
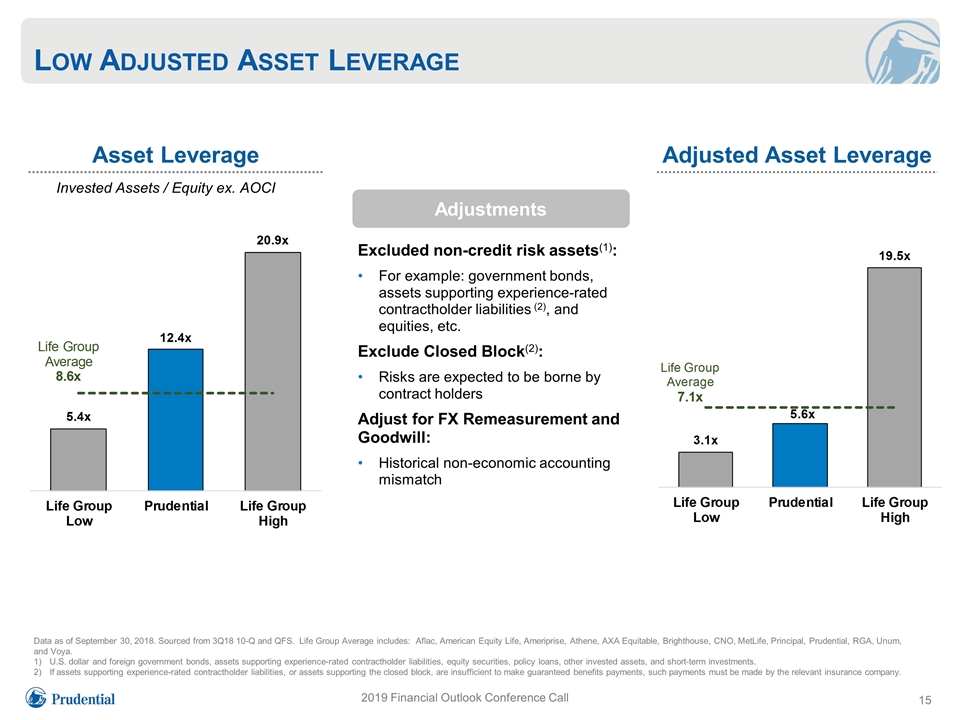
2019 Financial Outlook Conference Call Low Adjusted Asset Leverage Asset Leverage Adjusted Asset Leverage Excluded non-credit risk assets(1): For example: government bonds, assets supporting experience-rated contractholder liabilities (2), and equities, etc. Exclude Closed Block(2): Risks are expected to be borne by contract holders Adjust for FX Remeasurement and Goodwill: Historical non-economic accounting mismatch Adjustments Data as of September 30, 2018. Sourced from 3Q18 10-Q and QFS. Life Group Average includes: Aflac, American Equity Life, Ameriprise, Athene, AXA Equitable, Brighthouse, CNO, MetLife, Principal, Prudential, RGA, Unum, and Voya. U.S. dollar and foreign government bonds, assets supporting experience-rated contractholder liabilities, equity securities, policy loans, other invested assets, and short-term investments. If assets supporting experience-rated contractholder liabilities, or assets supporting the closed block, are insufficient to make guaranteed benefits payments, such payments must be made by the relevant insurance company. Invested Assets / Equity ex. AOCI
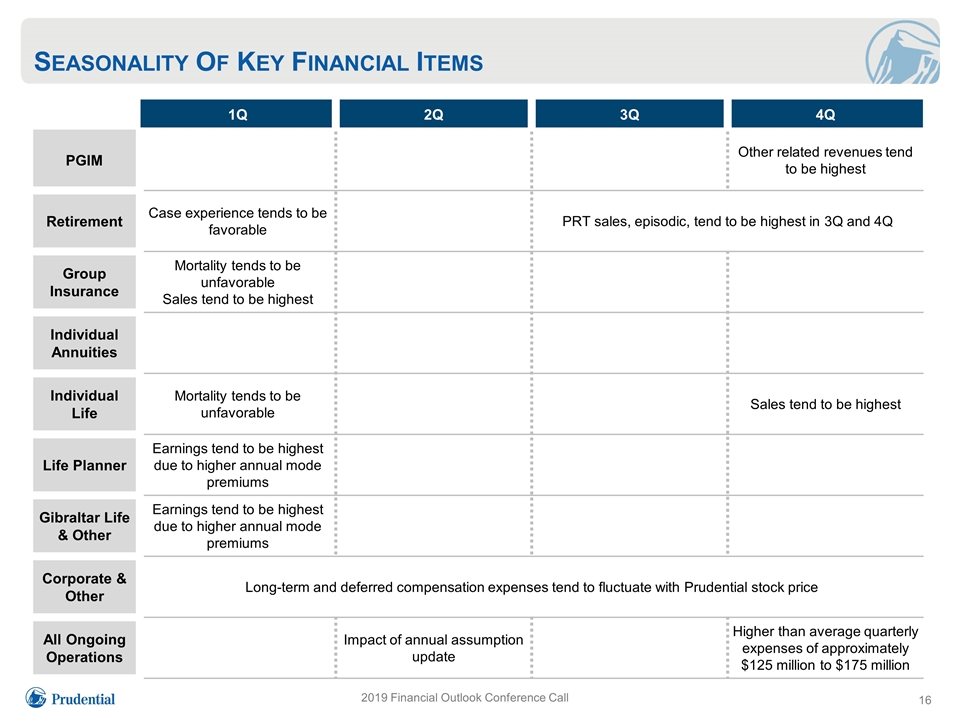
Seasonality Of Key Financial Items 1Q 2Q 3Q 4Q PGIM Other related revenues tend to be highest Retirement Case experience tends to be favorable PRT sales, episodic, tend to be highest in 3Q and 4Q Group Insurance Mortality tends to be unfavorable Sales tend to be highest Individual Annuities Individual Life Mortality tends to be unfavorable Sales tend to be highest Life Planner Earnings tend to be highest due to higher annual mode premiums Gibraltar Life & Other Earnings tend to be highest due to higher annual mode premiums Corporate & Other Long-term and deferred compensation expenses tend to fluctuate with Prudential stock price All Ongoing Operations Impact of annual assumption update Higher than average quarterly expenses of approximately $125 million to $175 million 2019 Financial Outlook Conference Call
Forward-Looking Statements, Non-GAAP Measures, and Other Disclosures Certain of the statements included in this presentation, including our expected earnings per share and the underlying assumptions, financial targets, market opportunities, priorities for growth, and sensitivities and metrics constitute forward-looking statements within the meaning of the U.S. Private Securities Litigation Reform Act of 1995. Words such as “expects,” “believes,” “anticipates,” “includes,” “plans,” “assumes,” “estimates,” “projects,” “intends,” “should,” “will,” “shall” or variations of such words are generally part of forward-looking statements. Forward-looking statements are made based on management’s current expectations and beliefs concerning future developments and their potential effects upon Prudential Financial, Inc. and its subsidiaries. There can be no assurance that future developments affecting Prudential Financial, Inc. and its subsidiaries will be those anticipated by management. These forward-looking statements are not a guarantee of future performance and involve risks and uncertainties, and there are certain important factors that could cause actual results to differ, possibly materially, from expectations or estimates reflected in such forward-looking statements, including, among others: (1) losses on investments or financial contracts due to deterioration in credit quality or value, or counterparty default; (2) losses on insurance products due to mortality experience, morbidity experience or policyholder behavior experience that differs significantly from our expectations when we price our products; (3) changes in interest rates, equity prices and foreign currency exchange rates that may (a) adversely impact the profitability of our products, the value of separate accounts supporting these products or the value of assets we manage, (b) result in losses on derivatives we use to hedge risk or increase collateral posting requirements and (c) limit opportunities to invest at appropriate returns; (4) guarantees within certain of our products, in particular our variable annuities, which are market sensitive and may decrease our earnings or increase the volatility of our results of operations or financial position; (5) liquidity needs resulting from (a) derivative collateral market exposure, (b) asset/liability mismatches, (c) the lack of available funding in the financial markets or (d) unexpected cash demands due to severe mortality calamity or lapse events; (6) financial or customer losses, or regulatory and legal actions, due to inadequate or failed processes or systems, human error or misconduct, and external events, such as (a) disruption of our systems and data, (b) an information security breach, (c) a failure to protect the privacy of sensitive data or (d) reliance on third-parties, including to distribute our products; (7) changes in the regulatory landscape, including related to (a) changes in tax laws, (b) fiduciary rule developments, (c) U.S. state insurance laws and developments regarding group-wide supervision, capital and reserves, (d) insurer capital standards outside the U.S. and (e) privacy and cybersecurity regulation; (8) technological changes which may adversely impact companies in our investment portfolio or cause insurance experience to deviate from our assumptions; (9) ratings downgrades; (10) market conditions that may adversely affect the sales or persistency of our products; (11) competition; and (12) reputational damage. Prudential Financial, Inc. does not undertake to update any particular forward-looking statement included in this document. See “Risk Factors” included in the Annual Report on Form 10-K for the year ended December 31, 2017 for discussion of certain risks relating to our businesses and investment in our securities. This presentation also includes references to adjusted operating income, adjusted book value and adjusted operating return on equity, which is based on adjusted operating income and adjusted book value. Consolidated adjusted operating income and adjusted book value are not calculated based on accounting principles generally accepted in the United States of America (GAAP). For additional information about adjusted operating income, adjusted book value and adjusted operating return on equity and the comparable GAAP measures, including reconciliations between the comparable measures, please refer to our quarterly results news releases, which are available on our Web site at www.investor.prudential.com. Reconciliations are also included as part of this presentation. Our expectation of Common Stock earnings per share is based on after-tax adjusted operating income. Due to the inherent difficulty in reliably quantifying future realized investment gains/losses and changes in asset and liability values given their unknown timing and potential significance, we cannot, without unreasonable effort, provide a measure of our Common Stock earnings per share expectation based on income from continuing operations, which is the GAAP measure most comparable to adjusted operating income. Analysts’ estimates or forecasts are theirs alone and do not represent the Company’s estimates or forecasts. The Company does not by its reference to such information imply its endorsement or concurrence. ____________________________________________________________________________ Prudential Financial, Inc. of the United States is not affiliated with Prudential plc which is headquartered in the United Kingdom. 2019 Financial Outlook Conference Call
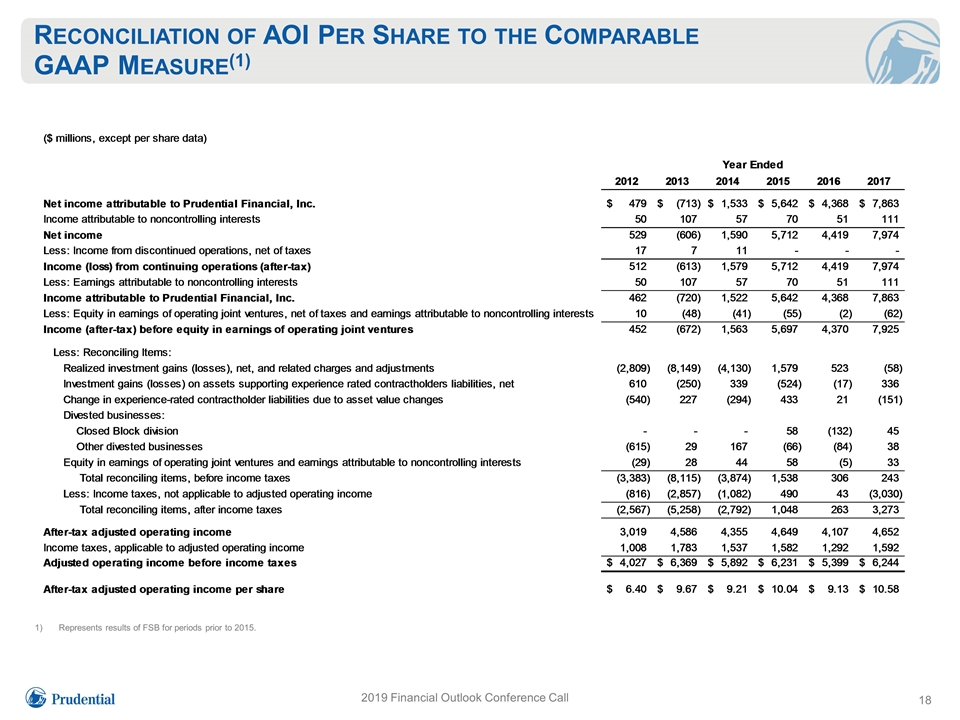
2019 Financial Outlook Conference Call Reconciliation of AOI Per Share to the Comparable GAAP Measure(1) Represents results of FSB for periods prior to 2015.
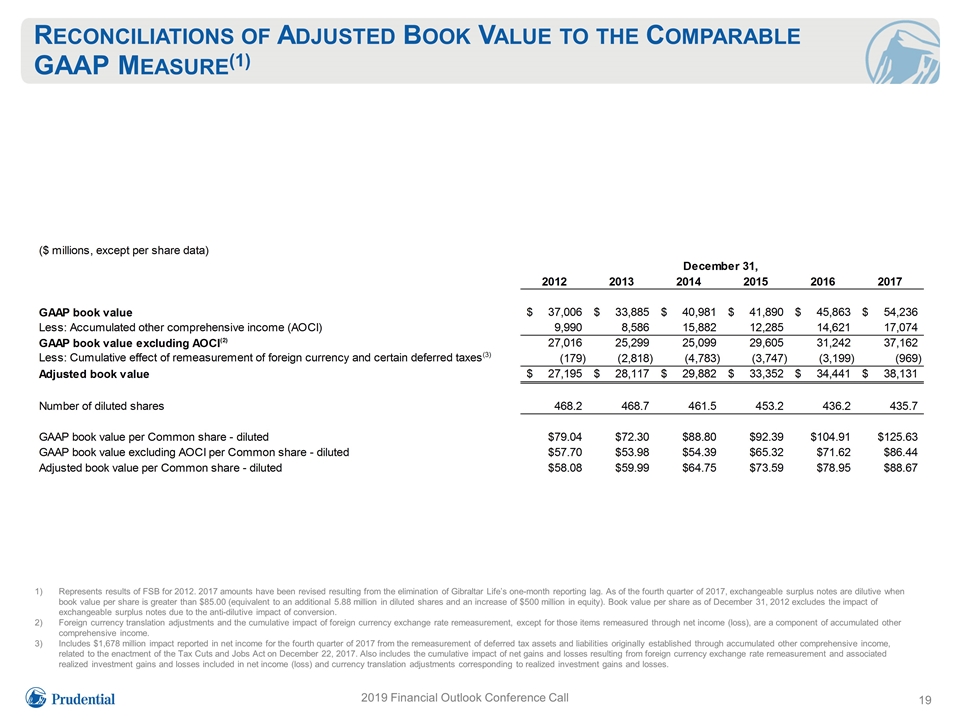
19 2019 Financial Outlook Conference Call Reconciliations of Adjusted Book Value to the Comparable GAAP Measure(1) Represents results of FSB for 2012. 2017 amounts have been revised resulting from the elimination of Gibraltar Life’s one-month reporting lag. As of the fourth quarter of 2017, exchangeable surplus notes are dilutive when book value per share is greater than $85.00 (equivalent to an additional 5.88 million in diluted shares and an increase of $500 million in equity). Book value per share as of December 31, 2012 excludes the impact of exchangeable surplus notes due to the anti-dilutive impact of conversion. Foreign currency translation adjustments and the cumulative impact of foreign currency exchange rate remeasurement, except for those items remeasured through net income (loss), are a component of accumulated other comprehensive income. Includes $1,678 million impact reported in net income for the fourth quarter of 2017 from the remeasurement of deferred tax assets and liabilities originally established through accumulated other comprehensive income, related to the enactment of the Tax Cuts and Jobs Act on December 22, 2017. Also includes the cumulative impact of net gains and losses resulting from foreign currency exchange rate remeasurement and associated realized investment gains and losses included in net income (loss) and currency translation adjustments corresponding to realized investment gains and losses.
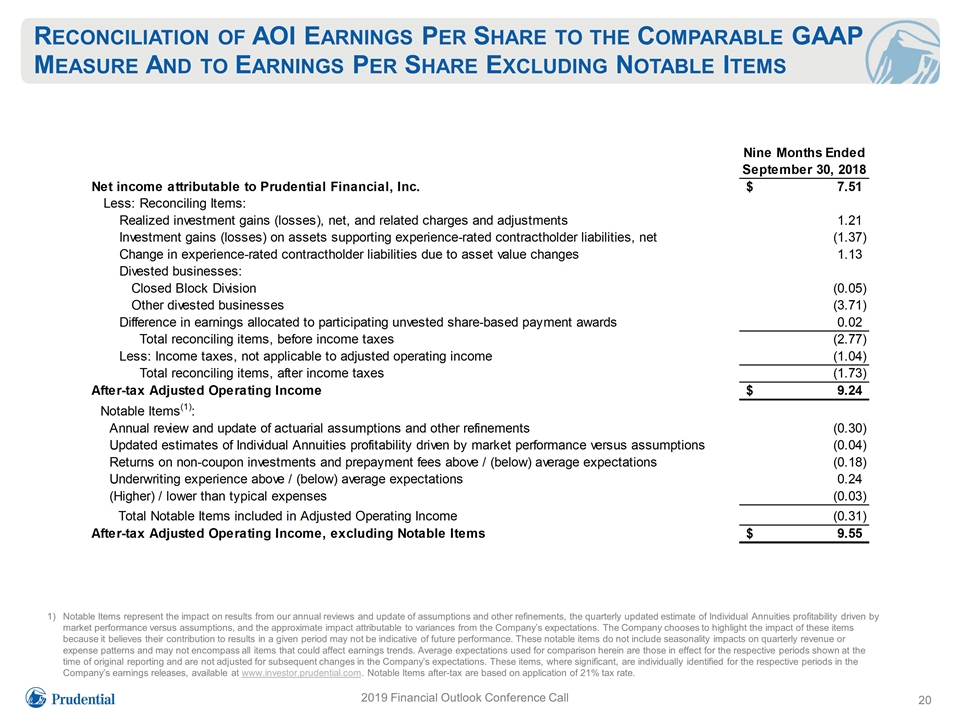
20 2019 Financial Outlook Conference Call Reconciliation of AOI Earnings Per Share to the Comparable GAAP Measure And to Earnings Per Share Excluding Notable Items Notable Items represent the impact on results from our annual reviews and update of assumptions and other refinements, the quarterly updated estimate of Individual Annuities profitability driven by market performance versus assumptions, and the approximate impact attributable to variances from the Company’s expectations. The Company chooses to highlight the impact of these items because it believes their contribution to results in a given period may not be indicative of future performance. These notable items do not include seasonality impacts on quarterly revenue or expense patterns and may not encompass all items that could affect earnings trends. Average expectations used for comparison herein are those in effect for the respective periods shown at the time of original reporting and are not adjusted for subsequent changes in the Company’s expectations. These items, where significant, are individually identified for the respective periods in the Company’s earnings releases, available at www.investor.prudential.com. Notable Items after-tax are based on application of 21% tax rate.